. 2025 Jan;68(1):217-230.
doi: 10.1007/s00125-024-06293-3. Epub 2024 Oct 23.

Molecular mechanisms underlying glucose-dependent insulinotropic polypeptide secretion in human duodenal organoids

Affiliations

Molecular mechanisms underlying glucose-dependent insulinotropic polypeptide secretion in human duodenal organoids

Nunzio Guccio et al. Diabetologia. 2025 Jan.

Abstract

Aims/hypothesis: Glucose-dependent insulinotropic polypeptide (GIP) is an incretin hormone secreted by enteroendocrine K cells in the proximal small intestine. This study aimed to explore the function of human K cells at the molecular and cellular levels.

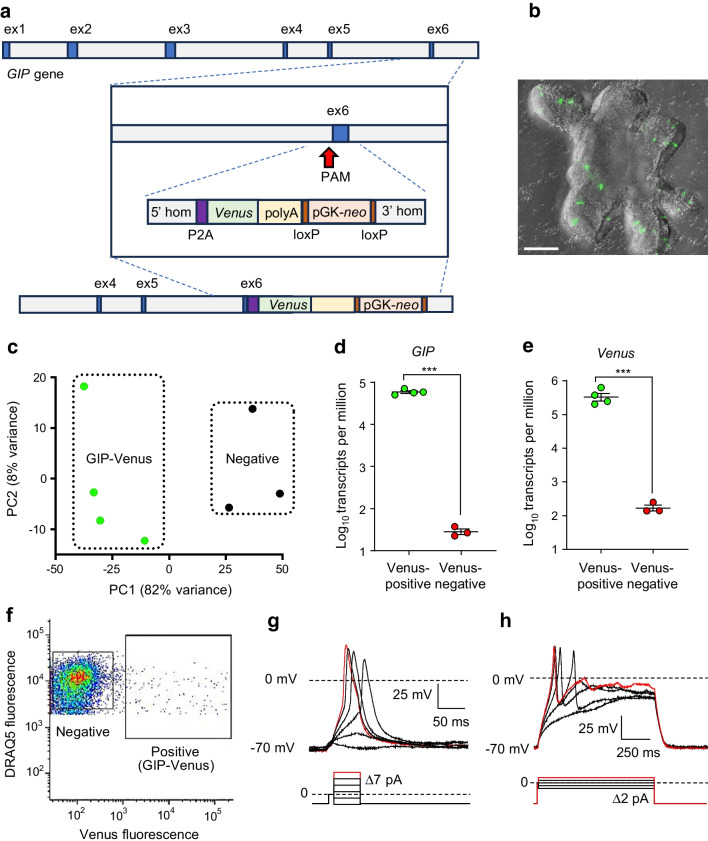
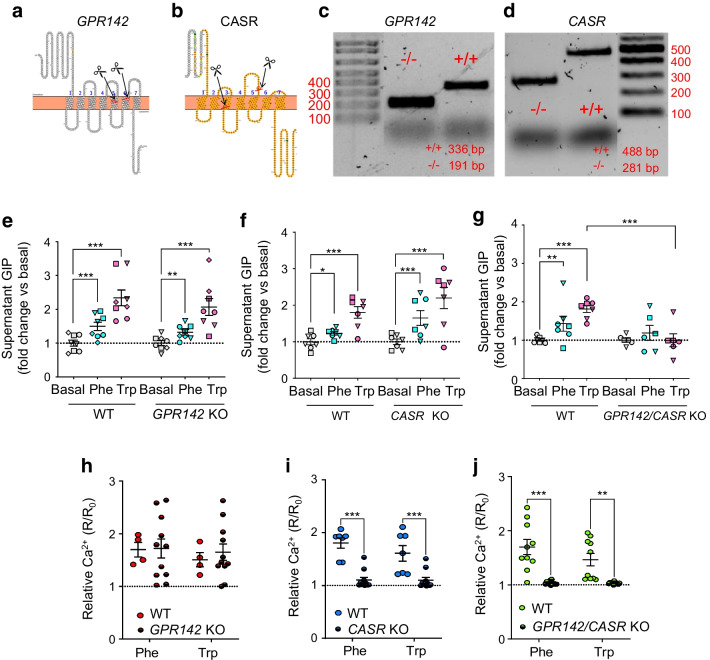
Methods: CRISPR-Cas9 homology-directed repair was used to insert transgenes encoding a yellow fluorescent protein (Venus) or an Epac-based cAMP sensor (Epac-S-H187) in the GIP locus in human duodenal-derived organoids. Fluorescently labelled K cells were purified by FACS for RNA-seq and peptidomic analysis. GIP reporter organoids were employed for GIP secretion assays, live-cell imaging of Ca2+ using Fura-2 and cAMP using Epac-S-H187, and basic electrophysiological characterisation. The G protein-coupled receptor genes GPR142 and CASR were knocked out to evaluate roles in amino acid sensing.

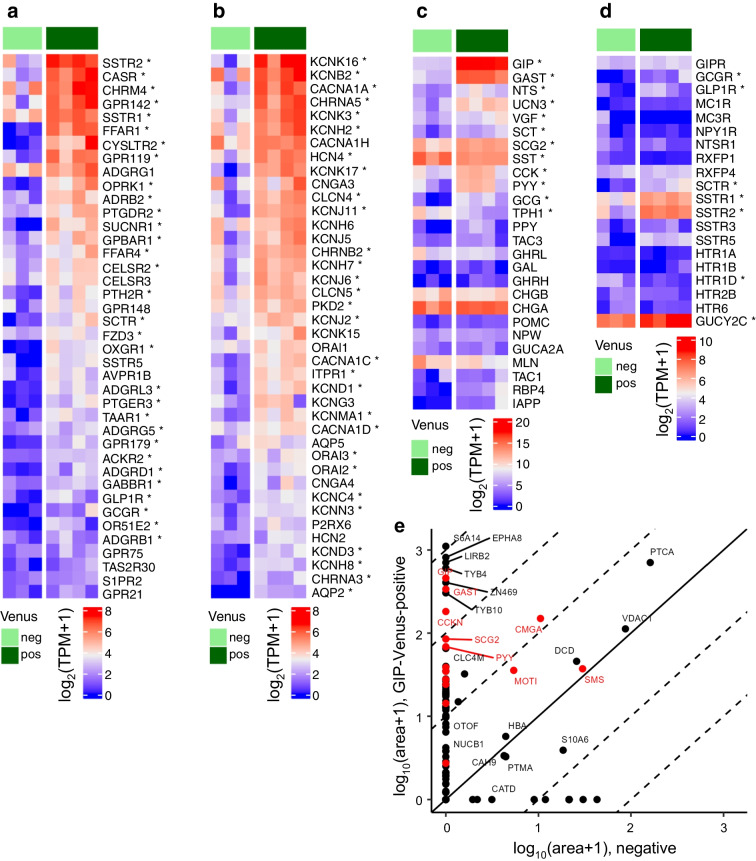
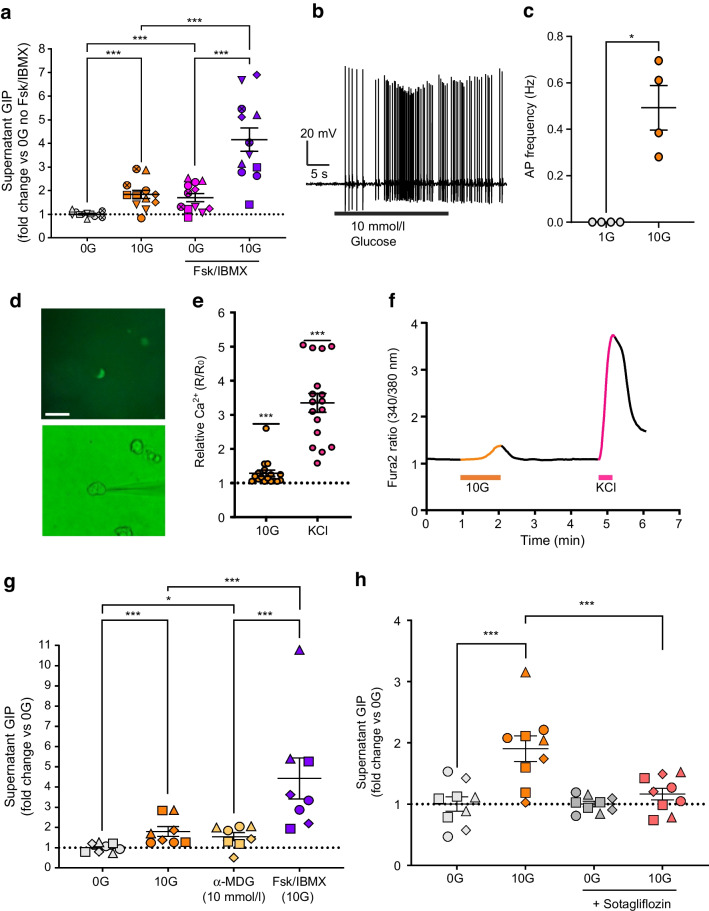
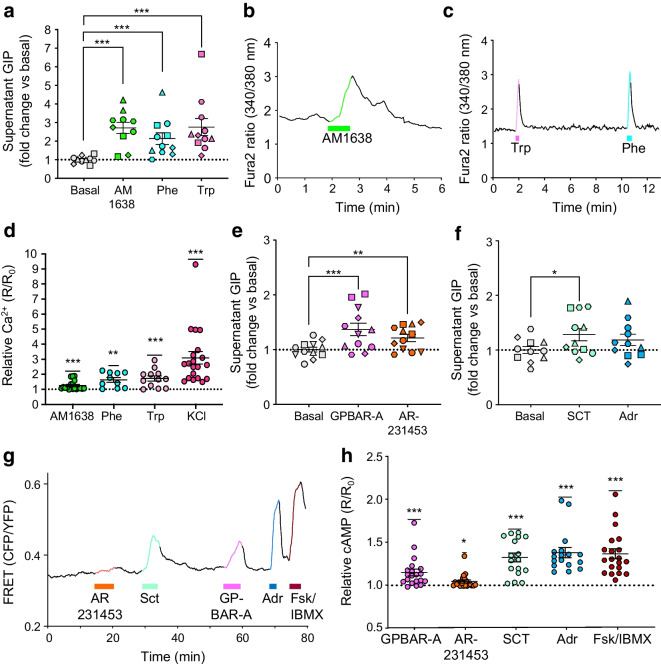
Results: RNA-seq of human duodenal K cells revealed enrichment of several G protein-coupled receptors involved in nutrient sensing, including FFAR1, GPBAR1, GPR119, CASR and GPR142. Glucose induced action potential firing and cytosolic Ca2+ elevation and caused a 1.8-fold increase in GIP secretion, which was inhibited by the sodium glucose co-transporter 1/2 (SGLT1/2) blocker sotagliflozin. Activation of the long-chain fatty acid receptor free fatty acid receptor 1 (FFAR1) induced a 2.7-fold increase in GIP secretion, while tryptophan and phenylalanine stimulated secretion by 2.8- and 2.1-fold, respectively. While CASR knockout blunted intracellular Ca2+ responses, a CASR/GPR142 double knockout was needed to reduce GIP secretory responses to aromatic amino acids.

Conclusions/interpretation: The newly generated human organoid K cell model enables transcriptomic and functional characterisation of nutrient-sensing pathways involved in human GIP secretion. Both calcium-sensing receptor (CASR) and G protein-coupled receptor 142 (GPR142) contribute to protein-stimulated GIP secretion. This model will be further used to identify potential targets for modulation of native GIP secretion in diabetes and obesity.

Keywords: CASR; GIP; GPR142; Organoid; SGLT1.


Conflict of interest statement

Acknowledgements: We thank the MRL Genomics and Transcriptomics Core, the Core Biochemical Assay Laboratory (CBAL), the Flow Cytometry Core at CIMR, the CRUK Cambridge Institute Genomics Core and Addenbrooke’s Tissue Bank. Some of the data were presented as an abstract at the 58th EASD Annual Meeting of the EASD in 2022 and the 5th European Incretin Study Group meeting in 2024. Data availability: RNA-seq data are deposited in the National Center for Biotechnology Information–Gene Expression Omnibus (NCBI GEO) repository (GSE271017). Mass spectrometry proteomics data are deposited to the ProteomeXchange Consortium via the PRIDE partner repository (PXD052659). Funding: This research was funded by a Wellcome joint investigator award to FR/FMG (220271/Z/20/Z) and the MRC-Metabolic Diseases Unit (MRC_MC_UU_12012/3). NG was funded by an MRC studentship. Core support was provided by the MRC (MRC_MC_UU_00014/5) and Wellcome (100574/Z/12/Z). The LC-MS/MS instrument was funded by the MRC (MR/M009041/1). Authors’ relationships and activities: FMG and FR received funding from AstraZeneca and Eli Lilly for non-overlapping research on other projects. They received sponsorship from AstraZeneca, Eli Lilly, Sun Pharma and Mercodia to run the 5th European Incretin Study Group conference in Cambridge (April 2024). The authors declare that there are no other relationships or activities that might bias, or be perceived to bias, their work. Contribution statement: NG generated the majority of the results and wrote the first draft of the manuscript. CA and AD did the electrophysiology. ELM, MS-H and RBB provided training and support, including for organoid maintenance, CRISPR and live-cell imaging, helping with initial data collection and analysis. RGK performed and analysed LC-MS/MS. CAS performed bioinformatics analysis of RNA-seq. FR and FMG designed and oversaw the study, revised the manuscript and are guarantors of the work. All authors contributed to manuscript revision and approved the published version.

Figures

Fig. 1
Fig. 1
Human GIP-Venus duodenal organoids are electrically excitable. (a) Schematic representing the knockin strategy to insert the Venus transgene in exon 6 of the GIP gene using CRISPR-Cas9 HDR, allowing for bicistronic expression of the Venus gene under the GIP promoter. (b) Representative image of a GIP-Venus human organoid generated using a Celldiscoverer 7 system, equipped with a Plan-Apochromat ×5 objective (numerical aperture [NA] 0.35) coupled with a ×2 tube lens and an Axiocam 506 CCD camera (Zeiss, Cambridge, UK). The Venus signal was imaged using a 470 nm light-emitting diode (LED) light source and 524/50 emission filter (depicted in green), and phase gradient contrast images using the transmission LED lamp. The image is a maximum projection over a 172.36 µm z-stack of 63 images. Effective voxel size is 0.459 × 0.459 × 2.780 µm3. Scale bar, 100 µm. (c) PCA of GIP-Venus-positive (green) and negative (black) cell populations following bulk RNA-seq. (d, e) Differential GIP (d) and Venus (e) expression in Venus-positive (n=4) and negative (n=3) cell populations. Data are presented as mean ± SE; ***p<0.001 by two-tailed t test. (f) Representative FACS plot. GIP-Venus-positive and negative cells were isolated based on Venus fluorescence intensity, after selection of live DAPI-negative and DRAQ5-positive cells only. (g) Representative traces of perforated patch, whole-cell current clamp recording of a Venus-positive K cell held at −70 mV in response to the injection of short depolarising pulses (50 ms) of increasing amplitude in 7 pA increments, as indicated. (h) As shown in (g) using longer current injection pulses (500 ms) at 2 pA increments, as indicated. ex, exon; PAM, protospacer adjacent motif; PC, principal component
Fig. 2
Fig. 2
Transcriptomic and peptidomic characterisation of Venus-positive K cells. (ad) Heatmaps showing: (a) top 40 highest expressed GPCRs; (b) top 40 ion channels and transporters; (c) gut peptides (plus tryptophane hydroxylase 1 [TPH1], the enzyme critical for serotonin production in enterochromaffin cells); (d) receptors for enteroendocrine hormones. *Significant differential expression between GIP-Venus K cells compared with the Venus-negative population (FDR<0.05). (e) LC-MS/MS peptidomic analysis of purified GIP-Venus positive and Venus-negative cells (the individual peptides detected are combined and associated to the parental protein, labelled by protein name [SwissProt] and expressed as mean peak area). FDR, false discovery rate; neg, negative; pos, positive; TPM, transcripts per million
Fig. 3
Fig. 3
Glucose triggers firing of action potentials and GIP secretion in human K cells. (a) Secretion of GIP from GIP-Venus human duodenal organoids following incubation with glucose (10 mmol/l; 10G), in the presence or absence of Fsk (10 μmol/l) and IBMX (100 μmol/l), expressed as fold change vs basal condition (0 mmol/l glucose; 0G) measured in parallel (n=12 wells from six independent experiments; matching symbols indicate results from the same experiment). (b) Representative trace of perforated patch, whole-cell current clamp recording of a Venus-positive K cell initially perfused with 1 mmol/l glucose and exhibiting action potentials after perfusion with 10 mmol/l glucose, without current injection. (c) Mean action potential frequencies (Hz) of Venus-positive K cells recorded in 1 and 10 mmol/l glucose (G). (d) Images of Venus-positive K cells studied by perforated patch-clamp electrophysiology. K cells were identified by the expression of Venus (top panel) and patched using phase contrast (bottom panel). Scale bar, 50 μm. (e) Increase in intracellular calcium levels across different cells, shown as ratio between R (Fura-2 ratio during perfusion of stimulus) and R0 (Fura-2 ratio during perfusion of basal solution) (n=17 cells from nine independent experiments). (f) Representative Fura-2 (340/380 nm) ratio trace of a single K cell perfused with glucose (10 mmol/l, orange) and KCl (positive control; 70 mmol/l, pink). (g) Secretion of GIP from duodenal organoids in response to glucose (10 mmol/l) and α-MDG (10 mmol/l). Control solution (0G) contained 0 mmol/l glucose. Fsk (10 μmol/l) and IBMX (100 μmol/l) with 10 mmol/l glucose were used as positive control (n=8 wells from four independent experiments; matching symbols indicate results from the same experiment). (h) Inhibition of GIP release at 10 mmol/l glucose (10G) following 30 min pre- and 2 h co-incubation of duodenal organoids with sotagliflozin (5 μmol/l), expressed as fold change vs basal condition (0 mmol/l glucose; 0G) measured in parallel (n=9 wells from four independent experiments; matching symbols indicate results from the same experiment). Data are presented as mean ± SE. *p<0.05, ***p<0.001. (a, g, h) Linear regression and cluster-robust SE estimation with Huber–White SEs; (c) paired t test; (e) one-sample Wilcoxon test. AP, action potential; Fsk, forskolin
Fig. 4
Fig. 4
Stimulation of GIP release by AAs, LCFAs, bile acids and other small molecules. (a, e, f) Secretion of GIP from GIP-Venus human duodenal organoids in response to the stimuli indicated, expressed as fold change vs basal condition (1 mmol/l glucose) measured in parallel. The stimuli included AM1638 (10 μmol/l), phenylalanine (20 mmol/l), tryptophan (20 mmol/l), GPBAR-A (3 μmol/l), AR231453 (100 nmol/l), SCT (100 nmol/l) and adrenaline (30 μmol/l). All test solutions contained 1 mmol/l glucose (n=10–12 wells from 5–6 independent experiments; matching symbols indicate results from the same experiment). (b, c) Representative Fura-2 (340/380) ratio traces of single K cells perfused with AM1638 (10 μmol/l) and aromatic AAs phenylalanine and tryptophan (20 mmol/l), as indicated by the horizontal bars. (d) Mean data collected as in (b, c), shown as ratio between R (Fura-2 ratio during perfusion of stimulus) and R0 (Fura-2 ratio during perfusion of basal solution) (n=10–19 cells from 3–6 independent experiments). (g) Representative FRET (CFP/YFP) ratio trace of single K cell perfused with GPBAR-A (3 μmol/l), AR231453 (100 nmol/l), SCT (100 nmol/l), adrenaline (30 μmol/l) and positive control forskolin (Fsk)/IBMX (10 μmol/l/100 μmol/l), as indicated by the horizontal bars. (h) Mean data collected as in (g), shown as ratio between maximal CFP/YFP ratio (R) during perfusion of stimulus and maximal CFP/YFP ratio (R0) during perfusion of basal solution (n=17–19 from 4–5 independent experiments). Data are presented as mean ± SE. *p<0.05, **p<0.01, ***p<0.001. (a, e, f) Linear regression and cluster-robust SE estimation with Huber–White SEs; (d, h) one-sample Wilcoxon test. Adr, adrenaline
Fig. 5
Fig. 5
Unravelling the role of CASR and GPR142 in AA sensing in K cells. (a, b) Schematics representing GPR142 and CASR CRISPR-Cas9 KO strategy. Sequences between the scissors represent deleted regions. The topological structures of the two receptors were generated using Protter (version 1.0; https://wlab.ethz.ch/protter/start/). (c, d) Representative agarose gels showing PCR genotyping results for WT (+/+) and homozygous (−/−) GPR142 (c) and CASR (d) KO human GIP-Venus duodenal organoids; expected band sizes for WT and KO alleles are indicated in base pairs. (eg) Secretion of GIP following stimulation with phenylalanine (20 mmol/l) and tryptophan (20 mmol/l) in WT and GPR142 KO (e), CASR KO (f) and double KO (g) organoids, respectively. GIP release is expressed as fold change vs basal condition. All secretion experiments for KO lines were carried out in parallel with the WT line (n=6–8 wells from 3–4 independent experiments; matching symbols indicate results from the same experiment). (hj) Increase in intracellular calcium levels in response to phenylalanine (20 mmol/l) and tryptophan (20 mmol/l) across K cells derived from WT and GPR142 KO (h), CASR KO (i) and double KO (j) organoids, respectively. The increase is shown as ratio between R (Fura-2 ratio during perfusion of stimulus) and R0 (Fura-2 ratio during perfusion of basal solution) (n=4–11 cells from 3–4 independent experiments). Data are presented as mean ± SE. *p<0.05, **p<0.01, ***p<0.001. (eg) Linear regression and cluster-robust SE estimation with Huber-White SEs; (hj) two-way ANOVA with Sidak’s multiple comparisons

Similar articles

References

    1. Guccio N, Gribble FM, Reimann F (2022) Glucose-dependent insulinotropic polypeptide-a postprandial hormone with unharnessed metabolic potential. Annu Rev Nutr 42:21–44. 10.1146/annurev-nutr-062320-113625 - PubMed
    1. O’Neil PM, Birkenfeld AL, McGowan B et al (2018) Efficacy and safety of semaglutide compared with liraglutide and placebo for weight loss in patients with obesity: a randomised, double-blind, placebo and active controlled, dose-ranging, phase 2 trial. Lancet 392(10148):637–649. 10.1016/S0140-6736(18)31773-2 - PubMed
    1. Rubino D, Abrahamsson N, Davies M et al (2021) Effect of continued weekly subcutaneous Semaglutide vs Placebo on weight loss maintenance in adults with overweight or obesity: The STEP 4 Randomized Clinical Trial. JAMA 325(14):1414–1425. 10.1001/jama.2021.3224 - PMC - PubMed
    1. Nauck MA, Heimesaat MM, Orskov C, Holst JJ, Ebert R, Creutzfeldt W (1993) Preserved incretin activity of glucagon-like peptide 1 [7-36 amide] but not of synthetic human gastric inhibitory polypeptide in patients with type-2 diabetes mellitus. J Clin Invest 91(1):301–307. 10.1172/JCI116186 - PMC - PubMed
    1. Jastreboff AM, Aronne LJ, Ahmad NN et al (2022) Tirzepatide once weekly for the treatment of obesity. N Engl J Med 387(3):205–216. 10.1056/NEJMoa2206038 - PubMed

MeSH terms

LinkOut - more resources