. 2024 Oct 8:15:1445769.
doi: 10.3389/fimmu.2024.1445769. eCollection 2024.

Inflammatory profile of eosinophils in asthma-COPD overlap and eosinophilic COPD: a multi-omics study

Affiliations

Inflammatory profile of eosinophils in asthma-COPD overlap and eosinophilic COPD: a multi-omics study

Keeya Sunata et al. Front Immunol. .

Abstract

Introduction: Elevated blood eosinophil levels in patients with chronic obstructive pulmonary disease (COPD) with or without asthma are linked to increased exacerbations and the effectiveness of inhaled corticosteroid treatment. This study aimed to delineate the inflammatory cellular properties of eosinophils in patients with asthma-COPD overlap (ACO) and eosinophilic COPD (eCOPD).

Methods: Eosinophils were isolated from the peripheral blood of healthy volunteers, patients with non-eCOPD, and those with ACO/eCOPD. Multi-omics analysis involving transcriptomics, proteomics, and lipidomics was performed, followed by bioinformatic data analyses. In vitro experiments using eosinophils from healthy volunteers were conducted to investigate the molecular mechanisms underlying cellular alterations in eosinophils.

Results: Proteomics and transcriptomics analyses revealed cellular characteristics in overall COPD patients represented by viral infection (elevated expression of sterol regulatory element-binding protein-1) and inflammatory responses (elevated levels of IL1 receptor-like 1, Fc epsilon receptor Ig, and transmembrane protein 176B). Cholesterol metabolism enzymes were identified as ACO/eCOPD-related factors. Gene Ontology and pathway enrichment analyses demonstrated the key roles of antiviral responses, cholesterol metabolism, and inflammatory molecules-related signaling pathways in ACO/eCOPD. Lipidomics showed the impaired synthesis of cyclooxygenase-derived mediators including prostaglandin E2 (PGE2) in ACO/eCOPD. In vitro assessment confirmed that IL-33 or TNF-α stimulation combined with IL-5 and IFN-γ stimulation induced cellular signatures in eosinophils in ACO/eCOPD. Atorvastatin, dexamethasone, and PGE2 differentially modulated these inflammatory changes.

Discussion: ACO/eCOPD is associated with viral infection and an inflammatory milieu. Therapeutic strategies using statins and inhaled corticosteroids are recommended to control these pathogenic changes.

Keywords: IL-33; asthma-COPD overlap; chronic obstructive pulmonary disease; eosinophil; interferon-γ; multi-omics; statin; tumor necrosis factor-α.


Conflict of interest statement

The authors declare that the research was conducted in the absence of any commercial or financial relationships that could be construed as a potential conflict of interest. The author(s) declared that they were an editorial board member of Frontiers, at the time of submission. This had no impact on the peer review process and the final decision.

Figures

Figure 1
Figure 1
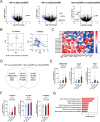
Proteomic analysis of peripheral blood eosinophils from healthy participants (HP) and patients with asthma-COPD overlap (ACO) and eosinophilic COPD (eCOPD) or without eCOPD (non-eCOPD). (A) Volcano plots of differentially expressed proteins among the three groups: HP vs non-eCOPD, HP vs ACO/eCOPD, and non-eCOPD vs ACO/eCOPD. The fold-change was plotted based on log2 fold change and log10 P-values. (B) Principal component analysis (PCA) of groups using representative proteins that distinguished them. Heatmap of PC1 and PC2 components of the proteins that clearly discriminated the differences among the groups in the PCA. (C) Heatmap showing the relative protein expression levels of all samples in the three groups from top to bottom. (D) Cluster classification of protein expression levels converted to Z-scores that presented statistically significant differences among the three groups and were classified into six clusters. These clusters include proteins with the highest expression levels in ACO/eCOPD (Cluster 3), ACO/eCOPD and non-eCOPD (Cluster 4), and non-eCOPD (Cluster 5) groups, respectively. (E) Protein expression levels of representative molecules classified into Clusters 3 and 5: molecules with ACO/eCOPD-specific upregulation and non-eCOPD-specific upregulation. (F) Gene Ontology enrichment analyses of genes in the three clusters (3, 4, and 5). Data show mean ± standard error of the mean; n = 5–6 for each group.
Figure 2
Figure 2
Transcriptomic analysis of peripheral blood eosinophils from healthy participants (HP) and patients with asthma-COPD overlap (ACO) and eosinophilic COPD (eCOPD) or without eosinophilic COPD (non-eCOPD). (A) Volcano plots of differentially expressed genes among the three groups; HP vs. non-eCOPD, HP vs. ACO/eCOPD, and non-eCOPD vs. ACO/eCOPD). Fold change was plotted based on log2 fold change and log10 P-values. (B) Principal component analysis (PCA) of groups using representative genes that distinguish them. Heatmap of PC1 and PC2 components of all genes in the PCA. (C) Heatmap showing representative gene expression levels of all samples in the three groups. (D) Venn diagram demonstrating differences in gene expression signatures among the three groups. (E, F) Gene expression levels of representative molecules classified into two groups: those with ACO/eCOPD-specific upregulation compared with HP (E) and both HP and non-eCOPD (F). (G) Wiki pathway analysis annotated keyword classification and functional enrichment for upregulated molecules, specifically in ACO/eCOPD. Mean ± SEM, n = 5–6 for each group.
Figure 3
Figure 3
Lipidomic analysis of peripheral blood eosinophils from healthy participants (HP) and patients with asthma-COPD overlap (ACO) and eosinophilic COPD (eCOPD) or without eosinophilic COPD (non-eCOPD). (A) Lipidomic analysis of arachidonic acid (AA) and docosahexaenoic Acid (DHA). (B) Lipidomic analysis of 5-lipoxygenase (5-LOX) (leukotrienes (LTs) and 5-hydroxy eicosatetraenoic acid (5-HETE)), 12/15-lipoxygenase (12/15-LOX) (12-HETE and 15-HETE), and cyclooxygenase (COX) (prostaglandins (PGs) and thromboxanes (Txs))-mediated mediators derived from AA. (C) Lipidomic analysis of 5-LOX (7-hydroxy docosahexaenoic acid (7-HDoHE))-and 12/15-LOX (14-HDoHE and 17-HDoHE)-mediated mediators derived from DHA. (D) Heatmap representing the comparative evaluation of lipidomic profiles among the three groups (upper row, non-eCOPD: HP; middle row, ACO/eCOPD: HP; and lower row, ACO/eCOPD:non-eCOPD). Mean ± SEM, n = 5–6 for each group.
Figure 4
Figure 4
Regulatory mechanism of mRNA and protein expressions of the molecules in human eosinophils upregulated in patients with asthma-COPD overlap (ACO) and eosinophilic COPD (eCOPD). (A, B) Comparative analysis of the mRNA expression of the genes (FCER1G, MVD, SQLE, TMEM176B, and GGT5) using quantitative RT-PCR of the cells stimulated with 10 ng/mL of various cytokines (IL-4, IL-5, IL-33, TNF-α , IFN-α, and IFN-γ) for 3 h (A) or 24 h (B). (C) Histogram of protein expression of FCER1G on the cell surface of the cells unstimulated or stimulated with IFN-γ combined with IL-33/TNF-α for 72 h. (D) Mean fluorescence intensity (MFI) of protein expression of FCER1G on the cell surface of human eosinophils unstimulated or stimulated with IFN-γ combined with IL-33/TNF-α for 72 h. Mean ± SEM, n = 3–9 for each group. *P < 0.05, **P < 0.01, ***P < 0.001. Data are representative of at least three independent experiments.
Figure 5
Figure 5
Effects of atorvastatin (ATO), dexamethasone (DEX), and prostaglandin E2 (PGE2) on mRNA and protein expressions of the representative molecules in human eosinophils upregulated in patients with asthma-COPD overlap (ACO) and eosinophilic COPD (eCOPD). (A) The effects of ATO, DEX, and PGE2 on FCER1G mRNA expression in the cells stimulated with IL-33 or TNF-α for 3 h or IFN-γ plus IL-33 or IFN-γ plus TNF-α for 24 h. (B) Mean fluorescence intensity (MFI) of protein expressions of FCER1G on cell surface of human eosinophils stimulated with IFN-γ combined with IL-33/TNF-α pretreated with/without ATO for 72 h. (C) Histogram of protein expression of FCER1G on cell surface of the cells stimulated with IFN-γ plus IL-33 or IFN-γ plus TNF-α pretreated with/without ATO for 72 h. (D) The effects of ATO, DEX, and PGE2 on SQLE mRNA expression in the cells stimulated with IL-5 plus TNF-α for 24 h. (E) The effects of ATO, DEX, and PGE2 on TMEM176B mRNA expression in the cells stimulated with IL-33 for 3 h or IL-5 plus TNF-α for 24 h. Mean ± SEM, n = 4–7 for each group. *P < 0.05, **P < 0.01, ***P < 0.001. Data are representative of at least three independent experiments.

Similar articles

References

    1. McDonald VM, Higgins I, Wood LG, Gibson PG. Multidimensional assessment and tailored interventions for COPD: respiratory utopia or common sense? Thorax. (2013) 68:691–4. doi: 10.1136/thoraxjnl-2012-202646 - DOI - PMC - PubMed
    1. Hartl S, Breyer MK, Burghuber OC, Ofenheimer A, Schrott A, Urban MH, et al. . Blood eosinophil count in the general population: typical values and potential confounders. Eur Respir J. (2020) 55. doi: 10.1183/13993003.01874-2019 - DOI - PubMed
    1. Barnes N, Ishii T, Hizawa N, Midwinter D, James M, Hilton E, et al. . The distribution of blood eosinophil levels in a Japanese COPD clinical trial database and in the rest of the world. Int J Chron Obstruct Pulmon Dis. (2018) 13:433–40. doi: 10.2147/COPD.S144108 - DOI - PMC - PubMed
    1. Yun JH, Lamb A, Chase R, Singh D, Parker MM, Saferali A, et al. . Blood eosinophil count thresholds and exacerbations in patients with chronic obstructive pulmonary disease. J Allergy Clin Immunol. (2018) 141:2037–47.e10. doi: 10.1016/j.jaci.2018.04.010 - DOI - PMC - PubMed
    1. Jogdand P, Siddhuraj P, Mori M, Sanden C, Jönsson J, Walls AF, et al. . Eosinophils, basophils and type 2 immune microenvironments in COPD-affected lung tissue. Eur Respir J. (2020) 55. doi: 10.1183/13993003.00110-2019 - DOI - PMC - PubMed

MeSH terms

Grants and funding

The author(s) declare financial support was received for the research, authorship, and/or publication of this article. This work was supported by JSPS Grant-in-Aid for Scientific Research on Innovative Areas (grant number 15H05897 and 15H05898 to MA), JSPS Grant-in-Aid for Scientific Research (A) (grant number 20H00495 to MA), JST-ERATO (grant number JPMJER2101 to MA), JSPS Grant-in-Aid for Young Scientists (grant number 20K17239 to JM), JSPS Grant-in-Aid for Scientific Research (C) (24K11605 to JM), Asthma Basic Research Supporting Program of the Japan Asthma Society (to JM), RIKEN Special Postdoctoral Researchers Program (to JM), GSK Japan Research Grant 2018 (to JM), and Grant-in-Aid for Research 2019 of the ONO Medical Research Foundation (to JM).