. 2024 Oct 22;9(1):293.
doi: 10.1038/s41392-024-01986-y.

MEK inhibition prevents CAR-T cell exhaustion and differentiation via downregulation of c-Fos and JunB

Affiliations

MEK inhibition prevents CAR-T cell exhaustion and differentiation via downregulation of c-Fos and JunB

Xiujian Wang et al. Signal Transduct Target Ther. .

Abstract

Clinical evidence supports the notion that T cell exhaustion and terminal differentiation pose challenges to the persistence and effectiveness of chimeric antigen receptor-T (CAR-T) cells. MEK1/2 inhibitors (MEKIs), widely used in cancer treatment due to their ability to inhibit aberrant MAPK signaling, have shown potential synergistic effects when combined with immunotherapy. However, the impact and mechanisms of MEKIs on CAR-T cells remain uncertain and controversial. To address this, we conducted a comprehensive investigation to determine whether MEKIs enhance or impair the efficacy of CAR-T cells. Our findings revealed that MEKIs attenuated CAR-T cell exhaustion and terminal differentiation induced by tonic signaling and antigen stimulation, thereby improving CAR-T cell efficacy against hematological and solid tumors. Remarkably, these effects were independent of the specific scFvs and costimulatory domains utilized in CARs. Mechanistically, analysis of bulk and single-cell transcriptional profiles demonstrates that the effect of MEK inhibition was related to diminish anabolic metabolism and downregulation of c-Fos and JunB. Additionally, the overexpression of c-Fos or JunB in CAR-T cells counteracted the effects of MEK inhibition. Furthermore, our Cut-and-Tag assay revealed that MEK inhibition downregulated the JunB-driven gene profiles associated with exhaustion, differentiation, anergy, glycolysis, and apoptosis. In summary, our research unveil the critical role of the MAPK-c-Fos-JunB axis in driving CAR-T cell exhaustion and terminal differentiation. These mechanistic insights significantly broaden the potential application of MEKIs to enhance the effectiveness of CAR-T therapy.


Conflict of interest statement

The authors declare no competing interests.

Figures
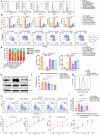
Fig. 1
Fig. 1
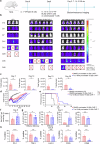
MEK inhibition restrains the exhaustion and differentiation of CAR-T cells elicited by antigen-independent tonic signaling. a, b Flow cytometric analysis of exhaustion (PD-1, TIM-3, and LAG-3) and activation markers (CD25 and CD69) of CAR-T cells on day 15 of ex-vivo culture. One representative donor’s histograms (a) are shown. Bar graphs (b) are pooled from 3 donors. c, d Differentiation state of CAR-T cells on day 15 of ex-vivo culture. One representative donor’s pseudocolor plots are shown (c). CD62L and CD45RO define the differentiation state of CAR-T cells as the following combinations: naive T cells (TN, CD62L + CD45RO-), central memory T cells (TCM, CD62L + CD45RO + ), effector memory T cells (TEM, CD62L-CD45RO + ) and effector T cells (TEFF, CD62L-CD45RO-). Bar graphs (d) are pooled from 3 donors. e WB evaluates pERK versus total ERK of 19.28z CAR-T cells on day 15 of ex-vivo culture. Representative of 3 donors. f The bar graphs show the expansion fold of 19.28z CAR-T cells. Data are pooled from 3 donors. g Representative histogram of CellTrace Violet showing the cell proliferation state of 19.28z CAR-T cells after a six-day treatment with trametinib. N = 2 donors. h, i Quantification of apoptosis of 19.28z CAR T cells on day 15 of ex-vivo culture. One representative donor’s pseudocolor plots (h) are shown. Bar graphs (i) are pooled from 5 donors. j, k Cytotoxicity of CD4 and CD8 19.28z CAR-T cells (j), and CD4 and CD8 GD2.28z CAR-T cells (k) pre-treated with trametinib for 9 days. The assay was conducted in culture media without trametinib. Error bars represent means ± SD of triplicate wells. A representative donor from three donors. Error bars are means ± SEM and statistical test was paired one-way ANOVA with Dunnett’s multiple comparison test except (j, k). For (j, k), an unpaired student’s t-test was used. *P < 0.05, **P < 0.01, ***P < 0.001, ****P < 0.0001, NS not significant, Tra trametinib, Cobi cobimetinib, Bini binimetinib, UTD untransduced T
Fig. 2
Fig. 2
Trametinib pretreatment during ex-vivo manufacturing enhances the in-vivo efficacy of 19.28z CAR-T cells. a 1.5 or 2 or 3 × 106 19.28z CAR-T cells manufactured in the presence of trametinib 15 nM or DMSO for 9 days were infused to NCG mice intravenously (IV) 6 days after engraftment of 1 × 106 Nalm-6-GL leukemia cells in 3 independent experiments. bd Tumor growth was monitored by bioluminescent imaging. One representative experiment is shown, and 1.5 * 106 CAR-T cells were administrated (UTD cells: n = 3; DMSO pre-treated CAR-T cells: n = 6; trametinib 15 nM pre-treated CAR-T cells: n = 6). Each dot in (c) and each curve in (d) represents one mouse. D, day. e Kaplan–Meier analysis of survival of mice. Data are pooled from 3 independent experiments (UTD cells: n = 7; DMSO pre-treated CAR-T cells: n = 13; trametinib 15 nM pre-treated CAR-T cells: n = 14). fh The number (f), subset composition (g), and positive rate of exhaustion and activation markers (h) of CAR-T cells in the bone marrow 8 days after CAR-T infusion. Data in (f) are pooled from 2 independent experiments, with 1.5 * 106 and 2 * 106 CAR-T cells administered in each experiment, respectively. Data in (g, h) are from 1 representative experiment, with 1.5 * 106 CAR-T cells administered in (g) and 2 * 106 CAR-T cells administered in (h). Each dot represents one mouse. N = 5 or 9. Error bars are means ± SEM. Statistical tests were paired two-tailed Wilcoxon test (c) and paired two-tailed student’s t-test (fh). Survival curves were compared using a log-rank Mantel-Cox test. *P < 0.05, **P < 0.01, ***P < 0.001, ****P < 0.0001. D day, Tra trametinib, UTD untransduced T
Fig. 3
Fig. 3
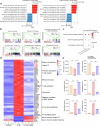
MEK inhibition modifies the gene-expression profile of CAR-T cells during ex-vivo manufacturing. a Normalized enrichment score (NES) of significantly up- or downregulated gene sets in UTD + DMSO versus 19.28z CAR-T + DMSO (left panel) and 19.28z CAR-T + trametinib 15 nM versus 19.28z CAR-T + DMSO (right panel) as determined by GSEA using the MSigDB C7 gene sets. For all pathways, the false discovery rate (FDR) < 0.05. b Representative GSEA enrichment plot. c KEGG pathway enrichment analysis of differentially expressed genes (DEGs) among samples. d Heat map demonstrating the expression profiles of selected DEGs (FDR < 0.05) among the three groups. The AP-1 TFs are denoted in red. e Normalized RNA-seq counts of selected genes. Error bars are means ± SEM. Statistical test was unpaired one-way ANOVA with Dunnett’s multiple comparison test. For all analyses, n = 3 per group. ***P < 0.001, ****P < 0.0001. UTD untransduced T. C 19.28z CAR-T, D DMSO, Tra trametinib,TF transcription factor
Fig. 4
Fig. 4
MEK inhibition limits the exhaustion and differentiation of CAR-T cells triggered by target antigen. a Experimental design for target antigen stimulation. b, c Flow cytometric analysis of exhaustion and activation markers. The histograms (b) of one representative donor are shown. Bar graphs (c) are pooled from 4 to 8 donors. d, e Differentiation state of 19.28z CAR-T cells. Pseudocolor plots (d) of one representative donor are shown. Bar graphs (e) are pooled from 5 donors. (f) WB evaluates pERK versus total ERK. Representative of 3 donors. g, i Quantification of apoptosis of 19.28z CAR T cells. The bar graphs (g) are pooled from 6 donors and the pseudocolor plots (i) of one representative donor are shown. (h) The bar graphs show the expansion fold of 19.28z CAR-T cells. Data are pooled from 3 donors. j, k CD8 and CD4 composition in 19.28z CAR-T cells. Pseudocolor plots (j) of one representative donor are shown. Bar graphs (k) are pooled from 4 donors. l, m Cytotoxicity of 19.28z CAR-T cells cocultured with Nalm-6-GL cells for 18 h in the culture medium free of trametinib or DMSO. Error bars represent means ± SD of triplicate wells. A representative donor from four donors. n Proliferation curve of 19.28z CAR-T cells. Arrows denoted the time points when Nalm-6 cells were added. Data are pooled from 5 donors. o Cytotoxicity of 19.28z CAR-T against Nalm-6-GL cells (left panel) and GD2.28z CAR-T against 143B-GL cells (right panel) in the culture medium with trametinib or DMSO. Error bars represent means ± SD of triplicate wells. (19.28z: n = 4 donors; GD2.28z: n = 3 donors). The data in (bk) were produced using CAR-T cells treated by protocols indicated in the upper panel of Fig. 4a. Error bars are means ± SEM unless indicated otherwise. Statistical tests were paired (c, e, g, h, k) or unpaired (m) one-way ANOVA with Dunnett’s multiple comparison test, and paired (n) or unpaired (o) students’ t test. Tests were two-tailed. *P < 0.05, **P < 0.01, ***P < 0.001, ****P < 0.0001.NS not significant. C 19.28z CAR-T, D DMSO, Tra trametinib, N6 Nalm-6, UTD untransduced T
Fig. 5
Fig. 5
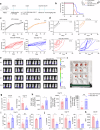
In-vivo administration of trametinib enhances the antitumor activities of CAR-T cells by offsetting CAR-T cells exhaustion and differentiation. a Mice treated with GD2.28z CAR-T cells or UTD cells were dosed with trametinib or vehicle once daily. b Kaplan–Meier analysis of survival of mice. Data are pooled from two independent experiments (UTD + vehicle: n = 3; UTD + trametinib: n = 3; GD2.28z + vehicle: n = 10; GD2.28z + trametinib: n = 10). c, e Tumor growth was monitored by bioluminescent imaging. Each curve in (c) represents one mouse. D day. d Growth curve of tumor size. Each line represents one mouse. The dotted lines indicate the endpoint where tumor volume reached 1.5 cm3, and the asterisks indicate mice died before reaching the endpoint. f Picture of tumors on day 19 after CAR-T infusion. The arrow indicates a tiny tumor, and the asterisk indicates a missing macroscopic tumor in one of the mice in GD2.28z + trametinib group. N = 5 mice per group. One of two independent experiments is shown. g Bar plots of tumor volume and tumor weight of mice from (f). N = 5 mice per group. h Tumor-infiltrating total GD2.28z, CD8 GD2.28z, and CD4 GD2.28z CAR-T cell counts normalized to tumor weight of mice from (g). GD2.28z + vehicle: n = 5. GD2.28z + trametinib: n = 4 for one mouse in GD2.28z CAR-T + trametinib group didn’t have a macroscopic tumor. i The percentage of CD8 and CD4, along with the total percentage of naïve plus central memory plus effector memory in tumor-infiltrating GD2.28z CAR-T cells of mice from (g). j The positive rate of PD-1, TIM-3, and CD25 in tumor-infiltrating GD2.28z CAR-T cells of mice from (g). k The MFI of PDL1 in tumor cells of mice from (g). Error bars are means ± SEM unless indicated otherwise. Statistical tests were unpaired (g, i, j, k) students’ t test, Mann–Whitney test (h), and log-rank Mantel-Cox test (b). All tests were two-tailed. *P < 0.05, **P < 0.01, ***P < 0.001, NS not significant, Tra trametinib, UTD untransduced T, N naive, CM central memory, EM effector memory
Fig. 6
Fig. 6
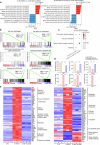
MEK inhibition alters the gene profile of antigen-stimulated CAR-T cells to a naive-/memory-like state. (a) NES of significantly up- or downregulated gene sets in 19.28z + DMSO versus 19.28z + Nalm-6 + DMSO (left panel) and 19.28z + Nalm-6 + trametinib 15 nM versus 19.28z + Nalm-6 + DMSO (right panel), as determined by GSEA using the MSigDB C7 gene, sets. For all pathways, the FDR q < 0.05. b Representative GSEA enrichment plot. c KEGG pathway enrichment analysis of DEGs among samples. d Normalized RNA-seq counts of selected genes. Statistical test was unpaired two-tailed one-way ANOVA with Dunnett’s multiple comparison test. Error bars are means ± SEM. e Heat map showing the expression profiles of selected DEGs (FDR < 0.05) among the three groups. The AP-1 TFs are denoted in red. For all analyses, n = 3 per group. C 19.28z CAR-T, N6 Nalm-6, D DMSO, Tra trametinib., TF transcription factor
Fig. 7
Fig. 7
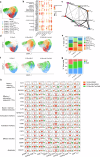
Single-cell transcriptome analysis reveals an increase of memory CAR-T cells while a decrease of effector/exhausted CAR-T cells after MEK inhibition. a The UMAP visualization of 35469 cells from all the samples. 8 clusters are indicated by different colors. b Dot plot illustrating the expression of the marker genes in different clusters. c PAGA analysis shows the potential developmental connectivity among all eight clusters. d, e The UMAP and bar plots show the constitution of the eight clusters in the 3 samples. f, g The UMAP and bar plots show the relative frequency of 19.28z CAR-T cells in each phase of the cell cycle. h The violin plots depict the single-cell expression of the selected genes in each cluster of the three samples. C 19.28z CAR-T, N6 Nalm-6., D DMSO, Tra trametinib. Q, quiescent. Statistical test was a two-tailed Wilcoxon test. *P< 0.05, **P <0.01, ***P < 0.001, ns: not significant
Fig. 8
Fig. 8
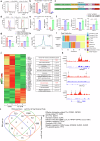
Overexpression of c-Fos and JunB in CAR-T cells partially abrogates the role of MEK inhibition. a, b Expression of c-Fos and JunB in DMSO- and trametinib-treated CAR-T cells. The histograms (a) show data from one representative donor. The expression level of c-Fos and JunB was normalized to DMSO-treated CAR-T cells in (b) (n = 3). c The schematics of 19.28z-c-Fos and 19.28z-JunB CAR expression vector. d, e c-Fos and JunB expression in Ctrl and c-Fos or JunB 19.28z CAR-T cells. The expression level of c-Fos and JunB was normalized to Ctrl CAR-T cells in (e) (n = 3). f, g Flow cytometric analysis of exhaustion markers (f) and differentiation state (g) of CAR-T cells (n = 3). Data are normalized to DMSO-treated group. h Enrichment plot of JunB Cut & Tag signal in DMSO- or trametinib-treated 19.28z CAR-T cells. The x-axis and y-axis show the distance from the center of JunB-bound site and the average RPM across replicates for JunB Cut & Tag, respectively. i The peak distribution on the whole genome of genes gaining JunB binding or losing JunB binding after MEK inhibition. j Left panel: heatmap of differential peaks identified by Cut & Tag between DMSO- and trametinib-treated CAR-T cells (n = 2). Right panel: GO and KEGG enrichment of genes losing JunB binding after MEK inhibition. k Representative Cut & Tag sequencing tracks showing binding of JunB to ZBTB32, NFATC2 (encoding NFAT1), and CTLA4 in DMSO- and trametinib-treated CAR-T cells. Arrows denote significant peaks. l Venn diagram displayed overlap between DEGs and differential peaks comparing Nalm-6 stimulated 19.28z CAR-T cells treated with trametinib versus DMSO. Error bars are means ± SEM. Statistical tests used were Welch’s t test (b, e) and ordinary one-way ANOVA with Dunnett’s multiple comparison test (f, g). **P < 0.01, ***P < 0.001, ****P < 0.0001. Tra trametinib

Similar articles

References

    1. Cheng, Y. & Tian, H. Current development status of MEK inhibitors. Molecules22, 1551 (2017). - PMC - PubMed
    1. Ullah, R., Yin, Q., Snell, A. H. & Wan, L. RAF-MEK-ERK pathway in cancer evolution and treatment. Semin Cancer Biol.85, 123–154 (2022). - PubMed
    1. Majzner, R. G. & Mackall, C. L. Clinical lessons learned from the first leg of the CAR T cell journey. Nat. Med.25, 1341–1355 (2019). - PubMed
    1. Zhu, Y. M. et al. Anti-CD19 chimeric antigen receptor T-cell therapy for adult Philadelphia chromosome-positive acute lymphoblastic leukemia: two case reports. Medicine95, e5676 (2016). - PMC - PubMed
    1. Feucht, J. et al. Calibration of CAR activation potential directs alternative T cell fates and therapeutic potency. Nat. Med.25, 82–88 (2019). - PMC - PubMed

MeSH terms

LinkOut - more resources