. 2024 Dec;26(12):2046-2060.
doi: 10.1038/s41556-024-01527-3. Epub 2024 Oct 21.

Mitochondrial mechanotransduction through MIEF1 coordinates the nuclear response to forces

Affiliations

Mitochondrial mechanotransduction through MIEF1 coordinates the nuclear response to forces

Patrizia Romani et al. Nat Cell Biol. 2024 Dec.

Abstract

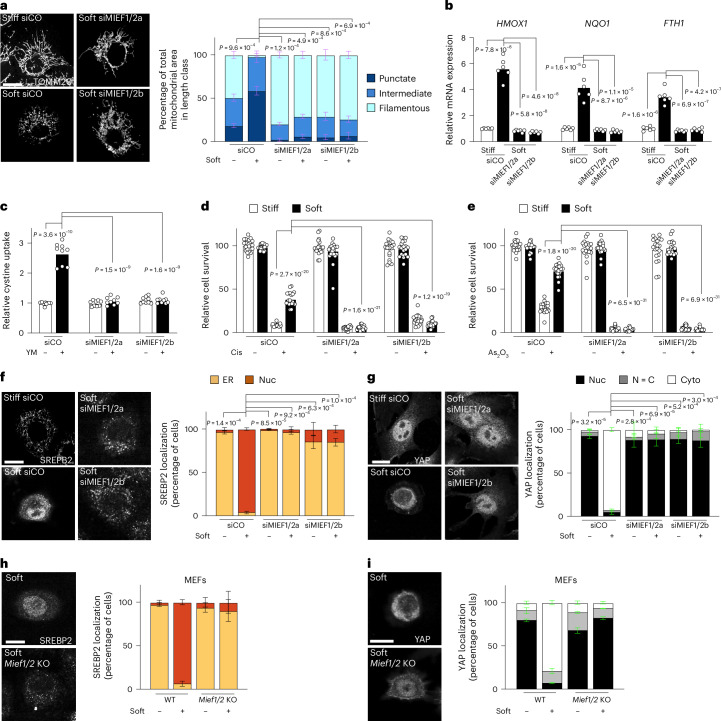
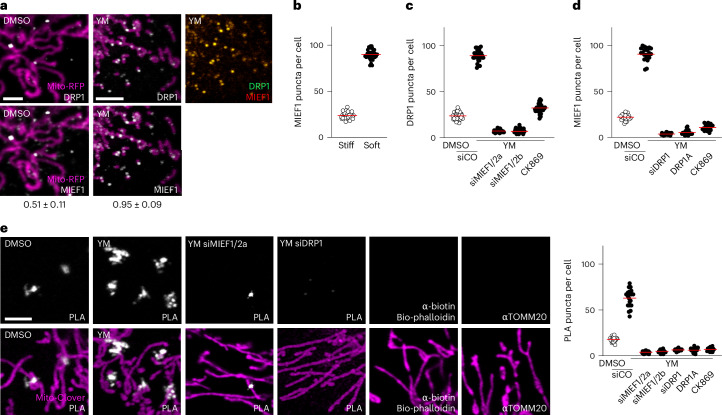
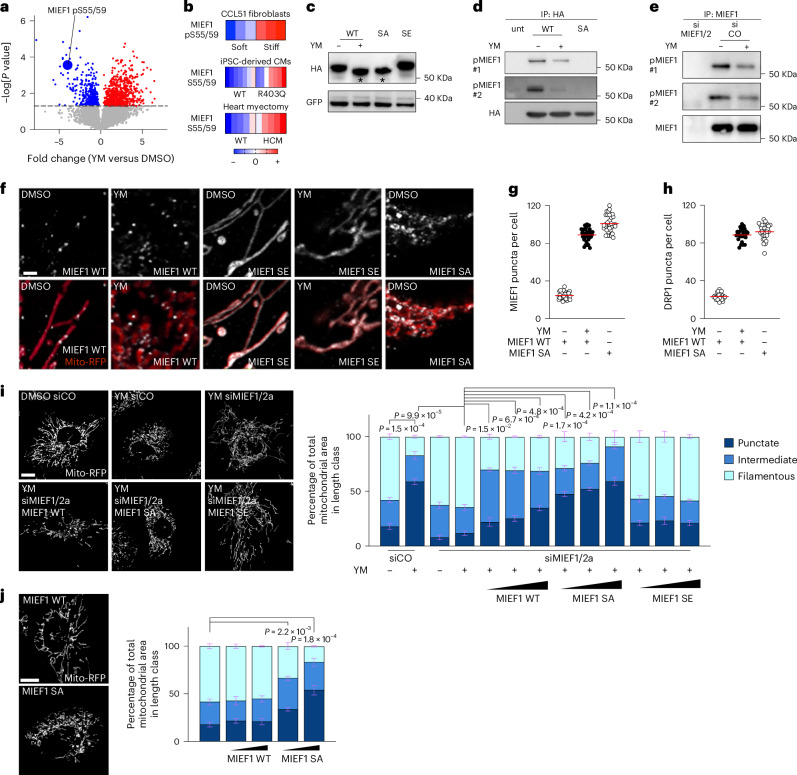
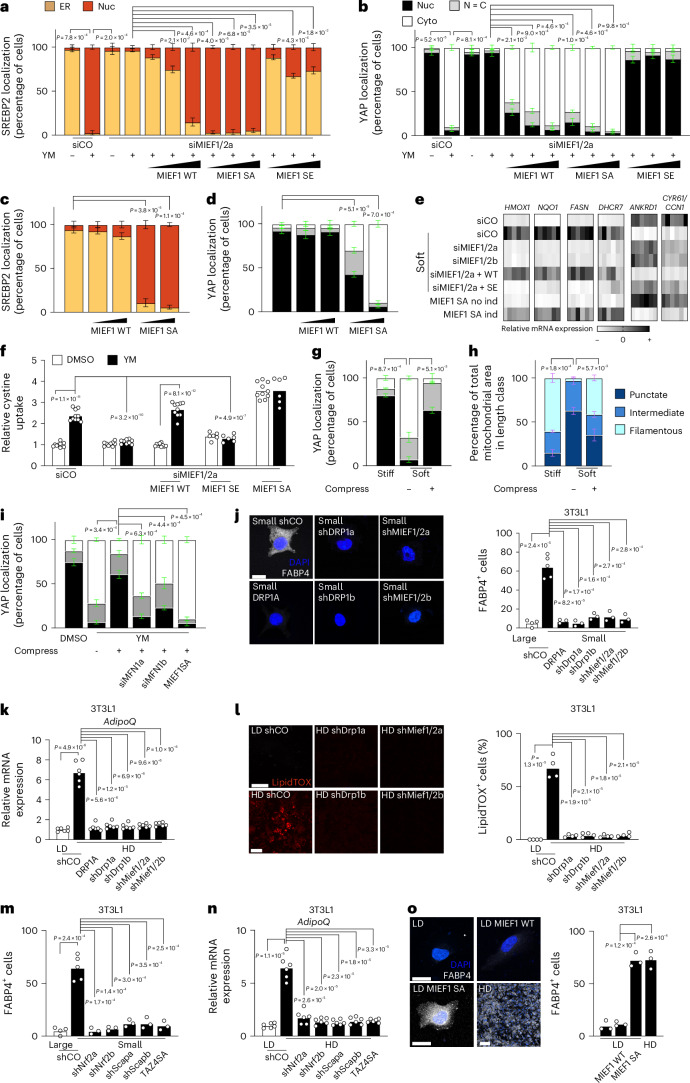
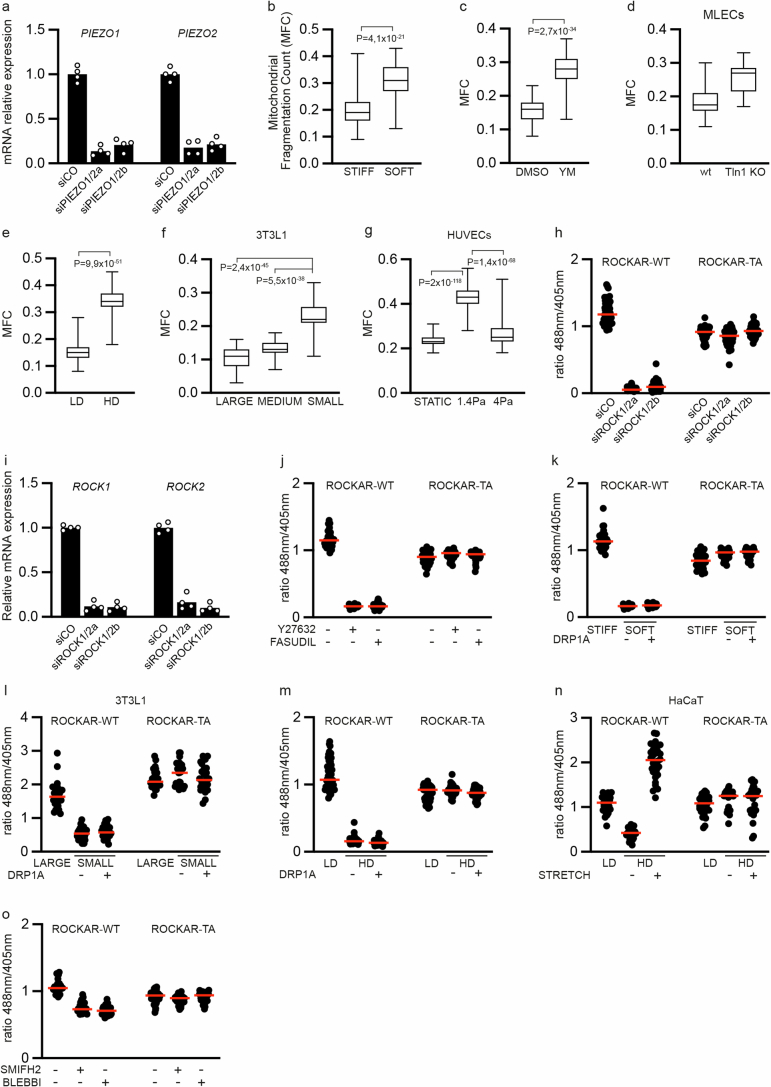
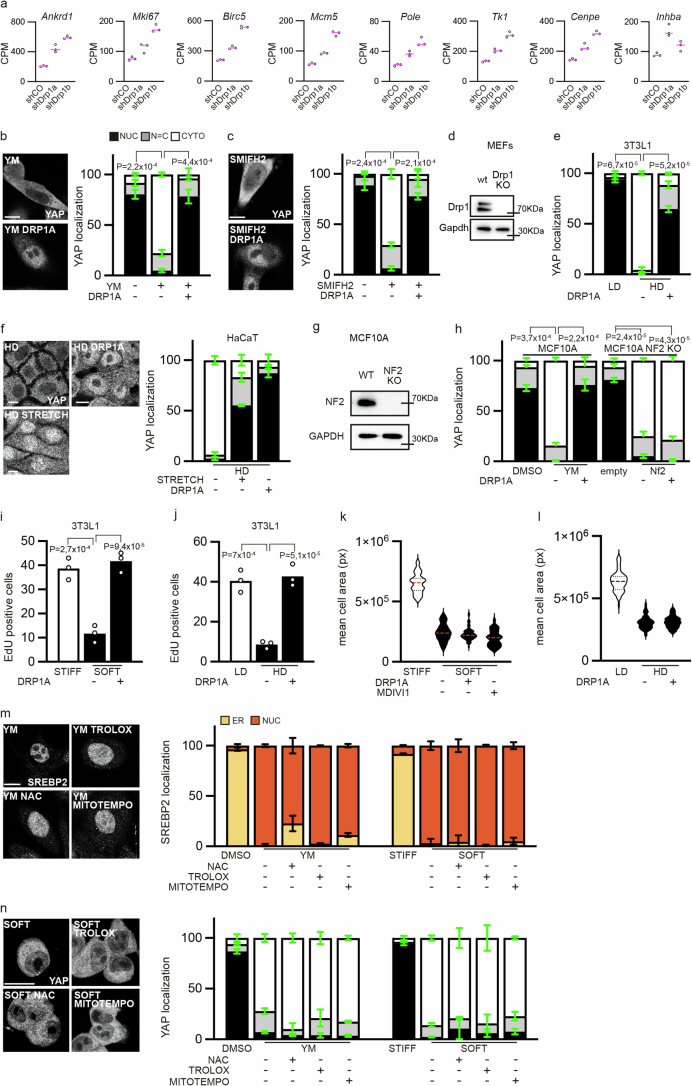
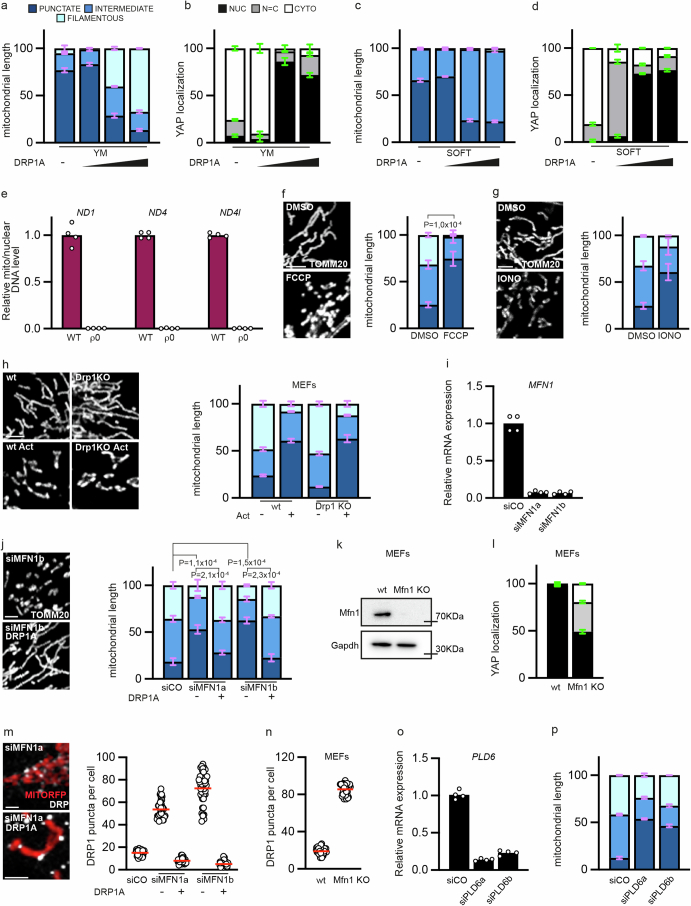
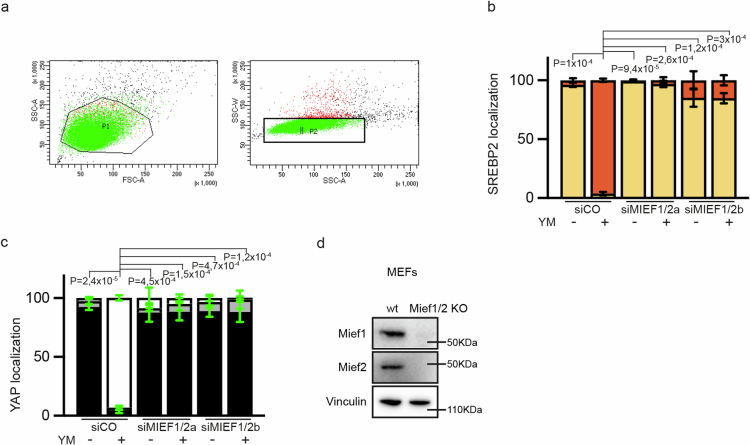
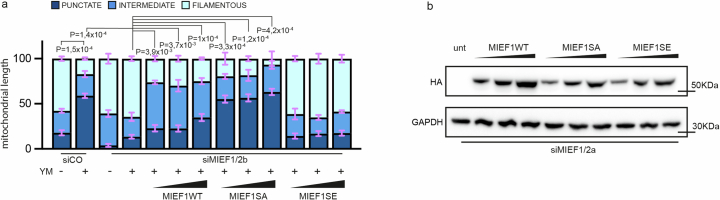
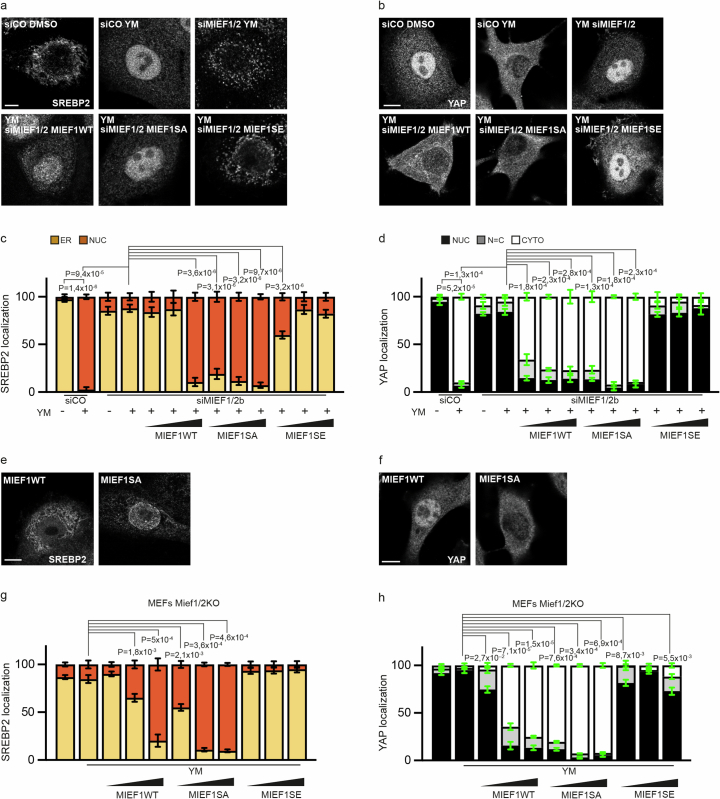
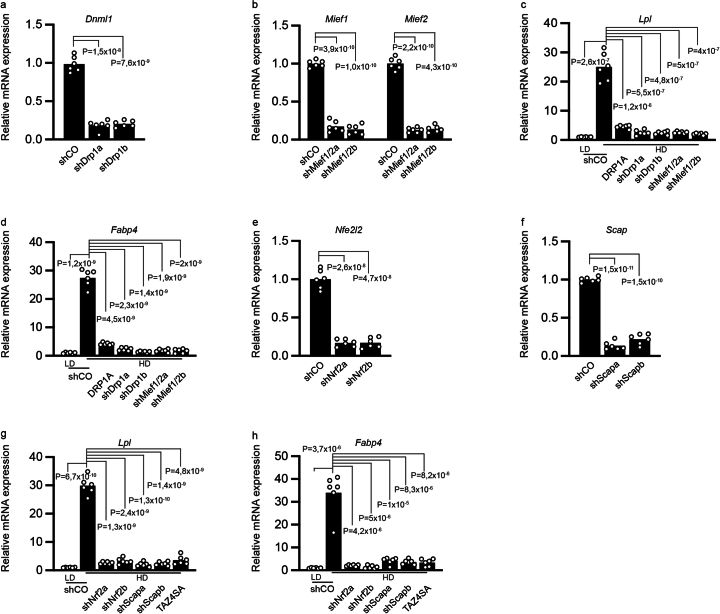
Tissue-scale architecture and mechanical properties instruct cell behaviour under physiological and diseased conditions, but our understanding of the underlying mechanisms remains fragmentary. Here we show that extracellular matrix stiffness, spatial confinements and applied forces, including stretching of mouse skin, regulate mitochondrial dynamics. Actomyosin tension promotes the phosphorylation of mitochondrial elongation factor 1 (MIEF1), limiting the recruitment of dynamin-related protein 1 (DRP1) at mitochondria, as well as peri-mitochondrial F-actin formation and mitochondrial fission. Strikingly, mitochondrial fission is also a general mechanotransduction mechanism. Indeed, we found that DRP1- and MIEF1/2-dependent fission is required and sufficient to regulate three transcription factors of broad relevance-YAP/TAZ, SREBP1/2 and NRF2-to control cell proliferation, lipogenesis, antioxidant metabolism, chemotherapy resistance and adipocyte differentiation in response to mechanical cues. This extends to the mouse liver, where DRP1 regulates hepatocyte proliferation and identity-hallmark YAP-dependent phenotypes. We propose that mitochondria fulfil a unifying signalling function by which the mechanical tissue microenvironment coordinates complementary cell functions.


Conflict of interest statement

Competing interests: The authors declare no competing interests.

Figures

Fig. 1
Fig. 1. Forces induce mitochondrial elongation.
a, Mitochondrial length analysis in MCF10A-RAS cells cultured for 24 h on stiff (E = ~15 kPa) versus soft (E = ~0.5 kPa) fibronectin-coated polyacrylamide hydrogels (n = 71 (soft) and 95 cells (stiff) from four experiments). Scale bars, 10 μm. b,c, Mitochondrial length analysis in D2.0R cells (b) and MEFs (c) cultured as in a (n = 69 (stiff) and 48 cells (soft) in b; n = 57 (stiff) and 76 cells (soft) in c; both from three experiments). d, Mitochondrial length analysis in MCF10A-RAS cells transfected to express dominant-negative RHOA T19N or treated for 3 h with inhibitors of ROCK and MLCK (Y27632 and ML7; YM) or with the SMIFH2 inhibitor of the formin actin-nucleating proteins (n = 25 (GFP), 30 (RHOA T19N), 71 (DMSO), 89 (YM) and 93 cells (SMIFH2); from two experiments for GFP and RHOA T19N and from four experiments for the remainder). Scale bar, 10 μm. e, Mitochondrial length analysis in MEFs treated as in d (n = 86 (DMSO) and 71 cells (YM) from four experiments). Scale bar, 10 μm. f, Mitochondrial length analysis in mouse lung endothelial cells (MLECs) treated for 18 h with 4-OHT to trigger CreERT2-mediated Talin1 inactivation (Tln1 KO) (n = 26 (WT) and 25 cells (Tln1 KO) from two experiments). Scale bar, 10 μm. g, Mitochondrial length analysis in MCF10A-RAS cells transfected with control (siCO) or PIEZO1/2 siRNAs (n = 29 (siCO), 64 (siPIEZO1/2a) and 71 cells (siPIEZO1/2b) from three experiments). h, Mitochondrial length analysis in 3T3L1 cells cultured on large (10,000 μm2), medium (1,024 μm2) or small (300 μm2) micropatterned fibronectin islands for 24 h (n = 61 (large), 51 (medium) and 96 cells (small) from four experiments). Scale bars, 10 μm. i,j, Mitochondrial length analysis in 3T3L1 (i) and MCF10A-RAS cells (j) cultured under sparse (low-density (LD)) or dense (high-density (HD)) conditions for 72 h. Where indicated, cells were locally released from crowding by scratching the monolayer for 8 h (scratch) (n = 89 (LD) and 193 cells (HD) from four experiments in i; n = 69 (LD), 192 (HD without scratching) and 143 cells (HD with scratching) from three experiments in j). Scale bar, 10 μm. k, HUVECs forming mature monolayers were left untreated (static) or conditioned for 18 h with a flow yielding a nominal WSS of 1.4 or 4.0 Pa. Top left, analysis of cell orientation in response to flow (0° is the flow direction). Bottom left, representative TOMM20 immunofluorescence. Right, mitochondrial length analysis (n = 161 (static), 175 (1.4 Pa) and 202 cells (4.0 Pa) from three experiments). Scale bar, 30 μm. l, Mitochondrial length analysis in HaCaT cells cultured under dense conditions on a fibronectin-coated silicon membrane for 72 h then subjected to tonic uniaxial stretching for 3 h (stretch) (n = 128 (no stretch) and 153 cells (stretch) from three experiments). Bidirectional arrow represents the direction of stretching. Scale bar, 20 μm. m, Mitochondrial area analysis (right) from transmission electron microscopy images (left) of basal keratinocytes from normal mouse skin (CO) versus skin subjected to expansion for 6 d (EXP) (n = 88 (CO a), 78 (CO b), 68 (EXP c), 76 (EXP d) and 62 mitochondria (EXP e) in ≥15 cells per mouse). Scale bars, 2 μm (top images) and 500 nm (magnified images). The data are presented as means ± s.d. (al) or means and single points (m), with representative pictures. Statistical significance was determined by two-tailed Student’s t-test. In ae and hl, P values were calculated on punctate mitochondria. Source numerical data are available. Source data
Fig. 2
Fig. 2. DRP1 is required for the mechanoregulation of SREBP1/2 and lipogenesis.
a, MCF10A-RAS cells were treated with ROCK–MLCK inhibitors (YM) for 3 h. DRP1 was inhibited with Drpitor1a (DRP1A), Mitochondrial division inhibitor 1 (MDIVI1) or siRNA transfection. The percentages of cells displaying SREBP2 staining at the endoplasmic reticulum (ER) or in the nucleus (Nuc) were quantified (n = 95 (DMSO), 63 (YM), 87 (YM DRP1A), 88 (YM MDIVI1) and 75 cells (YM siDRP1) from three experiments). Scale bar, 10 μm. b, SREBP2 localization in MCF10A-RAS cells cultured on fibronectin hydrogels for 24 h (n = 80 (stiff), 64 (soft), 73 (soft DRP1A), 68 (soft MDIVI1) and 99 cells (soft siDRP1) from three experiments). Scale bar, 10 μm. c, MCF10A-RAS cells expressing Myc-tagged SCAP were treated as in b and the percentages of cells displaying SCAP immunofluorescence staining at the endoplasmic reticulum or concentrated at the Golgi apparatus were quantified (n = 40 (stiff), 51 (soft), 41 (soft DRP1A) and 43 cells (soft MDIVI1) from three experiments). Scale bar, 5 μm. d, SREBP2 localization in D2.0R cells with inhibition of ROCK–MLCK (YM) or DRP1 (DRP1A or shRNAa/b) (n = 101 (DMSO), 124 (YM), 106 (YM DRP1A), 98 (YM shDrp1a) and 102 cells (YM shDrp1b) from three experiments). Scale bar, 10 μm. e,f, SREBP2 localization in WT and Dnm1l KO (Drp1 KO) MEFs treated with YM (e) or cultured on fibronectin hydrogels for 24 h (f) (n = 103 (DMSO), 105 (YM), 92 (YM DRP1A), 69 (Drp1 KO) and 76 cells (Drp1 KO YM) in e; n = 56 (WT stiff), 71 (WT soft), 54 (KO stiff) and 61 cells (KO soft) in f; both from three experiments). Scale bars, 10 μm. g, SREBP2 localization in 3T3L1 cells cultured on large or small micropatterned islands for 24 h (n = 49 (large), 51 (small) and 63 cells (small DRP1A) from three experiments). Scale bar, 5 μm. h, Quantitative PCR (qPCR) in MCF10A-RAS cells cultured on stiff (E = ~50 kPa) or soft (E = ~0.2 kPa) collagen I-coated hydrogels for 24 h and treated with DRP1 inhibitors. The messenger RNA (mRNA) levels are relative to GAPDH levels and normalized to the stiff controls (n = 6 samples from three experiments). i,j, Quantification of lipid droplets by Oil Red O (ORO) staining (i) and of cholesterol by ultraviolet-fluorescent Filipin (j) in MCF10A-RAS cells treated with YM for 24 h and with DRP1 inhibitors (n = 50 cells in i and n = 53 cells in j; both from three experiments). Scale bars, 10 μm. The data are presented as means ± s.d. (ag) or means and single points (hj). Statistical significance was determined by two-tailed Student’s t-test. In a, b and dg, this was calculated on nuclear SREBP2. Source numerical data are available. Source data
Fig. 3
Fig. 3. DRP1 is required for the mechanoregulation of YAP/TAZ, proliferation and cell fate.
a, MCF10A-RAS cells were cultured on fibronectin hydrogels for 24 h and treated with DRP1 inhibitors. The percentages of cells displaying endogenous YAP immunofluorescence staining prevalently in the cytoplasm (Cyto), evenly distributed between the cytoplasm and nucleus (N = C) or prevalently in the nucleus (Nuc) were quantified (n = 176 (stiff), 135 (soft), 129 (soft DRP1A) and 67 cells (soft MDIVI1) from four experiments). Scale bar, 20 μm. b, qPCR in MCF10A-RAS cells cultured on collagen I-coated hydrogels for 24 h and treated with DRP1 inhibitors. The mRNA levels are relative to GAPDH levels and normalized to the stiff controls (n = 6 from three experiments). c, YAP localization in D2.0R cells stably expressing control (shCO) or Drp1 shRNAs and treated with ROCK–MLCK inhibitors (YM) for 3 h (n = 162 (DMSO shCO), 99 (YM shCO), 142 (shCO YM DRP1A), 162 (YM shDrp1a) and 142 cells (YM shDrp1b) from three experiments). Scale bar, 10 μm. d, YAP localization in WT and Drp1 KO MEFs cultured on fibronectin hydrogels for 24 h (n = 124 (WT stiff), 119 (WT soft), 137 (KO stiff) and 122 cells (KO soft) from three experiments). Scale bar, 10 μm. e, YAP localization in 3T3L1 cells cultured on large or small micropatterned islands and treated with Drpitor1a for 24 h (n = 38 (large), 61 (small) and 55 cells (small DRP1A) from three experiments). Scale bar, 10 μm. f, YAP localization in MCF10A-RAS cells cultured under sparse (LD) and dense (HD) conditions and treated with Drpitor1a. Cells within five cell diameters from the scratch were quantified for comparison (n = 80 (LD), 452 (HD), 231 (HD DRP1A) and 225 cells (HD scratch) from three experiments). Scale bar, 10 μm. g, YAP localization in HUVECs conditioned by flow, with or without Drpitor1a (n = 1,098 (static), 1,032 (1.4 Pa), 1,098 (1.4 Pa DRP1A) and 3,421 cells (4.0 Pa) from two experiments). Scale bar, 30 μm. h, qPCR in HUVECs treated as in g. The mRNA levels are relative to GAPDH levels and normalized to the static controls (n = 6 from three experiments). i, EdU incorporation assay in MCF10A-RAS cells cultured on fibronectin hydrogels and treated with Drpitor1a for 24 h (n = 276 (stiff), 253 (soft) and 156 cells (soft DRP1A) from three experiments). j, EdU incorporation assay in MCF10A-RAS cells cultured as in f for 72 h. Drpitor1a was added for the last 24 h (n = 147 (LD), 1,003 (HD) and 1,109 cells (HD DRP1A) from three experiments). k, EdU incorporation assay in 3T3L1 cells cultured on large or small micropatterned islands and treated with Drpitor1a for 24 h (n = 60 (large), 51 (small) and 54 cells (small DRP1A) from three experiments). l,m, Dominant-negative HA-DRP1 (DRP1 DN) and constitutively active FLAG-TAZ-4SA (TAZ4SA) induce cholangiocellular markers (l) and EdU incorporation (m) in mouse liver (n = 4 mice). Scale bars, 5 μm. The data are presented as means ± s.d. (a and cg) or means and single points (b and hm). Statistical significance was determined by two-tailed Student’s t-test. In a and cf, P values were calculated on nuclear YAP levels. Source numerical data are available. Source data
Fig. 4
Fig. 4. General workings of MIME.
a, Mitochondrial length analysis in MCF10A-RAS cells treated with inhibitors of ROCK–MLCK (YM) for the indicated times (n = 22 (DMSO), 24 (15 min), 24 (30 min), 23 (60 min) and 25 cells (120 min) from two experiments). b, YAP localization in MCF10A-RAS cells with pulse–chase (+, washout) treatments with inhibitors of YM and DRP1 (DRP1A) (n = 66 (DMSO), 54 (YM), 53 (YM washout), 62 (DRP1A) and 87 cells (DRP1A washout) from two experiments). c, Representative immunostainings of deep ρ0 MCF10A-RAS cells largely lacking mitochondria. Scale bar, 10 μm. df, SREBP2 (d), SCAP (e) and YAP (f) localization in deep ρ0 MCF10A-RAS cells (n = 135 (stiff) and 141 cells (soft) in d; n = 81 (stiff) and 95 cells (soft) in e; n = 50 (stiff) and 45 cells (soft) in f; all from three experiments). Scale bars, 10 μm. g, YAP localization in MCF10A-RAS cells treated with FCCP (n = 78 (DMSO) and 80 cells (FCCP) from three experiments). Scale bar, 5 μm. h, YAP localization in MCF10A-RAS cells treated with ionomycin (Iono) (n = 63 (DSMO) and 72 cells (Iono) from two experiments). i,j, SREBP2 (i) and YAP (j) localization in MEFs upon activation of the ActuAtor system (n = 57 (−Act) and 58 cells (+Act) in i; n = 43 (−Act) and 42 cells (+Act) in j; both from two experiments). Scale bars, 10 μm. k,l, SREBP2 (k) and YAP (l) localization in MCF10A-RAS cells with MFN1 knockdown. Where indicated, cells were treated with Drpitor1a (n = 67 (siCO), 70 (siMFN1a), 66 (siMFN1a DRP1A), 65 (siMFN1b) and 71 (siMFN1b DRP1A) in k; n = 44 (siCO), 48 (siMFN1a), 56 (siMFN1a DRP1A), 49 (siMFN1b) and 67 (siMFN1b DRP1A) in l; both from three experiments). Scale bars, 10 μm. m, YAP localization in MCF10A-RAS cells with PLD6 knockdown (n = 52 (siCO), 45 (siPLD6a) and 39 cells (siPLD6b) from two experiments). Scale bar, 10 μm. The data are presented as means ± s.d. Statistical significance was determined by two-tailed Student’s t-test. This was calculated on nuclear SREBP2 (d and k) or nuclear YAP (f, g and l). Source numerical data are available. Source data
Fig. 5
Fig. 5. MIME depends on the MIEF1/2 fission factors.
a, Mitochondrial length analysis in MCF10A-RAS cells depleted of MIEF1 and MIEF2 and cultured on fibronectin hydrogels for 24 h (n = 75 (siCO), 85 (siMIEF1/2a) and 91 cells (siMIEF1/2b) from four experiments). Scale bars, 10 μm. b, qPCR in MCF10A-RAS cells cultured on collagen I-coated hydrogels for 24 h. The mRNA levels are relative to GAPDH levels and normalized to the controls (n = 6 from three experiments). c, Uptake of FITC-labelled cystine quantified by flow cytometry in MCF10A-RAS cells depleted of MIEF1/2 and treated with ROCK–MLCK inhibitors (YM) for 24 h. The data are normalized to the mean intensity of the controls (n = 9 from three experiments). d,e, Survival rates of MCF10A-RAS cells depleted of MIEF1/2, plated on stiff and soft Matrigel and treated with cisplatin (Cis; d) or arsenic oxide (As2O3; e) for 48 h. The mean cell number of the controls was set to 100% (solid black) and all other sample values are relative to this (n = 21 per condition in d; n = 20 per condition in e; both from three experiments). f,g, SREBP2 (f) and YAP localization (g) in MCF10A-RAS cells depleted of MIEF1/2 and cultured on stiff and soft fibronectin-coated hydrogels for 24 h (n = 61 (stiff siCO), 68 (soft siCO), 72 (stiff siMIEF1/2a), 72 (soft siMIEF1/2a), 67 (stiff siMIEF1/2b) and 61 cells (soft siMIEF1/2b) in f; n = 88 (stiff siCO), 102 (soft siCO), 101 (stiff siMIEF1/2a), 103 (soft siMIEF1/2a), 86 (stiff siMIEF1/2b) and 98 cells (soft siMIEF1/2b) in g; both from three experiments). Scale bars, 10 μm. h,i, SREBP2 (h) and YAP localization (i) in WT and Mief1Mief2Mff KO MEFs cultured on fibronectin hydrogels for 24 h (n = 51 (stiff), 43 (soft), 44 (stiff Mief1/2 KO) and 48 cells (soft Mief1/2 KO) in h; n = 87 (stiff), 62 (soft), 76 (stiff Mief1/2 KO) and 71 cells (soft Mief1/2 KO) in i; both from two experiments). Scale bars, 10 μm. The data are presented as means ± s.d. (a and fi) or means and single points (be). Statistical significance was determined by two-tailed Student’s t-test. This was calculated on punctate mitochondria (a), nuclear SREBP2 (f) or nuclear YAP (g). Source numerical data and unprocessed blots are available. Source data
Fig. 6
Fig. 6. MIEF1/2 regulate the formation of peri-mitochondrial F-actin and DRP1 foci.
a, Co-localization analysis of HA-MIEF1 with endogenous DRP1 along mitochondria (Mito-RFP) in MCF10A-RAS cells upon ROCK–MLCK (YM) treatment for 3 h. Pearson’s indices (below) were calculated based on n = 10 cells per condition from one experiment. Scale bars, 2 μm and 5 μm. b, Quantification of MIEF1 puncta in MCF10A-RAS cells cultured on stiff and soft fibronectin-coated hydrogels (n = 36 cells from two experiments). c,d, Quantification of endogenous DRP1 (c) and MIEF1 (d) puncta in MCF10A-RAS cells with MIEF1/2 knockdown or treated with the CK869 Arp2/3 inhibitor (n = 36 cells in c; n = 21 cells in d; both from two experiments). e, Proximity ligation assay (PLA) between the TOMM20 mitochondrial outer membrane protein and F-actin in MCF10A-RAS cells with MIEF1/2 and DRP1 knockdown or treated with the CK869 Arp2/3 inhibitor (n = 20 cells from two experiments). Scale bar, 2 μm. The data are presented as means and single points. Source numerical data are available. Source data
Fig. 7
Fig. 7. Actomyosin tension inhibits fission by promoting MIEF1 phosphorylation.
a, Volcano plot showing differentially phosphorylated peptides in MCF10A-RAS cells treated with ROCK–MLCK inhibitors (YM) for 2 h (n = 5 samples per condition in a single experiment). b, Heat maps showing the levels of phosphorylated S55/59 MIEF1 in fibroblasts cultured on hydrogels of differential stiffness (n = 3 per condition; P < 0.0001), of induced pluripotent stem cell (iPS)-derived cardiomyocytes (CMs) bearing the hyperactive MHY7 R403Q substitution (n = 6 per condition; P = 0.019) and of myectomy samples from patients with hypertrophic cardiomyopathy (HCM) (n = 5 per condition; P = 0.0015). c, Immunoblotting for HA-MIEF1 isoforms (WT, S55/59A (SA) and S55/59E (SE)) expressed in MCF10A-RAS cells. Where indicated, cells were treated with ROCK–MLCK inhibitors (YM). Asterisks denote electrophoretic shifts. GFP was co-transfected. Consistent results were obtained in n = 4 experiments. d, Immunoblotting with two anti-phospho-MIEF1 antisera on HA-MIEF1 variants immunopurified from MCF10A-RAS cell extracts. Where indicated, cells were treated with ROCK–MLCK inhibitors (YM). Consistent results were obtained in n = 3 experiments. unt, untransfected. e, Immunoblotting with two anti-phospho-MIEF1 antisera on endogenous MIEF1 after immunoprecipitation from MCF10A-RAS cell extracts. Consistent results were obtained in n = 3 experiments. f, Representative immunofluorescence staining for HA-MIEF1 variants in MCF10A-RAS cells treated with ROCK–MLCK inhibitors (YM). Scale bar, 2 μm. Consistent results were obtained in n = 3 experiments. g, Quantification of MIEF1 puncta in MCF10A-RAS cells as in f (n = 36 (MIEF1 WT DMSO), 36 (MIEF1 WT YM) and 43 cells (MIEF1 SA) from two experiments). h, Quantification of endogenous DRP1 puncta in MCF10A-RAS cells as in f (n = 30 (MIEF1 WT DMSO), 27 (MIEF1 WT YM) and 31 cells (MIEF1 SA) from two experiments). i, Mitochondrial length analysis in MCF10A-RAS cells depleted of MIEF1/2 (siMIEF1/2a) and transfected to reconstitute different levels of the WT, phosphorylation-mimicking (SE) and phosphorylation-null (SA) MIEF1 variants. Where indicated, cells were treated with ROCK–MLCK inhibitors (YM) (n = 39 (siCO DMSO), 41 (siCO YM), 39 (siMIEF1/2a DMSO), 40 (siMIEF1/2a YM), 43 (siMIEF1/2a MIEF1 WT low level YM), 46 (siMIEF1/2a MIEF1 WT medium level YM), 41 (siMIEF1/2a MIEF1 WT high level YM), 37 (siMIEF1/2a MIEF1 SA low level YM), 43 (siMIEF1/2a MIEF1 SA medium level YM), 38 (siMIEF1/2a MIEF1 SA high level YM), 21 (siMIEF1/2a MIEF1 SE low level YM), 23 (siMIEF1/2a MIEF1 SE medium level YM) and 25 cells (siMIEF1/2a MIEF1 SE high level YM) from three experiments). Scale bars, 10 μm. j, Mitochondrial length analysis in MCF10A-RAS cells with overexpression of WT and SA MIEF1 variants on stiff glass (n = 43 (untransfected), 34 (WT low level), 36 (WT high level), 35 (SA low level) and 42 cells (SA high level) from three experiments). Scale bars, 5 μm. The data are presented as means and single points (g and h) or means ± s.d (i and j). Statistical significance was determined by two-tailed Student’s t-test. In i and j, this was calculated on punctate mitochondria. Source numerical data and unprocessed blots are available (see source data and Supplementary Table 1). IP, immunoprecipitate. Source data
Fig. 8
Fig. 8. MIEF1 phosphorylation mediates MIME.
a, SREBP2 localization in MCF10A-RAS cells depleted of MIEF1/2 and transfected to reconstitute the WT, SE and SA MIEF1 variants. Where indicated, cells were treated with ROCK–MLCK inhibitors (YM) (n = 62 (siCO DMSO), 71 (siCO YM), 51 (siMIEF1/2a DMSO), 56 (siMIEF1/2a YM), 58 (siMIEF1/2a MIEF1 WT low level YM), 59 (siMIEF1/2a MIEF1 WT medium level YM), 60 (siMIEF1/2a MIEF1 WT high level YM), 58 (siMIEF1/2a MIEF1 SA low level YM), 66 (siMIEF1/2a MIEF1 SA medium level YM), 68 (siMIEF1/2a MIEF1 SA high level YM), 69 (siMIEF1/2a MIEF1 SE low level YM), 63 (siMIEF1/2a MIEF1 SE medium level YM) and 70 cells (siMIEF1/2a MIEF1 SE high level YM) from three experiments). b, YAP localization in MCF10A-RAS cells reconstituted as in a (n = 91 (siCO DMSO), 102 (siCO YM), 87 (siMIEF1/2a DMSO), 99 (siMIEF1/2a YM), 104 (siMIEF1/2a MIEF1 WT low level YM), 89 (siMIEF1/2a MIEF1 WT medium level YM), 91 (siMIEF1/2a MIEF1 WT high level YM), 88 (siMIEF1/2a MIEF1 SA low level YM), 98 (siMIEF1/2a MIEF1 SA medium level YM), 101 (siMIEF1/2a MIEF1 SA high level YM), 81 (siMIEF1/2a MIEF1 SE low level YM), 73 (siMIEF1/2a MIEF1 SE medium level YM) and 75 cells (siMIEF1/2a MIEF1 SE high level YM) from three experiments). c, SREBP2 localization in MCF10A-RAS cells with overexpression of WT and SA MIEF1 variants on stiff glass (n = 66 (untrasfected), 59 (WT low level), 58 (WT high level), 61 (SA low level) and 69 cells (SA high level) from three experiments). d, YAP localization in MCF10A-RAS cells as in c (n = 104 (untrasfected), 63 (WT low level), 64 (WT high level), 65 (SA low level) and 67 cells (SA high level) from three experiments). e, qPCR in MCF10A-RAS cells stably expressing MIEF1 variants, transfected with MIEF1/2 siRNA and cultured on collagen I-coated hydrogels for 24 h. The heat maps indicate the mRNA levels of NRF2 targets (HMOX1 and NQO1), SREBP1/2 targets (DHCR7 and FASN) and YAP–TAZ targets (CYR61 and ANKRD1) in single samples relative to GAPDH levels and normalized to the mean control (n = 6 from three experiments). ind, doxycycline induction. f, Uptake of FITC-labelled cystine in MCF10A-RAS cells (n = 10 (siCO DMSO), 10 (siCO YM), 10 (siMIEF1/2a DMSO), 10 (siMIEF1/2a YM), 10 (siMIEF1/2a MIEF1 WT DMSO), 10 (siMIEF1/2a MIEF1 WT YM), 10 (siMIEF1/2a MIEF1 SA DMSO), 6 (siMIEF1/2a MIEF1 SA YM), 6 (siMIEF1/2a MIEF1 SE DMSO) and 6 replicates (siMIEF1/2a MIEF1 SE YM) from three experiments). g,h, YAP localization (g) and mitochondrial length analysis (h) in MCF10A-RAS cells cultured for 24 h on soft hydrogels and then subjected to 6 μm vertical confinement (compress) for 3 h (n = 70 (stiff), 84 (soft) and 78 (soft compress) in g; n = 52 (stiff), 68 (soft) and 71 (soft compress) in h; both from three experiments). i, YAP localization in MCF10A-RAS cells pre-treated for 1 h with inhibitors of ROCK–MLCK (YM) and then subjected to 6 μm vertical confinement (compress) with inhibitors for 2 h (n = 36 (DMSO), 41 (YM), 40 (YM compress), 39 (siMFN1a YM compress), 40 (siMFN1b YM compress) and 27 (MIEF1 SA YM compress) in i; n = 53 (DMSO), 70 (YM), 65 (YM compress), 56 (siMFN1a YM compress), 47 (siMFN1b YM compress) and 49 (MIEF1 SA YM compress) in j; both from two experiments). j, Adipogenic differentiation (FABP4 immunostaining) of 3T3L1 cells on micropatterned islands, treated with the Drpitor1a DRP1 inhibitor or expressing the indicated shRNAs (n = 69 (large), 79 (small), 61 (small DRP1A), 59 (small shDrp1a), 68 (small shDrp1b), 59 (small shMief1/2a) and 66 cells (small shMief1/2b) from three different experiments). Scale bars, 10 μm. k,l, Adipogenic differentiation of 3T3L1 cells at high density (HD), treated with the Drpitor1a DRP1 inhibitor or expressing the indicated shRNAs and scored by AdipoQ expression levels (k) or LipidTOX staining (l). The mRNA levels in k are relative to Gapdh levels and normalized to the low-density controls (n = 6 from three experiments). Scale bars in l, 10 μm. m, Adipogenic differentiation of 3T3L1 cells on micropatterned islands expressing the indicated shRNAs (Nrf2 and Scap) or the constitutively active TAZ4SA (n = 69 (large), 79 (small), 56 (small shNrf2a), 49 (small shNrf2b), 63 (small shScapa), 67 (small shScapb) and 57 cells (small TAZ4SA) from three different experiments). n, Adipogenic differentiation of 3T3L1 cells at high density (HD) expressing the indicated shRNAs or the constitutively active TAZ4SA. AdipoQ mRNA levels are relative to Gapdh levels and normalized to the low-density controls (n = 6 from three experiments). o, Adipogenic differentiation of 3T3L1 cells transfected with the WT and SA MIEF1 variants and cultured under low-density conditions without spatial confinement (n = 59 (LD), 67 (LD MIEF1 WT), 69 (LD MIEF1 SA) and 498 (HD) from three experiments). Scale bars, 5 μm. The data are presented as means ± s.d. (ad and gi) or means and single points (f and jo). Statistical significance was determined by two-tailed Student’s t-test. This was calculated on nuclear YAP (b, d, g and i) or punctate mitochondria (h). P values for e and all source numerical data are available as source data. Source data
Extended Data Fig. 1
Extended Data Fig. 1. Forces induce mitochondrial elongation.
a, qPCR in MCF10A-RAS cells transfected with PIEZO1-2 siRNA mixes. The mRNA levels are relative to the GAPDH levels, and normalized to control siRNAs (siCO) (n = 4 samples from two experiments). b-g, Quantification of mitochondrial morphology by mitochondrial fragmentation count (MFC) analysis in MCF10A-RAS cells cultured on hydrogels (b) or treated with YM (c), in MLECs with inducible Talin1 KO (d), in MCF10A-RAS cells cultured in sparse or dense conditions (e), in 3T3L1 cells cultured on micropatterns (f) and in HUVECs subjected to flows (g). The same set of pictures quantified in Fig. 1 were analyzed. h, MCF10A-RAS cells expressing a single-fluorophore excitation-ratiometric ROCK kinase Activity Reporter (ROCKAR-WT) or a version of the same reporter bearing a threonine to alanine mutation of the phosphorylation site (ROCKAR-TA) were transfected with ROCK1/2 siRNA. A lower ratio between the fluorescence emitted in response to excitation at 488 and the fluorescence emitted in response to excitation at 405 nm (Excitation ratio) indicates decreased phosphorylation of the reporter. (n = 59 (siCO), n = 59 (siROCK1/2a), n = 59 (siROCK1/2b) from two experiments). i, qPCR in MCF10A-RAS cells transfected with siRNA mixes targeting ROCK1 and ROCK2. The mRNA levels are relative to the GAPDH levels, and normalized to control siRNAs (siCO) (n = 4 from two experiments). j, MCF10A-RAS cells expressing the ROCKAR sensor were treated with ROCK inhibitors for 3 h (n = 30 (DMSO), n = 30 (Y27632) and n = 30 (FASUDIL) from two experiments). k, Excitation ratio of the ROCKAR sensors in MCF10A-RAS cells cultured on soft and stiff hydrogels for 24 h and treated with Drp1 inhibitor (DRP1A) (n = 30 (STIFF), n = 30 (SOFT), n = 30 (SOFT DRP1A) from two experiments). l, Excitation ratio of the ROCKAR sensors in 3T3L1 cells cultured in small and large micropatterned islands for 24 h (n = 25 (LARGE), n = 25 (SMALL), n = 25 (SMALL DRP1A) from two experiments). m, Excitation ratio of the ROCKAR sensors in MCF10A-RAS cells cultured in sparse and dense conditions for 48 h (n = 50 (LD), n = 50 (HD), n = 50 (HD DRP1A) from two experiments). n, Excitation ratio of the ROCKAR sensors in HaCaT cells cultured in sparse conditions, in dense conditions, and dense then subjected to tonic uniaxial stretching for 3 h (n = 30 (LD), n = 30 (HD), n = 30 (HD STRETCH) from two experiments). o, Excitation ratio of the ROCKAR sensors in MCF10A-RAS cells treated with SMIFH2 or with the non-muscle myosin type II inhibitor for 24 h (n = 30 (DMSO), n = 30 (SMIFH2), n = 30 (BLEBBI) from two experiments). Data are presented as mean values and single points (a,h-o) or box plots with median (centre), quartiles (25% and 75%) and extreme values (whiskers) (b-g). In b,c,e-g, p-values were calculated based on two-tailed Student’s t-tests. Source numerical data are available in the source data. Source data
Extended Data Fig. 2
Extended Data Fig. 2. DRP1 is required for the mechano-regulation of SREBP1-2.
a, Expression levels (CPM, counts per million) of selected SREBP1-2 target genes from RNA sequencing of D2.0R cells, selected among the genes downregulated on a soft ECM upon DRP1 shRNA (n = 3 in a single experiment). b, SREBP2 localization in MCF10A-RAS cells deprived of serum and of exogenous lipids. DRP1 was inhibited with Drpitor1a (DRP1A) (n = 72 cells (SERUM) n = 120 (NO SERUM) and n = 131 (NO SERUM DRP1A) from three experiments). c, Excitation ratio of the ROCKAR sensor in MCF10A-RAS cells cultured as in (b) (n = 47 (FULL SERUM), n = 47 (NO SERUM), n = 47 (REFEED) from two experiments). d,e, SREBP2 localization in MCF10A-RAS cells treated with the U18666 NPC1 lysosomal cholesterol transporter inhibitor (d), or depleted of COPI (e) (d, n = 91 (ethanol), n = 103 (U18666A), n = 99 (U18666A DRP1A); e, n = 81 (siCO), n = 76 (siCO YM), n = 89 (siCO YM DRP1A), n = 98 (siCOPIa), n = 72 (siCOPIa DRP1A), n = 63 (siCOPIb), n = 81 (siCOPIb DRP1A) from three experiments). Scale bar 10 μm. Data are presented as mean values and single points (a,c) or mean ± s.d. In b,d,e, p-values were calculated based on two-tailed Student’s t-tests on nuclear SREBP2. Source numerical data are available in the source data and Supplementary Table 1. Source data
Extended Data Fig. 3
Extended Data Fig. 3. DRP1 is required for the mechano-regulation of YAP-TAZ.
a, Expression levels (CPM, counts per million) of selected proliferation and YAP-TAZ target genes from RNA sequencing of D2.0R cells, selected among the genes upregulated on a soft ECM upon DRP1 shRNA (n = 3 in a single experiment). b, YAP localization in MCF10A-RAS cells treated with ROCK-MLCK inhibitors (YM) and Drpitor1a for 3 h (n = 91 cells (DMSO), n = 105 (YM) and n = 123 (YM DRP1A) from three experiments). Scale bar 10 μm. c, YAP localization in MCF10A-RAS cells treated with the SMIFH2 inhibitor of formin actin-nucleating proteins and with Drpitor1a for 3 h (n = 71 cells (DMSO), n = 78 (SMIFH2) and n = 81 (SMIFH2 DRP1A) from three experiments). Scale bar 10 μm. d, Immunoblotting of extracts from wt and Dnm1l KO MEFs (Drp1 KO). Consistent results were obtained in n = 3 experiments. e, YAP localization in 3T3L1 cells cultured in sparse (LD) and dense (HD) conditions, treated with Drpitor1a. (n = 60 (LD), n = 610 (HD) and n = 625 (HD DRP1A) from three experiments). f, YAP localization in HaCaT cells cultured at high density and either subjected to uniaxial stretching or treated with Drpitor1a for 3 h (n = 543 cells (HD), n = 621 (HD STRETCH) and n = 352 (HD DRP1A) from two experiments). Scale bar 20 μm. g, Immunoblotting of extracts from wt and NF2 KO MCF10A. Consistent results were obtained in n = 3 experiments. h, YAP localization in MCF10A cells (WT) treated with ROCK-MLCK inhibitors and in NF2-knockout MCF10A cells (NF2 KO) transiently transfected to reconstitute the expression of Nf2. Where indicated, cells were treated with Drpitor1a (n = 120 cells (wt DMSO), n = 114 (wt YM), n = 121 (wt YM DRP1A), n = 83 (NF2 KO), n = 51 (NF2 KO Nf2) and n = 72 (NF2 KO Nf2 DRP1A) from three experiments). i, EdU incorporation assay in 3T3L1 cells cultured on soft hydrogels and treated with Drpitor1a for 24 h (n = 134 cells (STIFF), n = 95 (SOFT) and n = 103 (SOFT DRP1A) from three experiments). j, EdU incorporation assay in 3T3L1 cells cultured at high density and treated with Drpitor1a for 24 h (n = 81 cells (LD), n = 343 (HD) and n = 391 (HD DRP1A) from three experiments). k,l, Cell area was measured in MCF10A-RAS cells cultured on a soft ECM for 24 h (k) or at high density for 48 h (l) and treated with Drpitor1a (k, n = 60 (STIFF), n = 60 (SOFT), n = 60 (SOFT DRP1A), n = 60 (SOFT MDIVI) from two experiments; l, n = 60 (LD), n = 60 (HD), n = 60 (HD DRP1A) from two experiments). m,n, SREBP2 (m) and YAP localization (n) in MCF10A-RAS cells treated with inhibitors of ROCK-MLCK (YM) or cultured on a soft ECM. Where indicated, cells were also treated with antioxidant compounds (NAC, TROLOX or MITOTEMPO) for 3 h (m, n = 93 cells (DMSO), n = 82 (YM), n = 56 (YM TROLOX), n = 65 (YM NAC), n = 87 (YM MITO), n = 56 (STIFF), n = 42 (SOFT),n = 62 (SOFT NAC), n = 53 (SOFT TROLOX), n = 41 (SOFT MITO); n, n = 78 (DMSO), n = 65 (YM), n = 41 (YM NAC), n = 67 (YM TROLOX), n = 73 (YM MITO), n = 55 (STIFF), n = 42 (SOFT), n = 39 (SOFT NAC), n = 43 (SOFT TROLOX), n = 39 (SOFT MITO) from two experiments). Scale bar 10 μm. Data are presented as mean values and single points (a,i,j), mean ± s.d. (b,c,e,f,h,m,n) or violin plots with median and quartiles (k,l). p-values were calculated based on two-tailed Student’s t-tests. In b,c,e,h, p-values were calculated on nuclear YAP levels. Source numerical data and unprocessed blots are available in the source data and Supplementary Table 1. Source data
Extended Data Fig. 4
Extended Data Fig. 4. General workings of mitochondrial mechanotransduction.
a-d, Mitochondrial length analysis (a and c) and YAP localization (b and d) in MCF10A-RAS cells treated with inhibitors of ROCK-MLCK (YM; a and b) or cultured on soft hydrogels (c and d) and treated with the Drpitor1a inhibitor (DRP1A). (a n = 26 cells (YM), n = 21 (YM DRP1A 0.2microM), n = 22 (YM DRP1A 2microM) and n = 23 (YM DRP1A 10microM); b n = 63 cells (YM), n = 81 (YM DRP1A 0.2microM), n = 73 (YM DRP1A 2microM) and n = 53 (YM DRP1A 10microM); c n = 20 (SOFT), n = 20 (SOFT DRP1A 0.2microM), n = 20 (SOFT DRP1A 2microM) and n = 20 (SOFT DRP1A 10microM); d n = 56 cells (SOFT), n = 57 (SOFT DRP1A 0.2microM), n = 56 (SOFT DRP1A 2microM) and n = 56 (SOFT DRP1A 10microM) from two experiments). e, PCR for mitochondrial mtDNA loci in “deep” rho-zero (ρ0) MCF10A-RAS cells. The expression levels were normalized to nuclear Actin DNA (n = 4 from two experiments). f, Mitochondrial length analysis in MCF10A-RAS cells treated with the FCCP uncoupler of oxidative phosphorylation (n = 78 (DMSO) and n = 80 (FCCP) from three experiments). Scale bar 2 μm. g, Mitochondrial length analysis in MCF10A-RAS cells treated with Ionomycin (i n = 25 (DMSO) and n = 25 (IONO) from two experiments). Scale bar 2 μm. h, Mitochondrial length analysis in wt and Drp1 KO MEFs expressing the ActuAtor system. Cells were left untreated or treated for 2 h with Rapamycin to activate the ActuAtor system (+Act) and induce fission (n = 26 cells (wt), n = 27 (wt Act), n = 26 (KO) and n = 26 (KO Act) from two experiments). Scale bar 2 μm. i, qPCR of MCF10A-RAS cells with MFN1 knockdown. The mRNA levels are relative to the GAPDH levels, and normalized to the stiff controls (n = 4 from two experiments). j, Mitochondrial length analysis in MCF10A-RAS cells with MFN1 knockdown. Where indicated, cells were treated with Drpitor1a (n = 41 cells (siCO), n = 56 (siMFN1a), n = 51 (siMFN1a DRP1A), n = 48 (siMFN1b), n = 49 (siMFN1b DRP1A) from three experiments). Scale bar, 2 μm. k, Immunoblotting of wt and Mfn1 KO MEFs. Consistent results were obtained in n = 2 experiments. l, YAP localization in Mfn1 KO MEFs (n = 55 cells (wt) and n = 65 (KO) from two experiments). m, Quantification of DRP1 mitochondrial puncta in MCF10A-RAS cells depleted of MFN1 and treated with Drpitor1a (n = 42 cells from two experiments). Scale bar 2 μm. n, Quantification of DRP1 mitochondrial puncta in Mfn1 KO MEFs (n = 43 from two experiments). o, qPCR of MCF10A-RAS cells with PLD6 knockdown. The mRNA levels are relative to the GAPDH levels, and normalized to the stiff controls (n = 4 from two experiments). p, Mitochondrial length analysis in MCF10A-RAS cells with PLD6 knockdown (n = 66 cells (siCO), n = 76 (siPLD6a) and n = 65 (siPLD6b) from two experiments). Data are presented as mean values ± s.d. (a-d,f-h,j,l,p) or mean and single points (e,i,m-o). p-values were calculated based on two-tailed Student’s t-tests. In f,j, this was calculated on punctate mitochondria. Source numerical data and unprocessed blots are available in the source data. Source data
Extended Data Fig. 5
Extended Data Fig. 5. Mitochondrial mechanotransduction depends on the MIEF1-2 fission factors.
a, Representative gating strategy used to quantify FITC-Cystine uptake. Fluorescence was measured in the P2 gate. b,c, SREBP2 (b) and YAP localization (c) in MCF10A-RAS cells with MIEF1-2 knockdown treated with inhibitors of ROCK-MLCK (YM) for 6 h (b n = 67 (siCO DMSO), n = 81 (siCO YM), n = 89 (siMIEF1/2a DMSO), n = 84 (siMIEF1/2a YM), n = 84 (siMIEF1/2b DMSO) and n = 65 (siMIEF1/2b YM) from three experiments; c n = 131 (siCO DMSO), n = 141 (siCO YM), n = 112 (siMIEF1/2a DMSO), n = 119 (siMIEF1/2a YM), n = 123 (siMIEF1/2b DMSO) and n = 127 (siMIEF1/2b YM) from four experiments). d, Immunoblotting of wt and Mief1-Mief2-Mff KO MEFs. Consistent results were obtained in n = 2 experiments. Data are presented as mean values ± s.d. (b,c). p-values were calculated based on two-tailed Student’s t-tests. In b, this was calculated on nuclear SREBP2. In c, on nuclear YAP. Source numerical data and unprocessed blots are available in the source data. Source data
Extended Data Fig. 6
Extended Data Fig. 6. Actomyosin tension inhibits fission by promoting MIEF1 phosphorylation.
a, Mitochondrial length analysis in MCF10A-RAS cells reconstituted as in Fig. 7i, but with an independent set of MIEF1-2 siRNAs (siMIEF1/2b) (siCO DMSO and siCO YM as in Fig. 7i, n = 49 (siMIEF1/2b DMSO), n = 44 (siMIEF1/2b YM), n = 45 (siMIEF1/2b WT low level YM), n = 39 (WT medium level), n = 43 (WT high level), n = 41 (SA low level), n = 39 (SA medium level), n = 44 (SA high level), n = 51 (SE low level), n = 39 (SE medium level) and n = 42 (SE high level) from three experiments). b, Immunoblotting of HA-MIEF1 isoforms reconstituted in MCF10A-RAS cells as in Fig. 7i. Consistent results were obtained in n = 2 experiments. Data are presented as mean values ± s.d. In a, p-values were calculated on punctate mitochondria based on two-tailed Student’s t-tests. Source numerical data and unprocessed blots are available in the source data. Source data
Extended Data Fig. 7
Extended Data Fig. 7. MIEF1 phosphorylation mediates mitochondrial mechanotransduction.
a, Representative pictures of SREBP2 localization in MCF10A-RAS cells. Scale bar 10 μm. Refers to Fig. 8a. b, Representative pictures of YAP localization in MCF10A-RAS cells. Scale bar 10 μm. Refers to Fig. 8b. c, SREBP2 localization in MCF10A-RAS cells reconstituted as in Fig. 8a, but with an independent set of MIEF1-2 siRNAs (siMIEF1/2b) (siCO DMSO and siCO YM as in Fig. 8a, n = 57 (siMIEF1/2b DMSO), n = 65 (siMIEF1/2b YM), n = 56 (siMIEF1/2b WT low level YM), n = 61 (WT medium level), n = 58 (WT high level), n = 54 (SA low level), n = 66 (SA medium level), n = 60 (SA high level), n = 62 (SE low level), n = 64 (SE medium level) and n = 58 (SE high level) from three experiments). d, YAP localization in MCF10A-RAS cells reconstituted as in Fig. 8b, but with an independent set of MIEF1-2 siRNAs (siMIEF1/2b) (siCO DMSO and siCO YM as in Fig. 8b, n = 77 (siMIEF1/2b DMSO), n = 79 (siMIEF1/2b YM), n = 81 (siMIEF1/2b WT low level YM), n = 69 (WT medium level), n = 72 (WT high level), n = 73 (SA low level), n = 78 (SA medium level), n = 81 (SA high level), n = 84 (SE low level), n = 89 (SE medium level) and n = 88 (SE high level) from three experiments). e, Representative pictures of SREBP2 localization in MCF10A-RAS cells. Scale bar 10 μm. Refers to Fig. 8c. f, Representative pictures of YAP localization in MCF10A-RAS cells. Scale bar 10 μm. Refers to Fig. 8d. g, SREBP2 localization in Mief1-Mief2-Mff knockout MEFs transiently transfected to reconstitute different levels of the wild-type (WT), phosphorylation-mimicking (SE) and phosphorylation-null (SA) MIEF1 variants. Where indicated, cells were treated with ROCK-MLCK inhibitors (YM) (n = 71 cells (DMSO), n = 65 (YM), n = 67 (WT low level), n = 67 (WT medium level), n = 67 (WT high level), n = 63 (SA low level), n = 68 (SA medium level), n = 69 (SA high level), n = 68 (SE low level), n = 71 (SE medium level), n = 65 (SE high level) from three experiments). h, YAP localization in Mief1-Mief2-Mff knockout MEFs transiently transfected to reconstitute different levels of the wild-type (WT), phosphorylation-mimicking (SE) and phosphorylation-null (SA) MIEF1 variants. Where indicated, cells were treated with ROCK-MLCK inhibitors (YM) (n = 92 cells (DMSO), n = 89 (YM), n = 99 (WT low level), n = 97 (WT medium level), n = 102 (WT high level), n = 121 (SA low level), n = 99 (SA medium level), n = 105 (SA high level), n = 97 (SE low level), n = 92 (SE medium level), n = 104 (SE high level) from three experiments). Data are presented as mean values ± s.d. p-values were calculated based on two-tailed Student’s t-tests. In e,g, this was calculated on nuclear SREBP2. In f,h,this was calculated on nuclear YAP. Source numerical data are available in the source data. Source data
Extended Data Fig. 8
Extended Data Fig. 8. Nuclear compression regulates mitochondrial mechanotransduction.
a, MCF10A-RAS were cultured for 24 h on soft hydrogels and then subjected to 6 μm vertical confinement (COMPRESS) for 3 h (n = 16 cells from one representative experiment; compression was evident upon visual inspection in all experiments). b, Representative pictures of YAP localization in MCF10A-RAS cells subjected to 6 μm vertical confinement. Scale bar 10 μm. Refers to Fig. 8g. c, Immunostainings for NESPRIN2 confirming defective assembly of the LINC complexes in Sun1-Sun2 KO MEFs. Scale bar 10 μm. d, YAP localization in Sun1-Sun2 KO MEFs (n = 195 (wt) and n = 179 (Sun1/2 KO) from three experiments). Scale bar 10 μm. e, YAP localization in MEFs transfected with increasing doses of dominant-negative GFP-NESPRIN1-KASH or GFP-NESPRIN2-KASH (n = 42 (EMPTY), n = 34 (NES1-KASH low level), n = 35 (NES1-KASH high level), n = 40 (NES2-KASH low level), n = 29 (NES2-KASH high level) from two experiments). Scale bar 10 μm. f, YAP localization in MCF10A-RAS cells transfected as in j (n = 56 (EMPTY), n = 64 (NES1-KASH low level), n = 45 (NES1-KASH high level), n = 43 (NES2-KASH low level), n = 55 (NES2-KASH high level) from two experiments). Scale bar 10 μm. g, Representative pictures of mitochondrial length in MCF10A-RAS cells subjected to 6 μm vertical confinement. Scale bar 10μm. Refers to Fig. 8h. h, Representative pictures of YAP localization in MCF10A-RAS cells subjected to 6 μm vertical confinement. Scale bar 10 μm. Refers to Fig. 8i. i, Mitochondrial length analysis in MCF10A-RAS cells pre-treated for 1 h with inhibitors of ROCK-MLCK (YM) and then subjected to 6 μm vertical confinement (COMPRESS) for 2 h with inhibitors. (n = 53 (DMSO), n = 70 (YM), n = 65 (YM COMPRESS), n = 56 (siMFN1a YM COMPRESS), n = 47 (siMFN1b YM COMPRESS) and n = 49 (MIEF1SA YM COMPRESS) from two experiments). j,k, YAP localization (j) and mitochondrial length analysis (k) and in MEFs cells cultured on soft hydrogel for 24 h and then subjected to 6 μm vertical confinement (COMPRESS) for 2 h. (j n = 43 (STIFF), n = 41 (SOFT), n = 39 (SOFT COMPRESS) and n = 25 (SOFT MIEF1SA COMPRESS); k n = 29 (STIFF), n = 31 (SOFT), n = 43 (SOFT COMPRESS), n = 33 (SOFT MIEF1SA COMPRESS) from two experiments). Data are presented as mean values ± s.d. (d-f, i-k) or mean and single points (a). p-values were calculated based on two-tailed Student’s t-tests. In d this was calculated on nuclear YAP. Source numerical data are available in the source data. Source data
Extended Data Fig. 9
Extended Data Fig. 9. MIME mediates mechano-chemical adipogenic differentiation.
a,b, qPCR of 3T3L1 cells stably expressing Drp1 (a) or Mief1-2 shRNAs (b). The mRNA levels are relative to the Gapdh levels, and normalized to shRNA controls (n = 6 from three experiments). c,d, Adipogenic differentiation of 3T3L1 cells at high density (HD), treated with the Drpitor1a DRP1 inhibitor or expressing the indicated shRNAs or cDNAs, as scored by Lpl (c) or Fabp4 (d) expression levels. The mRNA levels are relative to the Gapdh levels, and normalized to the low density controls (n = 6 from three experiments). These are the same samples shown in Fig. 8k. e,f, qPCR of 3T3L1 cells stably expressing Nrf2 (e) or Scap shRNAs (f). The mRNA levels are relative to the Gapdh levels, and normalized to shRNA controls (n = 6 from three experiments). g,h, Adipogenic differentiation of 3T3L1 cells at high density (HD), treated with the Drpitor1a DRP1 inhibitor or expressing the indicated shRNAs or cDNAs, as scored by Lpl (g) or Fabp4 (h) expression levels. The mRNA levels are relative to the Gapdh levels, and normalized to the low density controls (n = 6 from three experiments). These are the same samples shown in Fig. 8n. Data are presented as mean values and single points. p-values were calculated based on two-tailed Student’s t-tests. Source numerical data are available in the source data. Source data

Similar articles

References

    1. Iskratsch, T., Wolfenson, H. & Sheetz, M. P. Appreciating force and shape—the rise of mechanotransduction in cell biology. Nat. Rev. Mol. Cell Biol.15, 825–833 (2014). - PMC - PubMed
    1. Janmey, P. A., Fletcher, D. A. & Reinhart-King, C. A. Stiffness sensing by cells. Physiol. Rev.100, 695–724 (2020). - PMC - PubMed
    1. Discher, D. E. et al. Matrix mechanosensing: from scaling concepts in 'omics data to mechanisms in the nucleus, regeneration, and cancer. Annu. Rev. Biophys.46, 295–315 (2017). - PMC - PubMed
    1. Mohammadi, H. & Sahai, E. Mechanisms and impact of altered tumour mechanics. Nat. Cell Biol.20, 766–774 (2018). - PubMed
    1. Humphrey, J. D. & Schwartz, M. A. Vascular mechanobiology: homeostasis, adaptation, and disease. Annu. Rev. Biomed. Eng.23, 1–27 (2021). - PMC - PubMed

MeSH terms

Grants and funding

LinkOut - more resources