. 2024 Nov 19;98(11):e0125824.
doi: 10.1128/jvi.01258-24. Epub 2024 Oct 21.

Lytic promoter activity during herpes simplex virus latency is dependent on genome location

Affiliations

Lytic promoter activity during herpes simplex virus latency is dependent on genome location

Navneet Singh et al. J Virol. .

Abstract

Herpes simplex virus 1 (HSV-1) is a significant pathogen that establishes lifelong latent infections with intermittent episodes of resumed disease. In mouse models of HSV infection, sporadic low-level lytic gene expression has been detected during latency in the absence of reactivation events that lead to production of new viruses. This viral activity during latency has been reported using a sensitive Cre-marking model for several lytic gene promoters placed in one location in the HSV-1 genome. Here, we extend these findings in the same model by examining first, the activity of an ectopic lytic gene promoter in several places in the genome and second, whether any promoters might be active in their natural context. We found that Cre expression was detected during latency from ectopic and native promoters, but only in locations near the ends of the unique long genome segment. This location is significant because it is in close proximity to the region from which latency-associated transcripts (LATs) are derived. These results show that native HSV-1 lytic gene promoters can produce protein products during latency, but that this activity is only detectable when they are located close to the LAT locus.IMPORTANCEHSV is a significant human pathogen and the best studied model of mammalian virus latency. Traditionally, the active (lytic) and inactive (latent) phases of infection were considered to be distinct, but the notion of latency being entirely quiescent is evolving due to the detection of some lytic gene expression during latency. Here, we add to this literature by finding that the activity can be found for native lytic gene promoters as well as for constructs placed ectopically in the HSV genome. However, this activity was only detectable when these promoters were located close by a region known to be transcriptionally active during latency. These data have implications for our understanding of HSV gene regulation during latency and the extent to which transcriptionally active regions are insulated from adjacent parts of the viral genome.

Keywords: gene expression; herpes simplex virus; latency.


Conflict of interest statement

The authors declare no conflict of interest.

Figures
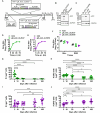
Fig 1
Fig 1
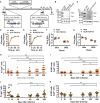
Activity of the ectopic gB promoter from two independent locations. (A) Schematic showing the HSV-1 genome (middle; to scale) with unique long (UL) and short (US) regions bracketed by repeats (TRL/TRS; IRL/IRS), ‘a’ repeats, and position of LATs. The UL26/UL27 and UL55/UL56 regions have been expanded to show the gB_eGFP/Cre expression cassette inserted to generate HSV-1 gB_eGC_UL26/27 (top) and gB_eGC_UL55/56 (bottom), respectively. (B, C) Vero cells were either left uninfected or infected with HSV-1 gB_eGC_UL26/27, gB_eGC_UL55/56, KOS, pC_eGC at 10 PFU/cell, and Cre and GAPDH proteins detected by Western blotting as shown. The size of protein fragments from the marker is shown on left. (D, E) Replication of recombinants assessed in comparison with parent in Vero cells. Data are shown as mean ± SEM from three replicates (error bars are obscured by data points). (F) Mice were infected on the flank with recombinants, and parent viruses and viral loads were measured in skin and DRG after 5 days. Each symbol represents one mouse, and the dotted line signifies the limit of detection (2 PFU/sample). Statistical significance was determined using two-way ANOVA with Tukey’s post-test comparison (unmarked, not significant). (G-J) Groups of ROSA26R mice were infected with HSV-1 gB_eGC_UL26/27 (G, H) or gB_eGC_UL55/56 (I, J), and their DRG collected and stained for beta-galactose (β-gal) expression. Data are pooled from two independent experiments for each virus. The number of β-gal+ cells per mouse (G, I) and the number of DRG with at least one β-gal+ cell (H, J) are shown. Differences in means were compared using one-way ANOVA with Bonferroni’s posttest to calculate pairwise comparisons (*, P < 0.05; **, P < 0.01; ***, P < 0.001; unmarked, not significant).
Fig 2
Fig 2
Evaluation of native gB promoter activity. (A) Depiction of modifications made to introduce T2A-Cre in the HSV-1 genome (to scale) to make UL27-T2A-Cre. (B) Vero cells were either left uninfected or infected with HSV-1 UL27-T2A-Cre, pC_eGC, and KOS at 10 PFU/cell, and Cre and GAPDH proteins were detected by Western blotting. (C, D) Replication of recombinant was assessed in comparison with that of the parent in vitro (C) and in vivo (D). Symbols and markers are same as in the previous figure. Statistical significance was determined using two-way ANOVA with Tukey’s posttest comparison (**, P < 0.01; unmarked, not significant). (E) Groups of ROSA26R mice were infected with HSV-1 UL27-T2A-Cre, their DRG collected, and stained for β-gal expression. The number of β-gal+ cells per mouse is shown, and the data are pooled from two independent experiments. Differences in means were compared using one-way ANOVA with Bonferroni’s posttest to calculate pairwise comparisons (unmarked, not significant).
Fig 3
Fig 3
T2A does not affect neuronal marking in the ROSA26R/Cre mouse model. (A) Schematic showing modifications made in the HSV-1 genome to generate gB_eGC and gB_eGTC_UL3/4. (B) Vero cells were either left uninfected or infected with HSV-1 gB_eGC, gB_eGTC_UL3/4, and KOS at 10 PFUs/cell, and Cre and GAPDH proteins were detected by Western blotting. Controls are the same as in Fig. 1B. (C, D) Replication of recombinant was assessed in comparison with that of the parent (same as in Fig. 1D) in vitro (C) and in vivo (D). Symbols and markers are same as in the previous figure. Statistical significance was determined using two-way ANOVA with Tukey’s posttest comparison (unmarked, not significant). (E, F) Groups of ROSA26R mice were infected with HSV-1 gB_eGC or gB_eGTC_UL3/4 at the same time, their DRGs collected, and stained for β-gal expression. The number of β-gal+ cells per mouse (E) and the number of DRG with at least one β-gal+ cell (F) are shown. Data are pooled from two independent experiments. Differences in means were compared using two-way ANOVA with Sidak’s posttest to calculate pairwise comparisons (**, P < 0.01; ****, P < 0.0001; ns, not significant; red stars signify differences of a particular note).
Fig 4
Fig 4
Promoter activity in latency is a feature of genomic location. (A) Schematic representation of the HSV-1 genome showing modifications made to generate UL3-T2A-Cre and UL56-T2A-Cre. (B, C) Detection of Cre and GAPDH by Western blotting; B and C share controls with Fig. 2B and Fig. 1C, respectively. (D-G) Replication of recombinants was assessed in comparison with parent KOS in vitro (D, E) and in vivo (F, G); E, F, and G share KOS controls with Fig. 1B, Fig. 3D and Fig. 1F, respectively. Symbols and markers are same as in previous figures. Statistical significance was determined using two-way ANOVA with Tukey’s posttest comparison (unmarked, not significant). (H-K) Groups of ROSA26R mice were infected with HSV-1 UL3-T2A-Cre (H, I) or UL56-T2A-Cre (J, K), their DRGs collected, and stained for assessing β-gal expression. The number of β-gal+ cells per mouse (H, J) and the number of DRG with at least one β-gal+ cell (I, K) are shown. Data are pooled from three independent experiments for each virus. Differences in means were compared using one-way ANOVA with Tukey’s posttest to calculate pairwise comparisons (*, P < 0.05; **, P < 0.01; ***, P < 0.001; ****, P < 0.0001).
Fig 5
Fig 5
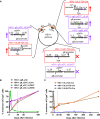
Summary of experiments where promoter activity was assessed in latency. (A) Schematic depicting the episomal form of the HSV-1 genome. The terminal and internal repeats and the LAT locus are marked (to scale). The recombinants used to study ectopic (purple box) and native (red box) promoters are shown. An upward arrow next to the box indicates that the promoter was active in latency, whereas a cross indicates no activity in latency. (B, C) The average of β-gal + numbers in DRGs of mice per time point is shown as the percentage of the maximum value (at the peak time point) from the viruses used to study ectopically placed gB promoter in (B) and native promoters in (C).

Similar articles

References

    1. Looker KJ, Magaret AS, May MT, Turner KME, Vickerman P, Gottlieb SL, Newman LM. 2015. Global and regional estimates of prevalent and incident herpes simplex virus type 1 infections in 2012. PLoS One 10:e0140765. doi:10.1371/journal.pone.0140765 - DOI - PMC - PubMed
    1. Barklie Clements J, Watson RJ, Wilkie NM. 1977. Temporal regulation of herpes simplex virus type 1 transcription: location of transcripts on the viral genome. Cell 12:275–285. doi:10.1016/0092-8674(77)90205-7 - DOI - PubMed
    1. Honess RW, Roizman B. 1974. Regulation of herpesvirus macromolecular synthesis. I. Cascade regulation of the synthesis of three groups of viral proteins. J Virol 14:8–19. doi:10.1128/JVI.14.1.8-19.1974 - DOI - PMC - PubMed
    1. Conley AJ, Knipe DM, Jones PC, Roizman B. 1981. Molecular genetics of herpes simplex virus. VII. Characterization of a temperature-sensitive mutant produced by in vitro mutagenesis and defective in DNA synthesis and accumulation of gamma polypeptides. J Virol 37:191–206. doi:10.1128/JVI.37.1.191-206.1981 - DOI - PMC - PubMed
    1. Holland LE, Anderson KP, Shipman C Jr, Wagner EK. 1980. Viral DNA synthesis is required for the efficient expression of specific herpes simplex virus type 1 mRNA species. Virology 101:10–24. doi:10.1016/0042-6822(80)90479-1 - DOI - PubMed

LinkOut - more resources