. 2024 Oct 5:49:107-118.
doi: 10.1016/j.jot.2024.08.012. eCollection 2024 Nov.

The senolytic agent ABT263 ameliorates osteoporosis caused by active vitamin D insufficiency through selective clearance of senescent skeletal cells

Affiliations

The senolytic agent ABT263 ameliorates osteoporosis caused by active vitamin D insufficiency through selective clearance of senescent skeletal cells

Cuicui Yang et al. J Orthop Translat. .

Abstract

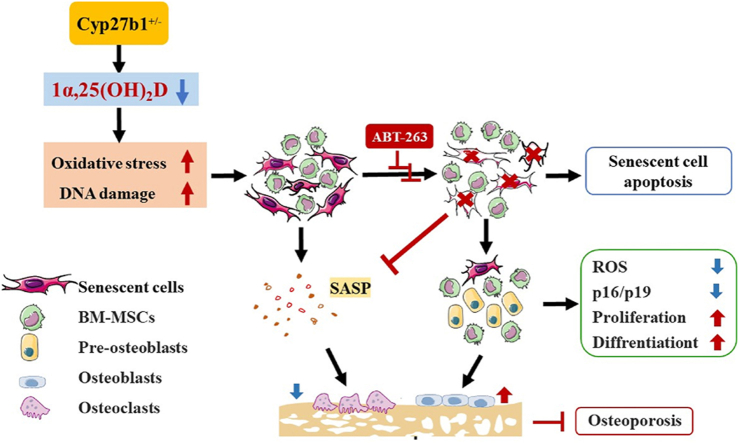
Background/objective: Active vitamin D insufficiency accelerates the development of osteoporosis, with senescent bone cells and the senescence-associated secretory phenotype (SASP) playing crucial roles. This study aimed to investigate whether the senolytic agent ABT263 could correct osteoporosis caused by active vitamin D insufficiency by selectively clearing senescent cells.

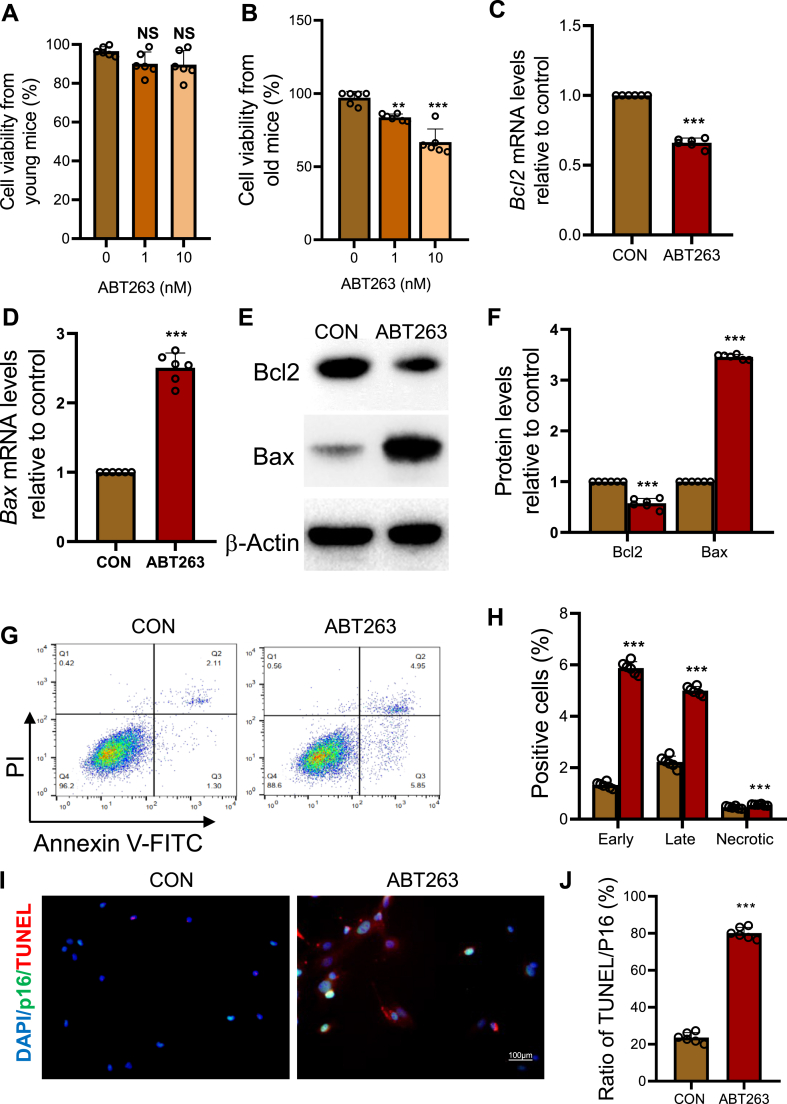
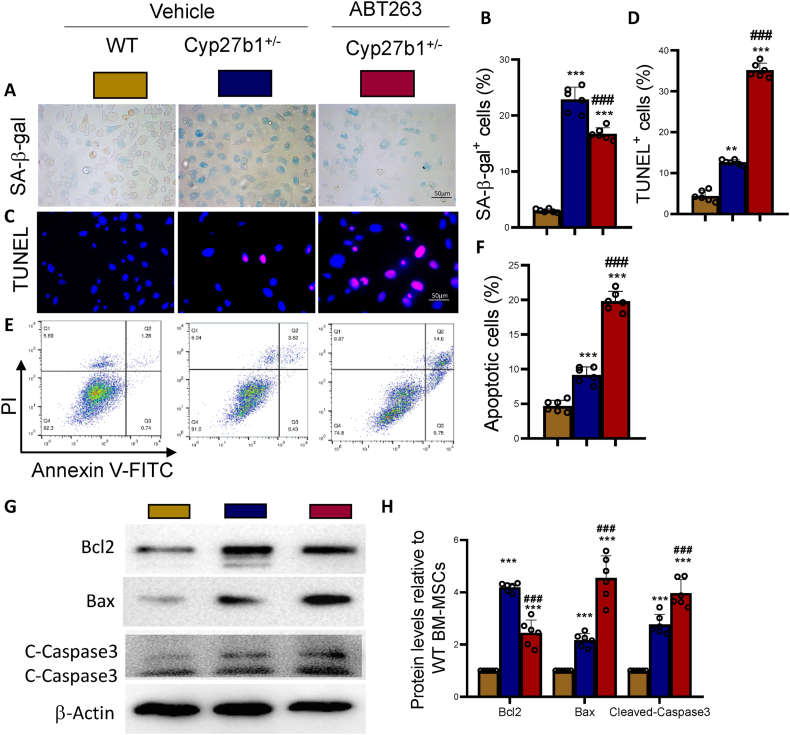
Methods: Bone marrow mesenchymal stem cells (BM-MSCs) from young and aged mice were treated with ABT263 in vitro, and 1,25(OH)2D-insufficient (Cyp27b1+/-) mice were administered ABT263 in vivo. Cellular, molecular, imaging, and histopathological analyses were performed to compare treated cells and mice with control groups.

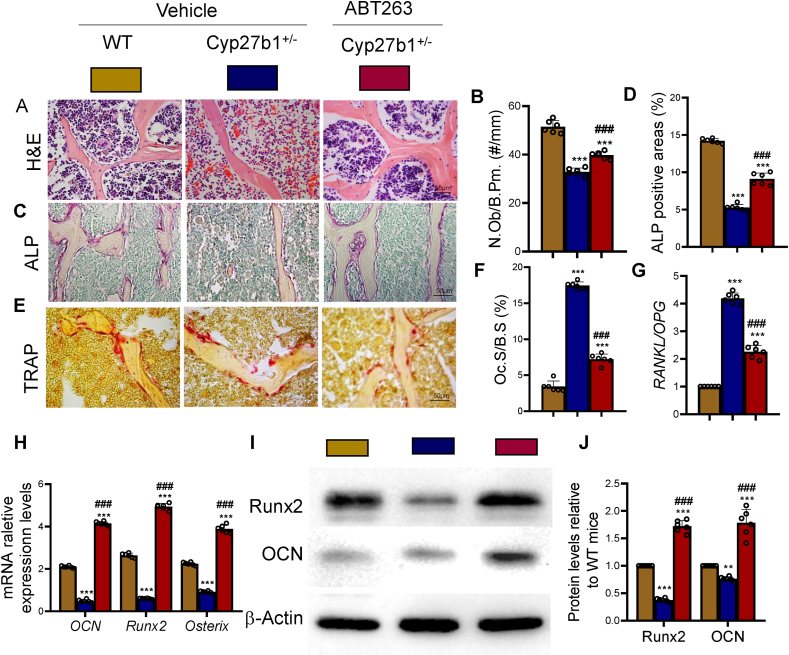
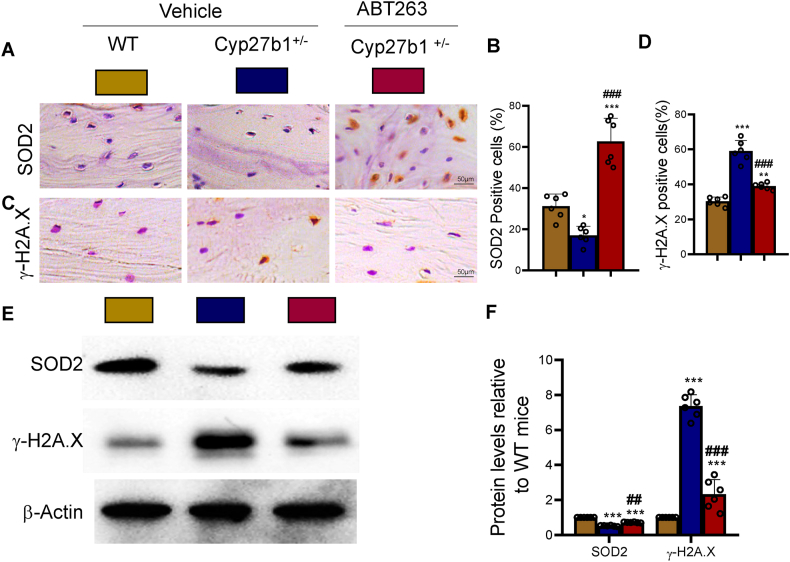
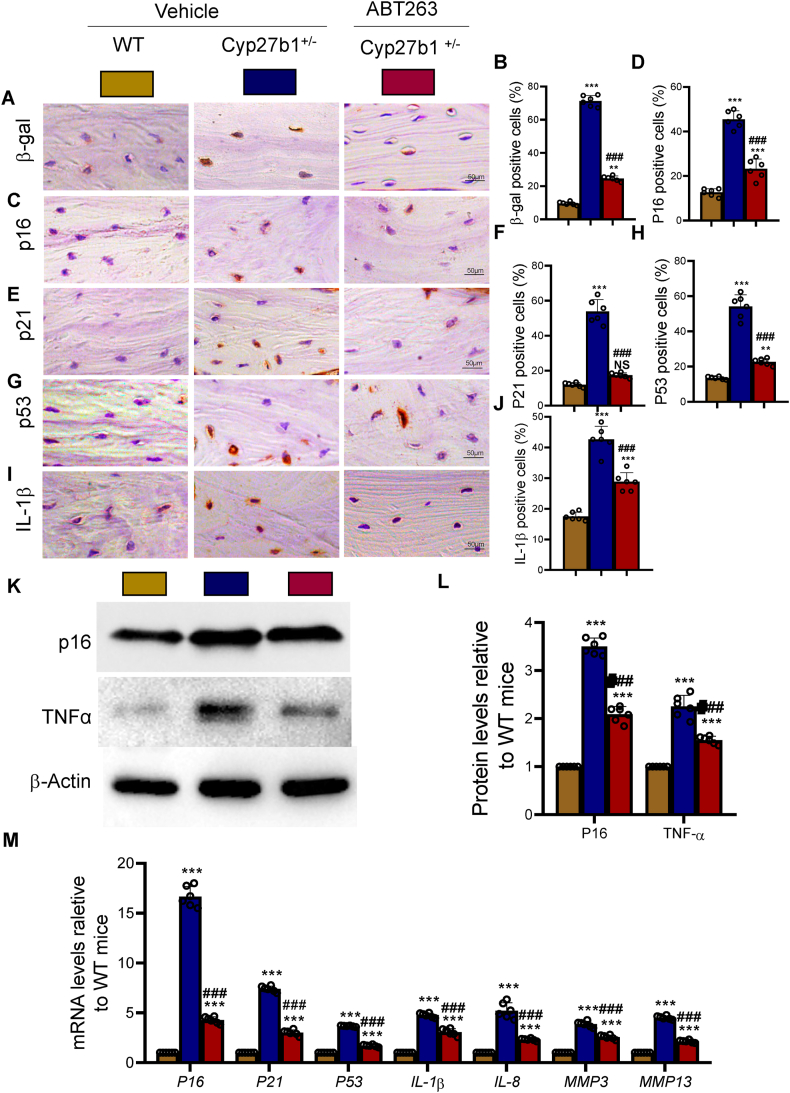
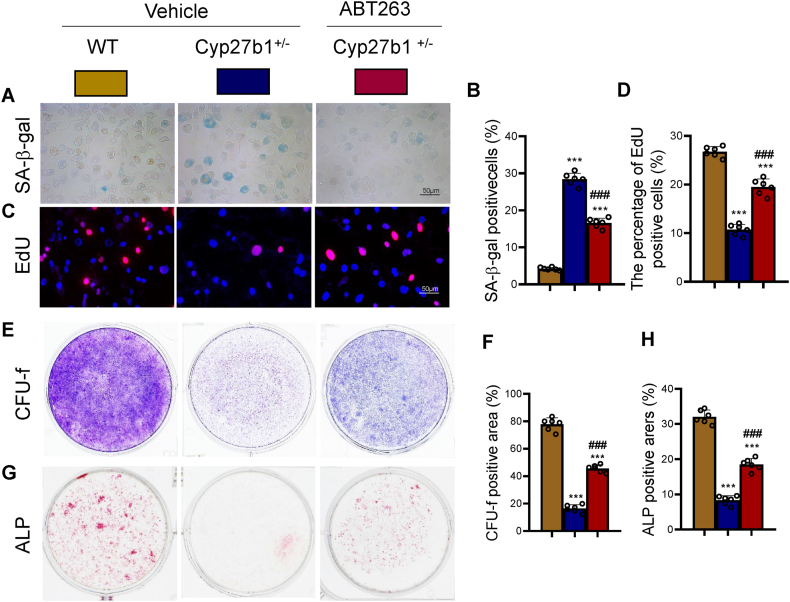
Results: ABT263 induced apoptosis in senescent BM-MSCs by downregulating Bcl2 and upregulating Bax expression. It also induced apoptosis in senescent BM-MSCs from 1,25(OH)2D-insufficient mice. ABT263 administration corrected bone loss caused by 1,25(OH)2D insufficiency by increasing bone density, bone volume, trabecular number, trabecular thickness, and collagen synthesis. It also enhanced osteoblastic bone formation and reduced osteoclastic bone resorption in vivo. ABT263 treatment corrected the impaired osteogenic action of BM-MSCs by promoting their proliferation and osteogenic differentiation. Furthermore, it corrected oxidative stress and DNA damage caused by 1,25(OH)2D insufficiency by increasing SOD-2 and decreasing γ-H2A.X expression. Finally, ABT263 corrected bone cell senescence and SASP caused by 1,25(OH)2D insufficiency by reducing the expression of senescence and SASP-related genes and proteins.

Conclusion: ABT263 can correct osteoporosis caused by active vitamin D insufficiency by selectively clearing senescent skeletal cells, reducing oxidative stress, DNA damage, and SASP, and promoting bone formation while inhibiting bone resorption. These findings provide new insights into the potential therapeutic application of senolytic agents in the treatment of osteoporosis associated with active vitamin D insufficiency.

The translational potential of this article: This study highlights the therapeutic potential of ABT263, a senolytic compound, in treating osteoporosis caused by active vitamin D insufficiency. By selectively eliminating senescent bone cells and their associated SASP, ABT263 intervention demonstrates the ability to restore bone homeostasis, prevent further bone loss, and promote bone formation. These findings contribute to the growing body of research supporting the use of senolytic therapies for the prevention and treatment of age-related bone disorders. The translational potential of this study lies in the development of novel therapeutic strategies targeting cellular senescence to combat osteoporosis, particularly in cases where vitamin D insufficiency is a contributing factor. Further clinical studies are warranted to validate the efficacy and safety of ABT263 and other senolytic agents in the treatment of osteoporosis in humans.

Keywords: Cellular senescence; Osteoporosis; SASP; Senolytics; Vitamin D insufficiency.


Conflict of interest statement

The authors declare no conflicts of interest.

Figures

Image 1
Graphical abstract
Figure 1
Figure 1
ABT263 induces apoptosis in senescent BM-MSCs by downregulating Bcl2 and upregulating Bax expression levels. Viability of BM-MSCs derived from (A) young mice (2M) and (B) aged mice (18M) treated with ABT263 at different concentrations. qRT-PCR results of relative expression levels of (C) Bcl2 mRNA and (D) pro-apoptotic gene Bax mRNA. (E) Western blot results of relative expression levels of Bcl2 and Bax proteins. (F) Bar graph showing the relative expression levels of Bcl2 and Bax proteins. (G) Representative flow cytometry results showing apoptotic cells in ABT263-treated BM-MSCs derived from aged mice. (H) Bar graph showing the percentages of early and late apoptotic cells and necrotic cells. (I) Representative micrographs displaying double fluorescence staining for p16 and TUNEL. (J) The ratio of TUNEL-positive cells to p16-positive cells. Values are mean ± S.E.M. of 6 determinations per group. ∗∗: P < 0.01; ∗∗∗: P < 0.001, compared to the control group.
Figure 2
Figure 2
ABT263 induces apoptosis in senescent BM-MSCs from 1,25(OH)2D-insufficient mice BM-MSCs were isolated and cultured BM-MSCs from WT and Cyp27b1+/− mice with vehicle or from the Cyp27b1+/− mice with 10 nM ABT263 for 24 h. (A) Representative micrographs of SA-β-gal staining. (B) Percentage of SA-β-gal positive cells. (C) Representative micrographs of TUNEL staining. (D) Percentage of TUNEL-positive cells. (E) Representative flow cytometry results showing apoptotic cells. (F) Percentage of apoptotic cells. (G) Western blot detection of Bcl2, Bax, and cleaved-Caspase3 (C- Caspase3) proteins in thoracic vertebrae tissues. (H) Relative expression levels of Bcl2, Bax, and cleaved-Caspase3 proteins. Values are mean ± S.E.M. of 6 determinations per group. ∗∗∗: P < 0.001, compared to WT mice. ##: P < 0.01; ###: P < 0.001, compared to Cyp27b1+/− BM-MSCs.
Figure 3
Figure 3
ABT263 intervention corrects bone loss caused by 1,25(OH)2D insufficiency Lumbar vertebrae of WT, Cyp27b1+/−, and ABT263 treated Cyp27b1+/− (Cyp27b1+/−+ ABT263) mice. (A) Three-dimensional reconstruction by micro-CT. (B) Quantitative analysis of BMD (mg/cm3). (C) Quantitative analysis of BV/TV (%). (D) Quantitative analysis of Tb.Th (μm). (E) Quantitative analysis of Tb.N (mm−1). (F) Quantitative analysis of Tb.Sp (μm). (G) Representative micrographs of T-COL histological staining. (H) Quantitative analysis of total collagen (T-COL) staining-positive area (%). Values are mean ± S.E.M. of 6 determinations per group. ∗∗∗: P < 0.001, compared to WT mice. ##: P < 0.01; ###: P < 0.001, compared to Cyp27b1+/− mice.
Figure 4
Figure 4
ABT263 intervention corrects decreased bone formation and increased bone resorption caused by 1,25(OH)2D insufficiency Slices of lumbar vertebrae from WT, Cyp27b1+/−, and Cyp27b1+/−+ ABT263 mice. (A) Representative micrographs of H&E staining. (B) Quantitative analysis of osteoblast numbers per unit bone tissue area (N.Ob/B.Pm., #/mm). (C) Representative micrographs of ALP histochemical staining. (D) Quantitative analysis of ALP-positive area (%). (E) Representative micrographs of TRAP histochemical staining. (F) Osteoclastic surface relative to bone surface (Oc.S/B.S, %). (G) Real-time RT–PCR of tissue extracts of lumbar vertebrae for expression of RANKL and OPG. Messenger RNA expression assessed by real-time RT-PCR is calculated as a ratio relative to Gapdh, and expressed as ratio of RANKL/OPG mRNA relative levels to WT mice. (H) Relative expression levels of OCN, Runx2, and Osterix mRNA. (I) Western blot results of OCN, Runx2, and Osterix proteins in thoracic vertebrae tissues. (J) Relative expression levels of OCN and Runx2 proteins. Values are mean ± S.E.M. of 6 determinations per group. ∗∗∗: P < 0.001, compared to WT mice. ##: P < 0.01; ###: P < 0.001, compared to Cyp27b1+/− mice.
Figure 5
Figure 5
ABT263 intervention corrects oxidative stress and DNA damage caused by 1,25(OH)2D insufficiency Lumbar vertebrae of WT, Cyp27b1+/−, and Cyp27b1+/−+ ABT263 mice. (A & B) Representative micrographs of SOD2 immunohistochemical staining and the percentage of SOD2-positive cells. (C & D) Representative micrographs of γ-H2A.X immunohistochemical staining and the percentage of γ-H2A.X-positive cells. (E & F) Western blot results of SOD2 and γ-H2A.X proteins. Values are mean ± S.E.M. of 6 determinations per group. ∗∗∗: P < 0.001, compared to WT mice. ##: P < 0.01; ###: P < 0.001, compared to Cyp27b1+/− mice.
Figure 6
Figure 6
ABT263 intervention corrects bone cell senescence and SASP caused by 1,25(OH)2D insufficiency Slices of lumbar vertebrae from WT, Cyp27b1+/−, and Cyp27b1+/−+ ABT263 mice. (A & B) Representative micrographs and the percentage of β-gal-positive cells. (C & D) Representative micrographs and the percentage of p16-positive cells. (E & F) Representative micrographs and the percentage of p21-positive cells. (G & H) Representative micrographs and the percentage of p53-positive cells. (I & J) Representative micrographs and the percentage of IL-1β-positive cells. (K) Western blot results of p16 and TNFα proteins. (L) Relative expression levels of p16 and TNFα proteins. (M) Relative expression levels of senescence-related genes p16, p21, p53, and SASP-related genes IL-1β, IL-8, MMP3, and MMP13 mRNA. Values are mean ± S.E.M. of 6 determinations per group. ∗: P < 0.05; ∗∗: P < 0.01; ∗∗∗: P < 0.001, compared to WT mice. ##: P < 0.01; ###: P < 0.001, compared to Cyp27b1+/− mice.
Figure 7
Figure 7
ABT263 intervention corrects BMSC osteogenesis impairments caused by 1,25(OH)2D insufficiency BM-MSCs from WT, Cyp27b1+/−, and Cyp27b1+/−+ ABT263 mice were treated for 1 month and were cultured ex vivo. (A) Representative micrographs of SA-β-gal staining. (B) Percentage of SA-β-gal-positive cells. (C) Representative micrographs of EdU incorporation. (D) Percentage of EdU-positive cells. (E) Representative image of methylene blue staining. (F) Quantification of CFU-f-positive area. (G) Representative micrographs of ALP cytochemical staining. (H) Quantification of ALP-positive area. Values are mean ± S.E.M. of 6 determinations per group. ∗∗∗: P < 0.001, compared to WT mice. ##: P < 0.01; ###: P < 0.001, compared to Cyp27b1+/− mice. (For interpretation of the references to colour in this figure legend, the reader is referred to the Web version of this article.)

Similar articles

References

    1. Holick M.F. Vitamin D deficiency. N Engl J Med. 2007;357(3):266–281. - PubMed
    1. Lips P., van Schoor N.M. The effect of vitamin D on bone and osteoporosis. Best Pract Res Clin Endocrinol Metabol. 2011;25(4):585–591. - PubMed
    1. Qiao W., Yu S., Sun H., Chen L., Wang R., Wu X., et al. 1,25-Dihydroxyvitamin D insufficiency accelerates age-related bone loss by increasing oxidative stress and cell senescence. Am J Transl Res. 2020;12(2):507–518. - PMC - PubMed
    1. Yang R., Chen J., Zhang J., Qin R., Wang R., Qiu Y., et al. 1,25-Dihydroxyvitamin D protects against age-related osteoporosis by a novel VDR-Ezh2-p16 signal axis. Aging Cell. 2020;19(2) - PMC - PubMed
    1. Yang R., Zhang J., Li J., Qin R., Chen J., Wang R., et al. Inhibition of Nrf2 degradation alleviates age-related osteoporosis induced by 1,25-Dihydroxyvitamin D deficiency. Free Radic Biol Med. 2022;178:246–261. - PubMed

LinkOut - more resources