[Preprint]. 2024 Oct 10:2024.10.08.616922.
doi: 10.1101/2024.10.08.616922.

CRISPR tiling deletion screens reveal functional enhancers of neuropsychiatric risk genes and allelic compensation effects (ACE) on transcription

Affiliations

CRISPR tiling deletion screens reveal functional enhancers of neuropsychiatric risk genes and allelic compensation effects (ACE) on transcription

Xingjie Ren et al. bioRxiv. .

Abstract

Precise transcriptional regulation is critical for cellular function and development, yet the mechanism of this process remains poorly understood for many genes. To gain a deeper understanding of the regulation of neuropsychiatric disease risk genes, we identified a total of 39 functional enhancers for four dosage-sensitive genes, APP, FMR1, MECP2, and SIN3A, using CRISPR tiling deletion screening in human induced pluripotent stem cell (iPSC)-induced excitatory neurons. We found that enhancer annotation provides potential pathological insights into disease-associated copy number variants. More importantly, we discovered that allelic enhancer deletions at SIN3A could be compensated by increased transcriptional activities from the other intact allele. Such allelic compensation effects (ACE) on transcription is stably maintained during differentiation and, once established, cannot be reversed by ectopic SIN3A expression. Further, ACE at SIN3A occurs through dosage sensing by the promoter. Together, our findings unravel a regulatory compensation mechanism that ensures stable and precise transcriptional output for SIN3A, and potentially other dosage-sensitive genes.


Conflict of interest statement

Competing interests B.R. is a co-founder and consultant of Arima Genomics Inc. and co-founder of Epigenome Technologies. The other authors declare that they have no competing interests.

Figures

Extended Data Figure 1.
Extended Data Figure 1.. Engineered reporter cell lines and gene expression.
a, Flow cytometry plots showing the expression of EGFP and mCherry reporters in APP-EGFP/mCherry, SIN3A-EGFP/mCherry, FMR1-mCherry, and MECP2-EGFP reporter cell lines. The expression of reporters was checked in both iPSCs and excitatory neurons. Gray lines are signals from negative control cells, WTC11 i3N. b, RNA-seq data shows the expression of APP, FMR1, MECP2, and SIN3A in iPSCs and 2-week excitatory neurons. The genes were ranked on RPKM. c, The expression of cell type marker genes in iPSCs and excitatory neurons.
Extended Data Figure 2.
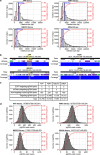
Extended Data Figure 2.. pgRNA libraries of APP, FMR1, MECP2, and SIN3A.
a, The distribution of deletion size of pgRNA libraries. Blue lines indicate the average deletion size of each pgRNA library. b, The coverage of pgRNA libraries. The gene body regions of each gene were labeled with yellow. c, The composition of pgRNA libraries. d, The distribution of pgRNA read counts and cumulative frequency in cloned plasmid libraries. More than 99% of designed pgRNA were recovered in each plasmid library.
Extended Data Figure 3.
Extended Data Figure 3.. CREST-seq screens and data analysis.
a, The representative FACS plots showing the sorting strategies used for CREST-seq screens. The reporter cells without pgRNA library infection were used as the control for each screen. b, The functional sequence probability score of genome segments in RELICS analysis for each screen. The black dashed lines indicate the default cutoff of the functional sequence probability score (score = 0.1) in RELICS. The genome segments with a score >0.1 were identified as functional sequences in RELICS analysis.
Extended Data Figure 4.
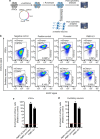
Extended Data Figure 4.. Enhancer validation strategy and validation of FMR1 enhancer.
a, The flow cytometry based strategy for enhancer validation. b, Flow cytometry plots showing the percentage of cells with reduced FMR1-mCherry expression in each condition. The negative control is the WTC11 i3N cells. The positive control is the FMR1-mCherry reporter cells. c, Bar graphs showing the significance of the relative enrichment of cells with reduced expression of FMR1-mCherry compared to positive control cells. P values were determined using the two-sided Fisher’s exact test. * P < 0.0001.
Extended Data Figure 5.
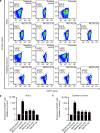
Extended Data Figure 5.. MECP2 enhancer validations.
a, Flow cytometry plots showing the percentage of cells with reduced MECP2-EGFP expression in each condition. The negative control is the WTC11 i3N cells. The positive control is the MECP2-EGFP reporter cells. b,c, Bar graphs showing the significance of the relative enrichment of cells with reduced expression of MECP2-EGFP compared to positive control cells. P values were determined using the two-sided Fisher’s exact test. * P < 0.0001.
Extended Data Figure 6.
Extended Data Figure 6.. APP enhancer validation.
a, Flow cytometry plots showing the percentage of cells with reduced expression of APP-EGFP or APP-mCherry signals in each condition. The negative control is the WTC11 i3N cells. The positive control is the APP-EGFP/mCherry reporter cells. b, Bar graphs showing the significance of the relative enrichment of cells with reduced expression of APP-EGFP or APP-mCherry compared to positive control cells. P values were determined using the two-sided Fisher’s exact test. * P < 0.0001.
Extended Data Figure 7.
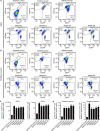
Extended Data Figure 7.. SIN3A enhancer validations.
a,b, Flow cytometry plots showing the percentage of cells with reduced expression of SIN3A-EGFP or SIN3A-mCherry in each condition. The negative control is the WTC11 i3N cells. The positive control is the SIN3A-EGFP/mCherry reporter cells. c,d, Bar graphs showing the significance of the relative enrichment of cells with reduced expression of SIN3A-EGFP or SIN3A-mCherry compared to positive control cells. P values were determined using the two-sided Fisher’s exact test. * P < 0.0001.
Extended Data Figure 8.
Extended Data Figure 8.. Editing outcomes of CTCF sgRNAs.
a, CRISPResso2 analysis of the targeted sequencing data shows the genome editing outcomes at the CTCF motif in the cells with reduced expression of SIN3A-EGFP or SIN3A-mCherry.
Extended Data Figure 9.
Extended Data Figure 9.. The regulatory function of copy number variants.
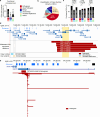
a, The percentage of copy number variants (CNVs) with experimental evidence-based functional consequences. Numbers are displayed in the format of CNVs with functional consequences / total CNVs in each category. b, The classification of copy number variants (size ≥ 50bp) in ClinVar. c, The overlap between CNVs and coding regions, promoter regions, and distal cCREs. Numbers are displayed in the format of overlapping CNVs / total CNVs in each category. P values determined by two-sided Fisher’s exact test. * P < 1×10⁻¹⁵. d, The overlap between SIN3A enhancers, SIN3A gene, and genetic variants including heterozygous deletions from Witteveen-Kolk syndrome patients and two copy number loss variants in ClinVar. e, The overlap between MECP2 enhancer and copy number variants in MECP2 locus. In total, 155 clinical deletion/copy number loss variants overlapping with MECP2 coding regions were interpreted as pathogenic variants and associated with Rett syndrome. RCV000142850 is a 4.3kb copy number loss variant located in the 3’UTR of MECP2, and it was interpreted as a pathogenic variant.
Extended Data Figure 10.
Extended Data Figure 10.. cis-regulation of SIN3A by the SIN3A-E2 enhancer.
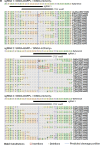
a, Sanger sequencing data showing the genotype of each allele of SIN3A enhancer and SIN3A. P1 and P2 alleles are identified using the phased variants in WTC11 genome. Both SIN3A enhancer region and SIN3A region are amplified using genomic DNA from indicated cells, and the phased variants in amplified regions are confirmed using Sanger sequencing.
Extended Data Figure 11.
Extended Data Figure 11.. SIN3A ectopic expression and SIN3A promoter reporter assay.
a, The SIN3A promoter P1 controlled SIN3A-P2A-BFP expression cassette. b, RT-qPCR results show the expression levels of SIN3A in control condition and overexpression conditions. Data are mean ± SD from three technical replicates. c, WashU Epigenome Browser snapshot showing SIN3A transcripts from refGene, SIN3A promoter deletion region in validation experiments, two promoter regions used for SIN3A promoter reporter assay, ATAC-seq signal in WTC11 iPSCs, and SIN3A ChIP-seq signals in H1 cells. d, The expression of SIN3A transcripts from long read RNA-seq data in WTC11 cells. Data are mean ± SEM from three biological replicates.
Extended Data Figure 12.
Extended Data Figure 12.. Transcriptional compensation is associated with gene dosage sensitivity.
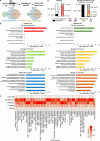
a, The strategy used for identifying candidate genes with transcriptional compensation. Venn diagrams show the distribution of transcriptional activators and transcriptional repressors in 530 human transcription factors (TFs) and 321 mouse TFs. b, The significant enrichment of human and mouse TFs in cellular component, biological process, and molecular function. c, The expression of the identified candidate transcriptional compensation genes (transcriptional repressor) in human tissues. The expression data were obtained from GTEx. d, The distribution of identified candidate transcriptional compensation genes in ClinGen and Dosage sensitivity map. Haplo: haploinsufficiency. Triplo: triplosensitivity.
Figure 1.
Figure 1.. Identification and analysis of enhancers of four neuropsychiatric risk genes.
a, The workflow of identifying enhancers of APP, FMR1, MECP2, and SIN3A in iPSC-induced excitatory neurons using CRISPR tilling deletion screening. b, The P value distribution of enriched pgRNAs (log2FC>0) in each screen. The positive control pgRNAs targeting EGFP and mCherry and some of the test pgRNAs are significantly enriched in each screen. The negative control pgRNAs are not significantly enriched. c, The distribution of identified enhancers of APP, FMR1, MECP2, and SIN3A, relative to TSS of each target gene. d, Upset plot showing the overlap between identified enhancers and each chromatin feature. The numbers in each row and column indicate the total number of enhancers in each category. e, The percentage of enhancers interacting and not interacting with target promoters based on H3K4me3 PLAC-seq data.
Figure 2.
Figure 2.. Validating CREST-seq identified enhancers.
a, Genome browser screenshot showing gene body enhancer of FMR1 and sgRNAs targeting FMR1 promoter and enhancer. b, Flow cytometry plots showing the significant downregulation of FMR1-mCherry expression after deleting FMR1 promoter and FMR1-E1 enhancer in both iPSCs and excitatory neurons. Positive controls (black line) are the FMR1-mCherry reporter cells. c, Genome browser screenshot showing identified enhancers of MECP2 and sgRNAs targeting MECP2 promoter and enhancers. d, Single clones of MECP2 promoter or enhancers deletion showing significant downregulation of MECP2-EGFP in both iPSCs and excitatory neurons. Positive controls (black line) are the MECP2-EGFP cells. C1 and C2 indicate two independent clones. e, RT-qPCR results showing the significant downregulation of MECP2 expression in each clone (P < 0.05 for all the clones, two-tailed two-sample t-test; n = 2). Data are mean ± SEM. f, Flow cytometry plots showing the significant downregulation of APP-EGFP or APP-mCherry in APP promoter and APP-E3 deletion cells. Positive controls (black line) are the APP-EGFP/mCherry reporter cells. g, Flow cytometry plots showing the downregulation of SIN3A-EGFP or SIN3A-mCherry in SIN3A promoter and SIN3A-E4 deletion cells. Red dashed lines indicate the position of SIN3A-EGFP/mCherry double positive cells. h, The genome browser screenshot showing the CTCF ChIP-seq signal in SIN3A-E4 enhancer region in WTC11 iPSCs. The CTCF motif was obtained from JASPAR. Two sgRNAs were designed to target the CTCF motif. PAM sequences were in red. i, Flow cytometry plots showing the downregulation of SIN3A-EGFP or SIN3A-mCherry in sgRNA1 and sgRNA2 infected cells. j, The editing outcomes of sgRNA 1 in the cells of SIN3A-EGFP−/SIN3A-mCherry+. k, The enrichment of disease-associated CNVs in distal cCREs identified in diverse cell types in the human body. Heatmap shows the data from diseases with at least 10 CNVs and P value less than 1×10 in at least one cell type.
Figure 3.
Figure 3.. Allelic enhancer deletion induces transcriptional compensation of SIN3A.
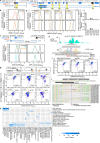
a, Genome browser screenshot showing enhancers of SIN3A and sgRNAs targeting SIN3A promoter and enhancers. b, Flow cytometry plots showing the significant downregulation of SIN3A-EGFP and SIN3A-mCherry expression after deleting SIN3A enhancers. Positive controls (black lines) are SIN3A-EGFP/mCherry reporter cells. c, The model of the allelic expression pattern of SIN3A and the associated genotype. d, Sanger sequencing shows the SNP in SIN3A intron. e, Allelic gene expression analysis using the SNP located in SIN3A intron shows dominant expression from one allele in G−M+ (SIN3A-EGFP−/SIN3A-mCherry+) and G+M− (SIN3A-EGFP+/SIN3A-mCherry−) clones in both iPSCs and 2-week excitatory neurons. C1 and C2 indicate two independent clones, and each clone has three biological replicates. Dark blue color indicates the C allele, and orange color indicates the T allele. f, RT-qPCR results showing the total SIN3A expression in each clone relative to GAPDH. Each clone has three biological replicates. P values were determined using the two-tailed two-sample t-test.
Figure 4.
Figure 4.. Allelic enhancer deletion-induced allelic compensation effect (ACE) is a dynamic process.
a, Flow cytometry plots showing the expression of SIN3A-EGFP and SIN3A-mCherry in control cells (SIN3A-EGFP/mCherry reporter cells) and cells infected with pgRNAs targeting SIN3A promoter and SIN3A-E4 enhancer. The dates refer to the days following the lentivirus infection. b, Dot plots showing the expression trend of SIN3A-EGFP and SIN3A-mCherry signals in the cells with reduced expression level of SIN3A-EGFP or SIN3A-mCherry in panel a. Trendlines are based on logarithmic model. c, Allelic promoter and enhancer deletion-induced downregulation of SIN3A. Dots indicate the levels of SIN3A-EGFP or SIN3A-mCherry in cells with allelic promoter or enhancer deletions. The black dashed line indicates allelic expression levels from wild-type cells. d, The ACE rate of SIN3A enhancer E4 deletion. The average downregulation and transcriptional compensation resulting from enhancer deletion on the EGFP and mCherry alleles were used to calculate the slope between each pair of adjacent time points. e, Flow cytometry plots showing the SIN3A-EGFP and SIN3A-mCherry signals from each clone in iPSCs and neurons. Positive control is SIN3A-EGFP/mCherry reporter cells. C1 and C2 indicate two independent clones of each genotype. f, Flow cytometry plots showing the SIN3A-EGFP and SIN3A-mCherry signals in the cells with and without ectopic SIN3A expression. SIN3A-EGFP/mCherry reporter cells were used as control.
Figure 5.
Figure 5.. The SIN3A promoter mediates allelic enhancer deletion-induced allelic compensation effect (ACE).
a, Flow cytometry plots showing the EGFP expression from SIN3A promoter reporters. b, shRNA-mediated downregulation of SIN3A. c,d, SIN3A promoter reporters show significantly higher EGFP intensity in cells with SIN3A shRNA, compared to cells with control shRNA. P values in panels b-d were determined using the two-tailed two-sample t-test. e, The working model of allelic enhancer deletion-induced ACE. SIN3A is evenly expressed from two alleles in wild-type cells. Allelic enhancer deletion causes downregulation of SIN3A from the enhancer deletion allele (sky blue dashed line), which triggers ACE from the intact allele (sky blue solid line). Allelic partial promoter deletion causes partial downregulation of SIN3A (orange dashed line) without ACE (orange solid line).

Similar articles

References

    1. Lettice L. A. et al. A long-range Shh enhancer regulates expression in the developing limb and fin and is associated with preaxial polydactyly. Hum Mol Genet 12, 1725–1735 (2003). - PubMed
    1. Long H. K. et al. Loss of Extreme Long-Range Enhancers in Human Neural Crest Drives a Craniofacial Disorder. Cell Stem Cell 27, 765–783.e14 (2020). - PMC - PubMed
    1. Zhang K. et al. A single-cell atlas of chromatin accessibility in the human genome. Cell 184, 5985–6001.e19 (2021). - PMC - PubMed
    1. ENCODE Project Consortium et al. Expanded encyclopaedias of DNA elements in the human and mouse genomes. Nature 583, 699–710 (2020). - PMC - PubMed
    1. Collins R. L. et al. A cross-disorder dosage sensitivity map of the human genome. Cell 185, 3041–3055.e25 (2022). - PMC - PubMed

Publication types

LinkOut - more resources