[Preprint]. 2024 Oct 12:2024.10.11.617745.
doi: 10.1101/2024.10.11.617745.

map3k1 suppresses terminal differentiation of migratory eye progenitors in planarian regeneration

Affiliations

map3k1 suppresses terminal differentiation of migratory eye progenitors in planarian regeneration

Katherine C Lo et al. bioRxiv. .

Abstract

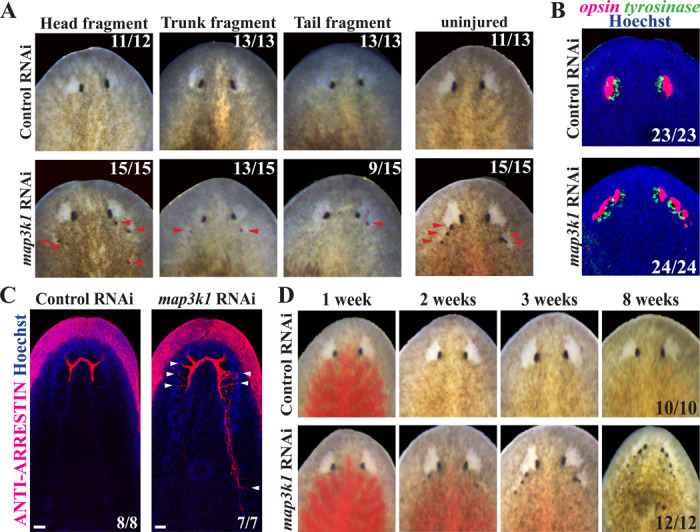
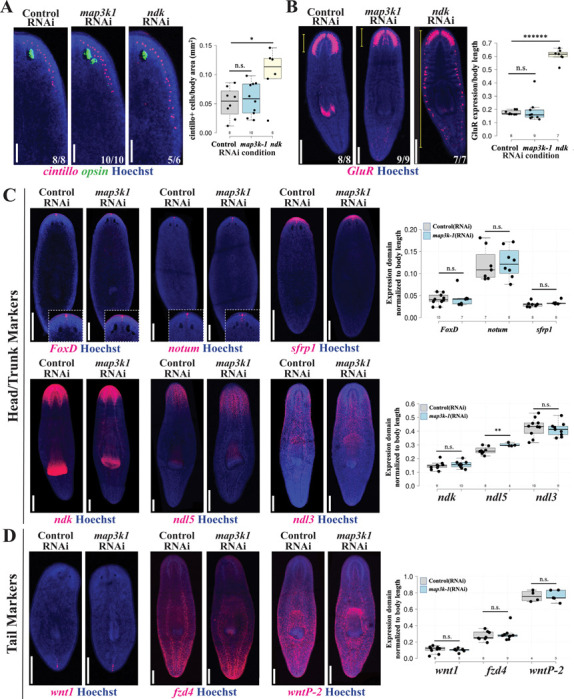
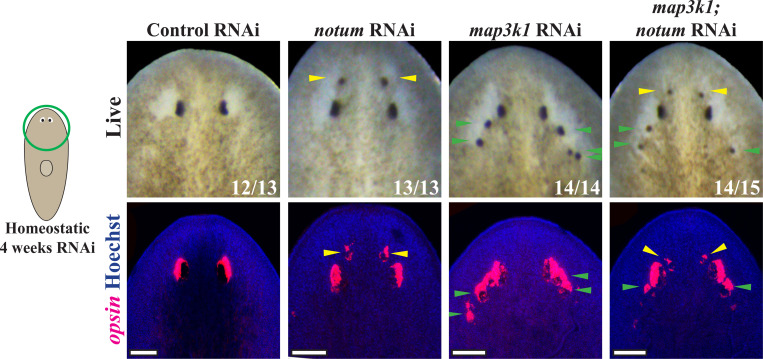
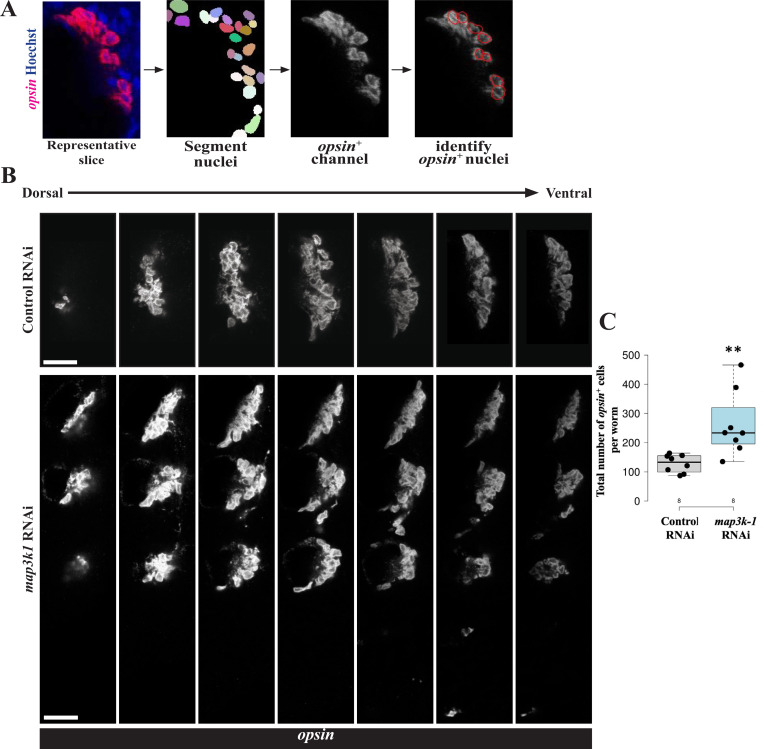
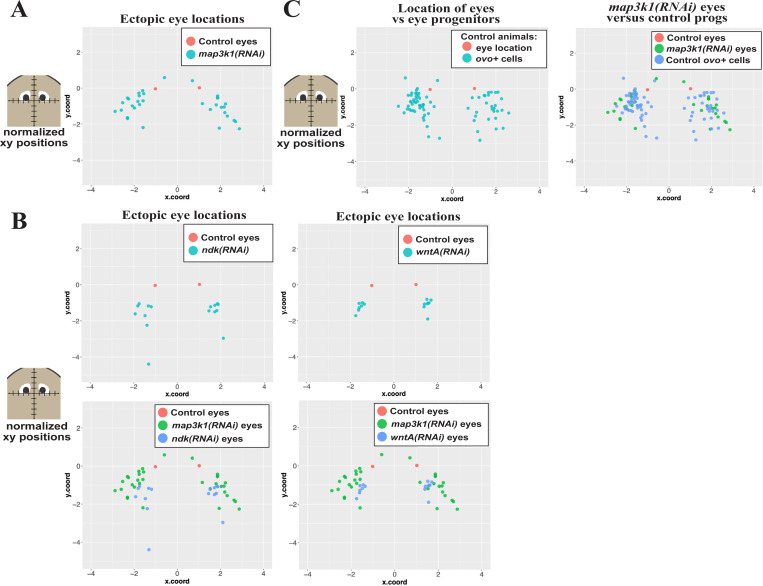
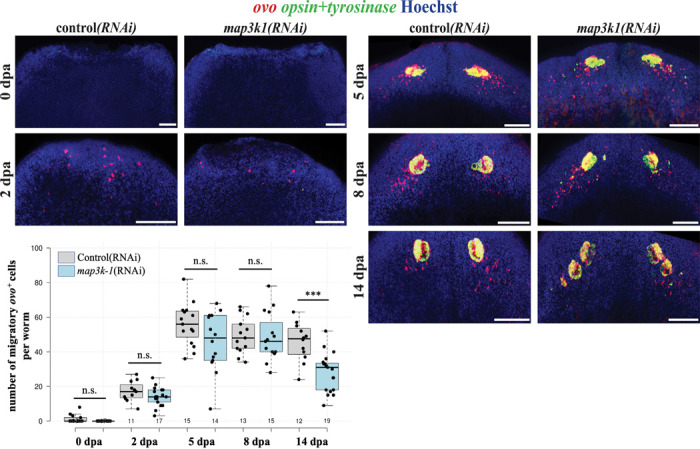
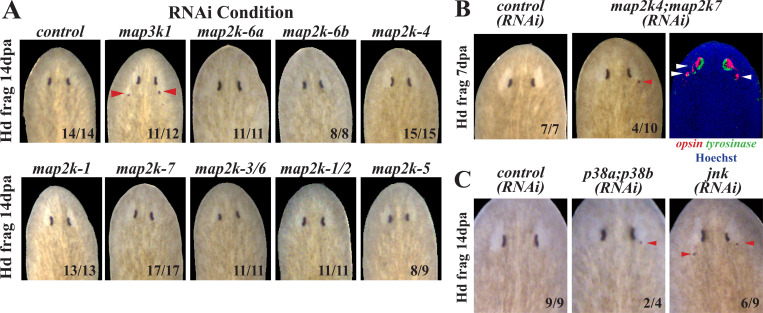
Proper stem cell targeting and differentiation is necessary for regeneration to succeed. In organisms capable of whole body regeneration, considerable progress has been made identifying wound signals initiating this process, but the mechanisms that control the differentiation of progenitors into mature organs are not fully understood. Using the planarian as a model system, we identify a novel function for map3k1, a MAP3K family member possessing both kinase and ubiquitin ligase domains, to negatively regulate terminal differentiation of stem cells during eye regeneration. Inhibition of map3k1 caused the formation of multiple ectopic eyes within the head, but without controlling overall head, brain, or body patterning. By contrast, other known regulators of planarian eye patterning like WntA and notum also regulate head regionalization, suggesting map3k1 acts distinctly. Eye resection and regeneration experiments suggest that unlike Wnt signaling perturbation, map3k1 inhibition did not shift the target destination of eye formation in the animal. Instead, map3k1(RNAi) ectopic eyes emerge in the regions normally occupied by migratory eye progenitors, and the onset of ectopic eyes after map3k1 inhibition coincides with a reduction to eye progenitor numbers. Furthermore, RNAi dosing experiments indicate that progenitors closer to their normal target are relatively more sensitive to the effects of map3k1, implicating this factors in controlling the site of terminal differentiation. Eye phenotypes were also observed after inhibition of map2k4, map2k7, jnk, and p38, identifying a putative pathway through which map3k1 prevents differentiation. Together, these results suggest that map3k1 regulates a novel control point in the eye regeneration pathway which suppresses the terminal differentiation of progenitors during their migration to target destinations.


Conflict of interest statement

Competing Interest Statement: The authors declare that they have no competing interests.

Figures

Fig 1.
Fig 1.. map3k1 RNAi causes formation of ectopic eyes in regenerating and uninjured planarians.
(A-B) Animals were fed control or map3k1 dsRNA 6 times over 2 weeks, then amputated into head, trunk and tail fragments and allowed to regenerate for 14 days or left uninjured for an equal amount of time, followed by (A) live imaging or (B) FISH to detect opsin and tyrosinase markers of eye cells. In each type of regenerating fragment, map3k1 RNAi caused formation of ectopic eyes (red arrowheads) that contained opsin+ photoreceptor neurons and tyrosinase+ pigment cup cells. (C) Homeostatic map3k1(RNAi) and control animals were stained with anti-ARRESTIN antibody to mark photoreceptor neuron axons. map3k1 inhibition caused formation of ectopic ARRESTIN+ axons projecting toward the brain (white arrowheads). Scale bars 50μm. (D) Uninjured animals were fed with dsRNA twice per week for the times indicated and live imaged in a timeseries to visualize the progression of the map3k1(RNAi) phenotype. map3k1(RNAi) caused a progressive formation of additional eyes mainly located within the head region. Number of animals scored for each condition are indicated in the panels.
Fig 2.
Fig 2.. map3k1 RNAi does not broadly affect brain size or body patterning.
Homeostatic animals fixed after 3 or 4 weeks of RNAi were stained with markers to detect the effects of map3k1 on brain and body patterning. (A) ndk RNAi caused an expected increase in the domain size (left images) and number (right quantifications) of brain-associated cintillo cells, while map3k1 RNAi had no effect. Right, box plots overlayed with jittered scatterplots showing individual datapoints displaying the per-animal number of cintillo+ cells normalized to body area in millimeters2 (mm2). *, p<0.05; n.s. represents p>0.05 as calculated by 2-tailed unpaired t-test; sample sizes for each condition are n≥6. Scale bars, 100μm. (B) Likewise, map3k1 RNAi did not change the AP distribution of brain branches marked by GluR, while ndk RNAi resulted in ectopic brain branches forming throughout the body. Right, box plots showing the distance from the anterior tip of the animal to the most posterior GluR expression in the brain, relative to body length, for each of the corresponding RNAi conditions. ******, p<1E-7, n.s. represents p>0.05 as calculated by 2-tailed unpaired t-test; sample sizes for each condition are n≥7. Scale bars, 300μm. (C-D) Control and map3k1(RNAi) animals stained for position control gene (PCG) markers of (C) anterior and (D) posterior body patterning. Expression domains were either assessed after 14 days of regeneration following 2 weeks of dsRNA feeding and amputation of tails (wnt1), or assessed in uninjured animals treated with dsRNA for 3 weeks prior to fixation (all other probes). Right, plots showing quantification of expression domain sizes normalized to body length in Fiji/ImageJ. The sizes of foxD, notum, sfrp1, ndk, and ndl5 expression domains were measured starting from the head tip to the posterior-most boundary of expression. ndl3 occupies a position that does not reach the tip of the head, so the AP extent of this domain was measured instead. wnt1, fzd4, and wntp-2 expression domain sizes were measured from the anterior-most expression to the tip of the tail. Each condition had a sample size of at least 5 animals. **, p<0.01; n.s., p>0.05 as calculated by 2-tailed unpaired t-test. Scale bars, 300μm. map3k1 RNAi did not cause a measurable change to the expression domains for the majority of genes tested, and caused a small but statistically significant increase in the expression domain of ndl5 expression.
Fig 3.
Fig 3.. map3k1 likely regulates eye formation independent of Wnt signaling.
Double RNAi experiments were conducted to test potential interactions between notum and map3k1 genes whose individual inhibition causes spatially distinct ectopic eye phenotypes. Animals were fed dsRNA every 2–3 days for 4 weeks before live scoring (top panels) and fixation to detect opsin+ eye cells (bottom panels). As expected, notum(RNAi) animals formed anterior ectopic eyes (13/13), while map3k1(RNAi) animals formed posterior ectopic eyes (14/14). However, nearly all map3k1;notum(RNAi) animals formed a synthetic phenotype in which both anterior and posterior ectopic eyes formed (14/15). Therefore, it is likely that map3k1 and Wnt pathways regulate distinct processes in eye formation. Yellow arrows are used to highlight anterior ectopic eyes while green arrows are used to highlight posterior ectopic eyes. Single-RNAi conditions involved combining control dsRNA with an equal amount of experimental dsRNA so that all treatments received the same total amount of dsRNA. Scale bars, 100μm.
Fig 4.
Fig 4.. map3k1 inhibition causes an increase in numbers of differentiated eye cells.
Uninjured control and map3k1(RNAi) animals fixed after 3 weeks of RNAi and stained with opsin riboprobe to quantify numbers of eye cells in each condition. Eye cells are present in close association with each other, necessitating an image analysis workflow for their quantification. Z-stacks capturing all eye cells were obtained through confocal imaging, then slices 5-microns apart were selected to represent each stack for 2D segmentation using Stardist, followed by assignment of nuclei as opsin+ using a global threshold and summing number of positive cells across the selected stacks for each animal. (A) Example of an image slice after nuclei segmentation and assignment of opsin+ nuclei (red overlay, right) of how opsin+ cells were counted for one z-stack. (B) Scaled images of example z-stacks from control and map3k1(RNAi) animals showing that map3k1 inhibition resulted in an expansion of eye regions. (C) Total number of opsin+ cells counted in control versus map3k1(RNAi) animals. map3k1 inhibition caused an increase to the number of measured eye cells. Plots show data points overlaid with boxplots. **p=0.01 by 2-tailed unpaired t-test. n=8 animals. Scale bars, 25μm.
Fig 5.
Fig 5.. map3k1(RNAi) ectopic eyes form in a posterior and lateral region within the domain of normal ovo+ migratory cells.
Homeostasis animals were treated with the indicated dsRNA for 3 weeks (control RNAi, wntA RNAi) or 6 weeks (control RNAi, map3k1 RNAi, ndk RNAi) followed by live imaging to detect the location of eyes or fixing and staining to detect the location of migratory ovo+ cells (eye progenitors) in unfed uninjured animals. Planarians lack a fixed size, so in order to make comparisons across treatments, locations of ectopic eyes and eye progenitors in each image were defined and then registered and normalized to the location of the original eyes in order to create a common coordinate system (See methods). These data were plotted as indicated (A-C) in which the AP (y.coord) and ML (x.coord) axes are plotted with units equal to one-half of the inter-eye distance as measured either between the normal eyes of control animals or between the original eyes in ndk(RNAi), wntA(RNAi), and map3k1(RNAi) conditions. (A) Scatterplot of control eyes (red dots, from 5 animals) versus map3k1(RNAi) ectopic eyes (light blue dots, from 8 animals) shows that map3k1 inhibition caused formation of ectopic eyes in a distribution located laterally and posteriorly compared to control eye locations. However, rare map3k1(RNAi) ectopic eyes were also identified slightly anterior to the original eyes (2 blue dots with y.coord>0). (B, top) Plots of ectopic eye locations in ndk(RNAi) or wntA(RNAi) animals (light blue dots) with respect to control eyes (red dots). (B, bottom) Graphs comparing locations of ectopic eyes in map3k1(RNAi) (green dots) versus either ndk(RNAi) animals or wntA(RNAi) animals (blue dots). Both ndk RNAi and wntA RNAi caused a tighter distribution of ectopic eyes that were located more directly posterior to the original eyes compared to the broader distribution of map3k1(RNAi) ectopic eyes located more laterally. (C, left) Locations of migratory ovo+ eye progenitors from control uninjured animals (red dots) were compared to ovo+ mature eyes (light blue dots). (C, right) Locations of ovo+ eye progenitors (blue dots) were compared to locations of ectopic eyes from map3k1(RNAi) animals (green dots). map3k1 inhibition caused formation of ectopic eyes in a set of locations overlapping with the location of the eye progenitors from control animals.
Fig 6.
Fig 6.. map3k1 inhibition reduces number of undifferentiated ovo+ eye progenitors during formation of ectopic eyes.
Animals were treated with control and map3k1 dsRNA for 2 or 3 weeks prior to amputation of heads, and the resulting regenerating trunk fragments were fixed in a time series followed by staining with an ovo riboprobe to detect migratory eye progenitors and simultaneously with mixture of opsin and tyrosinase riboprobes to detect mature eye cells. Numbers of ovo+ migratory progenitors were quantified for each timepoint and condition using maximum projections. Data for 0dpa and 2dpa were aggregated from two experiments. Data for 5dpa, 8dpa, and 14dpa were aggregated from two different experiments, each showing decline in ovo+ eye progenitor numbers at 14dpa. The number of undifferentiated ovo+ eye progenitors did not change significantly in map3k1(RNAi) worms at 0, 2, 5, and 8dpa. At 14dpa, a time when ectopic eyes began to emerge, map3k1(RNAi) worms showed a decrease in ovo+ eye progenitors. Plot show data points from individual animals overlaid with boxplots. ***p<0.001, n.s. represents p>0.05 by a 2-tailed unpaired t-test. Scale bars, 100μm.
Fig 7.
Fig 7.. map3k1 likely controls eye progenitor differentiation through a MAP2K4/7-JNK/p38 pathway.
Members of MAP2K and MAPK gene families were inhibited in order to identify signals downstream of map3k1 regulating eye formation. Animals were treated with indicated dsRNAs for 2 weeks (A-B) or 3 weeks (C) prior to amputation of tails and allowed to regenerate for 7 days (B) or 14 days (A, C) followed by live imaging. (A) While map3k1(RNAi) animals developed ectopic eyes as expected (red arrows), single gene inhibitions of map2k genes did not cause formation of ectopic eyes. (B) map2k4;map2k7(RNAi) animals were observed to develop posterior ectopic eyes (red arrow) through live imaging. Double FISH detecting opsin+ photoreceptor neurons and tyrosinase+ pigment cup cells showed that the ectopic eyes contained both opsin+ and tyrosinase+ cells (white arrows). (C) Inhibition of both homologs of the planarian p38, or jnk, caused ectopic eyes to form in regenerating head fragments. Scorings indicate the number of animals displaying the phenotype depicted in each panel.
Fig 8.
Fig 8.. Increasing the dose of map3k1 dsRNA causes ectopic eyes to form more posteriorly.
Uninjured animals were treated with 3 weeks of either control dsRNA, a mixture of 50% map3k1 dsRNA combined with an equal amount of competing control dsRNA, or 100% map3k1 dsRNA in order to test how different levels of map3k1 inhibition affect the AP locations of ectopic eye formation. (A) Images of live animals after the indicated treatments (left panels), and scoring of the fraction of total animals (% penetrance) obtaining zero, versus 1–2, versus 3 or more ectopic eyes, plotted in a stacked bar graph (right panels). Animals receiving higher doses of map3k1 dsRNA formed a greater number of ectopic eyes. (B) To determine whether the spatial distribution of ectopic eyes was dependent on the dose of map3k1 dsRNA, relative AP and ML positions of the posterior-most ectopic eye in each animal were quantified as in Figure 5 and visualized in scatterplots (see Methods). This procedure normalized the AP (y.coord) and ML (x.coord) positions of the posterior-most ectopic eye in each map3k1(RNAi) animal compared to the location of the original eyes, with units corresponding to one-half of the inter-eye distance in control(RNAi) animals or of the original eyes in map3k1(RNAi) animals. (B, left panels) Plots of the most posterior ectopic eye locations in 50% map3k1(RNAi) or 100% map3k1(RNAi) animals (red dots) with respect to control eyes (light blue dots). (B, right panel) Scatterplots comparing locations of ectopic eyes in 50% map3k1(RNAi) (green triangle) versus 100% map3k1(RNAi) animals (red dot). (C) Boxplot shows the AP locations (y.coord) of the posterior-most eye in each animal, with individual datapoints overlayed as a jittered scatterplot. p-values as calculated by an unpaired 2-tailed t-test are indicated. Higher doses of map3k1 dsRNA caused ectopic eyes to form in more posterior locations. Sample size, n≥11 animals for each condition.
Figure 9.
Figure 9.. map3k1 suppresses terminal differentiation of migratory eye progenitors.
Model of the role of map3k1 in eye regulation. Head patterning factors such as notum and wntA regulate a target zone for eye placement in regeneration, while map3k1 suppresses terminal differentiation of migratory eye progenitors by activating Map2k4/Map2k7-JNK/p38 downstream signals. dsRNA dosage experiments indicate that progenitors located further away from the eyes are less susceptible to the effects of map3k1 inhibition, suggesting that map3k1-dependent processes may normally decline in activity as eye progenitors reach their destination.

Similar articles

References

    1. Reddien PW, Sánchez Alvarado A. Fundamentals of planarian regeneration. Annu Rev Cell Dev Biol. 2004;20:725–57. - PubMed
    1. Wagner DE, Wang IE, Reddien PW. Clonogenic neoblasts are pluripotent adult stem cells that underlie planarian regeneration. Science. 2011;332(6031):811–6. - PMC - PubMed
    1. Zeng A, Li H, Guo L, Gao X, McKinney S, Wang Y, et al. Prospectively Isolated Tetraspanin(+) Neoblasts Are Adult Pluripotent Stem Cells Underlying Planaria Regeneration. Cell. 2018;173(7):1593–608 e20. - PMC - PubMed
    1. Reddien PW. The Cellular and Molecular Basis for Planarian Regeneration. Cell. 2018;175(2):327–45. - PMC - PubMed
    1. Scimone ML, Atabay KD, Fincher CT, Bonneau AR, Li DJ, Reddien PW. Muscle and neuronal guidepost-like cells facilitate planarian visual system regeneration. Science. 2020;368(6498). - PMC - PubMed

Publication types