[Preprint]. 2024 Oct 8:2024.10.08.617123.
doi: 10.1101/2024.10.08.617123.

Automated model-free analysis of cryo-EM volume ensembles with SIREn

Affiliations

Automated model-free analysis of cryo-EM volume ensembles with SIREn

Laurel F Kinman et al. bioRxiv. .

Abstract

Cryogenic electron microscopy (cryo-EM) has the potential to capture snapshots of proteins in motion and generate hypotheses linking conformational states to biological function. This potential has been increasingly realized by the advent of machine learning models that allow 100s-1,000s of 3D density maps to be generated from a single dataset. How to identify distinct structural states within these volume ensembles and quantify their relative occupancies remain open questions. Here, we present an approach to inferring variable regions directly from a volume ensemble based on the statistical co-occupancy of voxels, as well as a 3D-convolutional neural network that predicts binarization thresholds for volumes in an unbiased and automated manner. We show that these tools recapitulate known heterogeneity in a variety of simulated and real cryo-EM datasets, and highlight how integrating these tools with existing data processing pipelines enables improved particle curation and the construction of quantitative conformational landscapes.


Conflict of interest statement

DECLARATION OF COMPETING INTERESTS The authors declare no competing interests.

Figures

Figure 1.
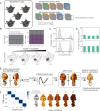
Figure 1.. Inferring structural heterogeneity with SIREn.
(A) Flowchart depicting application of SIREn to infer variable regions (structural blocks) directly from a heterogeneous volume ensemble, and downstream application of SIREn blocks to query occupancy of features of interest using MAVEn. (B) Schematic overview of the SIREn algorithm. Illustrative heatmap depicting binarized volumes as rows within the depicted array, with each voxel determined to be occupied or unoccupied within a given volume based on a binarization threshold provided for each map. Voxels are queried for co-occupancy, and a graph is constructed with edges connecting voxels determined to be significantly co-occupied. Clustering and expansion of the graph (see Methods) produces the final SIREn-identified blocks (pink and yellow, right).
Figure 2.
Figure 2.. 3D-convolutional neural network (3D-CNN) enables accurate prediction of binarization thresholds at scale.
(A) Depiction of the 3D-CNN inputs (green box), model architecture (blue box – 3D-CNN; peach box - MLP), and outputs (red box). Gray arrows indicate information used to calculate the training loss from the fraction enclosed volume (FEV) at input (ti) or predicted (pi) binarization thresholds (see Methods). (B) Scatter plots comparing EMDB ground truth labels and 3D-CNN-predicted thresholds (top), or thresholds predicted by the 99th percentile of the data (bottom) for training (left), validation (middle), and test (right) sets. Slopes (m) and Pearson correlation coefficients (r2) are noted over each plot; the identity line is shown as a dashed black line on each plot. Exemplar maps EMD-29562 (Wang et al. 2023; blue) and EMD-25375 (Fry et al. 2022; green) (right) are shown at EMDB-deposited (top), 3D-CNN predicted (middle), and 99th percentile (bottom) binarization thresholds.
Figure 3.
Figure 3.. SIREn recapitulates ground truth compositional and conformational heterogeneity in simulated datasets.
(A) Atomic models (left) of the E. coli large ribosomal subunit (50S) with full (L2Δ1) or partial (L2Δ0, L2Δ0.25, L2Δ0.50, L2Δ0.75) deletion of uL2, with uL2 highlighted in various colors. A schematic overview (right) of the generated homogeneous and heterogeneous simulated particle stacks, titrating both the proportion of uL2 deleted and the fraction of particles with uL2 intact, is shown (right). Particle images are outlined with colors matching the 50S deletion model panel. (B) Heatmaps (top) depicting whether a uL2 block was detected by SIREn in each dataset. The detected uL2 blocks (bottom) are shown in purple for the four datasets containing 50% uL2-intact (L2Δ0) particles, and 50% particles bearing successively larger deletions of uL2 (L2Δ0.25 – L2Δ1). Blocks are overlaid on an exemplar density map from the ensemble (transparent surface). (C) Representative distributions of per-volume uL2 block occupancies in datasets with 25% (top) or 50% (bottom) uL2 intact, with the remainder of the particles having no uL2 (uL2Δ1). Dashed lines indicate the fit two-component Gaussian mixture model (GMM) used to distinguish low-occupancy particles (black) from high-occupancy particles (purple, see Methods). (D) Fraction of uL2-intact particles in each dataset where a uL2 block was detected, as determined by the GMM fitting approach (see Methods). Asterisks indicate the datasets highlighted in C. The ground truth frequency is shown as a horizontal dashed line in the barplots. (E) Workflow to analyze a simulated cryo-ET dataset of yeast ATP synthase, with atomic models traversing the simulated conformational change colored yellow-to-red (left), and locations of 500 maps sampled from latent space, projected using principal component analysis. Detected SIREn blocks are shown in shades of orange and red (middle). A representative map from the ensemble (translucent surface) with overlaid SIREn-detected block (orange) is shown to illustrate occupancy-querying approach with MAVEn. (F) Confusion matrix comparing the inferred class assignments and ground truth rotational state for each particle in the simulated particle stack (left). Reconstructed volumes corresponding to each class are shown (right). Volumes are colored to match blocks in E.
Figure 4:
Figure 4:. SIREn identifies variable features in real cryo-EM datasets.
(A) Blocks inferred by SIREn (right) from the EMPIAR-10076 dataset of assembling bacterial ribosomes (Davis et al. 2016), compared to blocks annotated (left) by a model-based approach in a previous analysis (Kinman et al. 2022) of this dataset. (B) Heatmap depicting occupancy of inferred blocks (columns of heatmap) in each of the 500 maps used as inputs to SIREn (rows of heatmap). Columns are colored to match (A). Rows were clustered to generate four major classes, from which density maps were generated (see Methods)and annotated following Davis et al. 2016. The arrow marks volumes with high occupancy for block 7, which corresponds to helix 68, but low occupancy for block 15, which corresponds to the central protuberance. (C) Results from querying the full particle stack for occupancy of block 5 (see Methods), depicted as a histogram. Dashed line indicates the threshold used to select particles for homogeneous refinement. Density map resulting from a refinement performed with SIREn-curated particles compared to the D4 assembly class map (right) reported by Davis et al. 2016. Dashed white line surrounds YjgA. (D) Results from querying the full particle stack for occupancy of block 10, depicted as a histogram (left) with dashed line indicating threshold used to select particles for homogeneous refinement. Density map resulting from refinement performed on SIREn-curated particles compared to the published C1 assembly class map (right) reported by Davis et al. 2016. (E) A density map depicting the joint distribution of block 10 (misdocked CP) and block 15 (properly docked CP) occupancies obtained by the ‘on-the-fly’ querying of the volume ensemble (see Methods).
Figure 5:
Figure 5:. SIREn uncovers heterogeneous features of cellular ribosomes in cryo-ET datasets.
(A) Blocks detected by SIREn in an ensemble of 500 ribosomes resolved by cryo-ET from M. pneumoniae cells (EMPIAR-10499). Insets compare the consensus reconstruction using all particles (CR) and particle subsets with either high or low occupancy of the noted block. Maps are colored to match the block used to filter the particle stack, and the location of variability is highlighted with a dashed line. The number of particles used for each reconstruction is listed in italics, and PDB model 7phb (Xue et al. 2022) is docked in the block 20 reconstruction (green). Particle occupancies determined by ‘on-the-fly’ querying (see Methods) are shown as cumulative density functions (CDF), and thresholds used to identify high-occupancy particles are noted with dashed lines (right). (B) Blocks identified by SIREn from a volume ensemble of ribosomes extracted at larger real-space box size. (C) Venn diagrams depicting total number of particles labeled as 5’ or 3’ disomes by SIREn (Supplemental Figure 4A, see Methods) and by published manual annotations (top). Reconstructions performed with SIREn-annotated 5’ and 3’ disome particles (right); number of particles used in each reconstruction listed. Distribution of nearest-neighbor distances in sets of particles annotated by different methods (SIREn, manual, or both; bottom). (D) Venn diagram comparing manual and SIREn annotations for membrane-bound ribosomes (top). Reconstructions performed using particles from manual (blue) and SIREn (yellow) annotations are shown (bottom). Numbers of particles used for each reconstruction listed. Membrane-annotated particles in a representative tomogram are shown (right). Segmented membrane density is shown in gray (see Methods), particles are colored as at left. (E) Cumulative density function plots of the per-particle occupancy of disome and membrane blocks (see Methods). Thresholds used for particle selection are shown as dashed lines.

Similar articles

References

    1. Baxter WT, Grassucci RA, Gao H, Frank J. 2009. Determination of signal-to-noise ratios and spectral SNRs in cryo-EM low-dose imaging of molecules. Journal of Structural Biology 166: 126–132. - PMC - PubMed
    1. Beckers M, Jakobi AJ, Sachse C. 2019. Thresholding of cryo-EM density maps by false discovery rate control. IUCrJ 6: 18–33. - PMC - PubMed
    1. Campello RJGB, Moulavi D, Zimek A, Sander J. 2015. Hierarchical Density Estimates for Data Clustering, Visualization, and Outlier Detection. ACM Transactions on Knowledge Discovery from Data (TKDD) 10.
    1. Chen M, Ludtke SJ. 2021. Deep learning-based mixed-dimensional Gaussian mixture model for characterizing variability in cryo-EM. Nature Methods 2021 18:8 18: 930–936. - PMC - PubMed
    1. Cordasco G, Gargano L. 2010. Community detection via semi-synchronous label propagation algorithms. 2010 IEEE International Workshop on Business Applications of Social Network Analysis, BASNA 2010.

Publication types

LinkOut - more resources