Effects of Alkalinity Stress on Amino Acid Metabolism Profiles and Oxidative-Stress-Mediated Apoptosis/Ferroptosis in Hybrid Sturgeon (Huso dauricus ♀ × Acipenser schrenckii ♂) Livers
- PMID: 39408786
- PMCID: PMC11476414
- DOI: 10.3390/ijms251910456
Effects of Alkalinity Stress on Amino Acid Metabolism Profiles and Oxidative-Stress-Mediated Apoptosis/Ferroptosis in Hybrid Sturgeon (Huso dauricus ♀ × Acipenser schrenckii ♂) Livers
Abstract
Alkaline water is toxic to cultured aquatic animals that frequently live in pH-neutral freshwater. Overfishing and habitat destruction have contributed to the decline in the wild sturgeon population; consequently, the domestic hybrid sturgeon has become an increasingly important commercial species in China. Hybrid sturgeons are widely cultured in alkaline water, but little is known about the effects of alkalinity stress on hybrid sturgeon liver tissues. We exposed hybrid sturgeons to four alkaline concentrations (3.14 ± 0.02 mmol/L, 7.57 ± 0.08 mmol/L, 11.78 ± 0.24 mmol/L and 15.46 ± 0.48 mmol/L). Histopathology, biochemical index assessment, gene expression level detection and metabolomics analysis were used to investigate the negative effects on liver functions following exposure to NaHCO3. Livers exposed to alkaline stress exhibited severe tissue injury and clear apoptotic characteristics. With increased exposure concentrations, the hepatic superoxide dismutase, catalase, glutathione peroxidase and alkaline phosphatase activities significantly decreased in a dose-dependent manner. NaHCO3 exposure up-regulated the transcriptional levels of apoptosis/ferroptosis-related genes in livers. Similarly, the expression trends of interleukin-1β and heat shock protein genes also increased in high-alkalinity environments. However, the expression levels of complement protein 3 significantly decreased (p < 0.05). Hepatic untargeted metabolomics revealed the alteration conditions of various metabolites associated with the antioxidant response, the ferroptosis process and amino acid metabolism (such as beta-alanine metabolism; alanine, aspartate and glutamate metabolism; and glycine, serine and threonine metabolism). These data provided evidence that NaHCO3 impaired immune functions and the integrity of hybrid sturgeon liver tissues by mediating oxidative-stress-mediated apoptosis and ferroptosis. Our results shed light on the breeding welfare of domestic hybrid sturgeons and promote the economic development of fisheries in China.
Keywords: alkalinity stress; amino acid metabolism; ferroptosis; fishery breeding; sturgeon.
Conflict of interest statement
None of the authors have any financial or personal relationships that could inappropriately influence or bias the content of the paper.
Figures


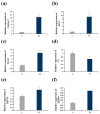
 represents the p-value decreasing from left to right. The Y-coordinate represents the pathway term. The X-coordinate represents the relative rich factors of each pathway.
Similar articles
-
Effects of Environmental Hypoxia on Serum Hematological and Biochemical Parameters, Hypoxia-Inducible Factor (hif) Gene Expression and HIF Pathway in Hybrid Sturgeon (Acipenser schrenckii ♂ × Acipenser baerii ♀).Genes (Basel). 2024 Jun 5;15(6):743. doi: 10.3390/genes15060743. Genes (Basel). 2024. PMID: 38927679 Free PMC article.
-
The complete mitochondrial genome of the hybrid sturgeon of Huso dauricus (♀) × Acipenser schrenckii (♂).Mitochondrial DNA B Resour. 2017 Jan 11;2(1):11-12. doi: 10.1080/23802359.2016.1275838. Mitochondrial DNA B Resour. 2017. PMID: 33473698 Free PMC article.
-
Effects of dietary green tea (Camellia sinensis L.) supplementation on growth performance, lipid metabolism, and antioxidant status in a sturgeon hybrid of Sterlet (Huso huso ♂ × Acipenser ruthenus ♀) fed oxidized fish oil.Fish Physiol Biochem. 2017 Oct;43(5):1315-1323. doi: 10.1007/s10695-017-0374-z. Epub 2017 May 10. Fish Physiol Biochem. 2017. PMID: 28488192 Clinical Trial.
-
Oxidative stress and cryoresistance of sturgeon sperm: A review.Cryobiology. 2023 Dec;113:104594. doi: 10.1016/j.cryobiol.2023.104594. Epub 2023 Oct 15. Cryobiology. 2023. PMID: 37848167 Review.
-
Metabolomics in sturgeon research: a mini-review.Fish Physiol Biochem. 2024 Aug;50(4):1895-1910. doi: 10.1007/s10695-024-01377-8. Epub 2024 Jul 9. Fish Physiol Biochem. 2024. PMID: 38980504 Free PMC article. Review.
References
-
- Meng X., Luo L., Zhao Z., Wang S., Zhang R., Guo K. Ginger polysaccharide alleviates the effects of acute exposure to carbonate in crucian carp (Carassius auratus) by regulating immunity, intestinal microbiota, and intestinal metabolism. Ecotoxicol. Environ. Saf. 2024;273:116127. doi: 10.1016/j.ecoenv.2024.116127. - DOI - PubMed
-
- Liu Y.X., Fang H., Lai Q.F., Liang L.Q. The current state and development strategy for China’s saline fisheries. Strateg. Study CAE. 2016;18:74–78.
MeSH terms
Substances
Grants and funding
LinkOut - more resources
Full Text Sources

