. 2024 Sep 27;13(19):1619.
doi: 10.3390/cells13191619.

Functional Analysis of Human GBA1 Missense Mutations in Drosophila: Insights into Gaucher Disease Pathogenesis and Phenotypic Consequences

Affiliations

Functional Analysis of Human GBA1 Missense Mutations in Drosophila: Insights into Gaucher Disease Pathogenesis and Phenotypic Consequences

Aparna Kuppuramalingam et al. Cells. .

Abstract

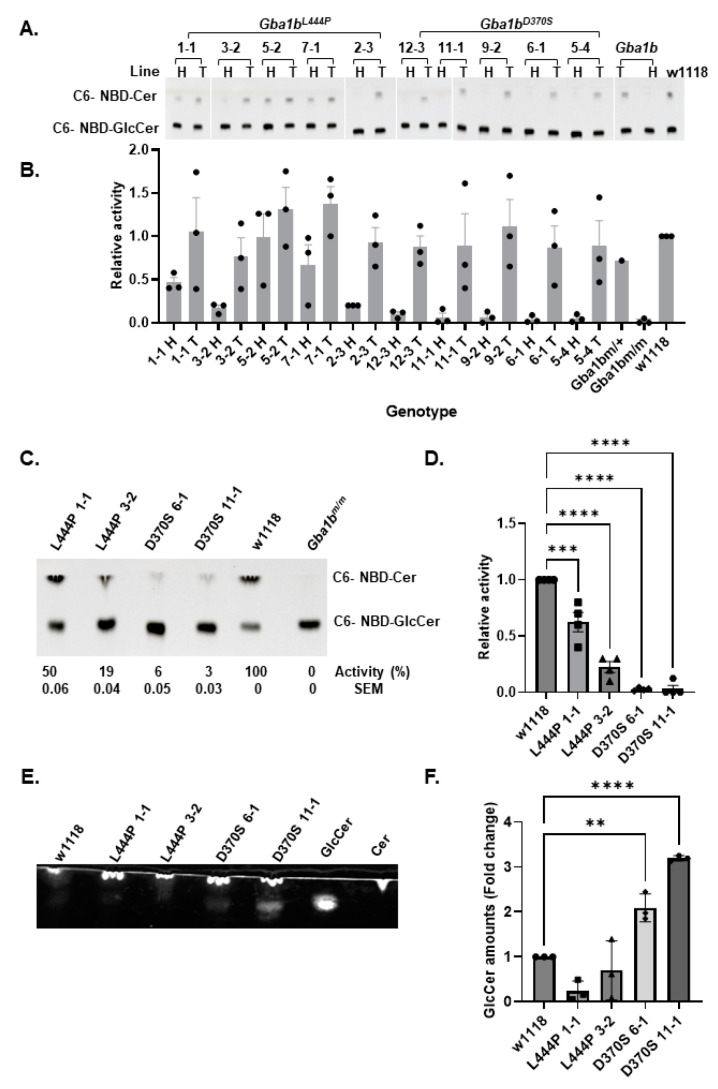
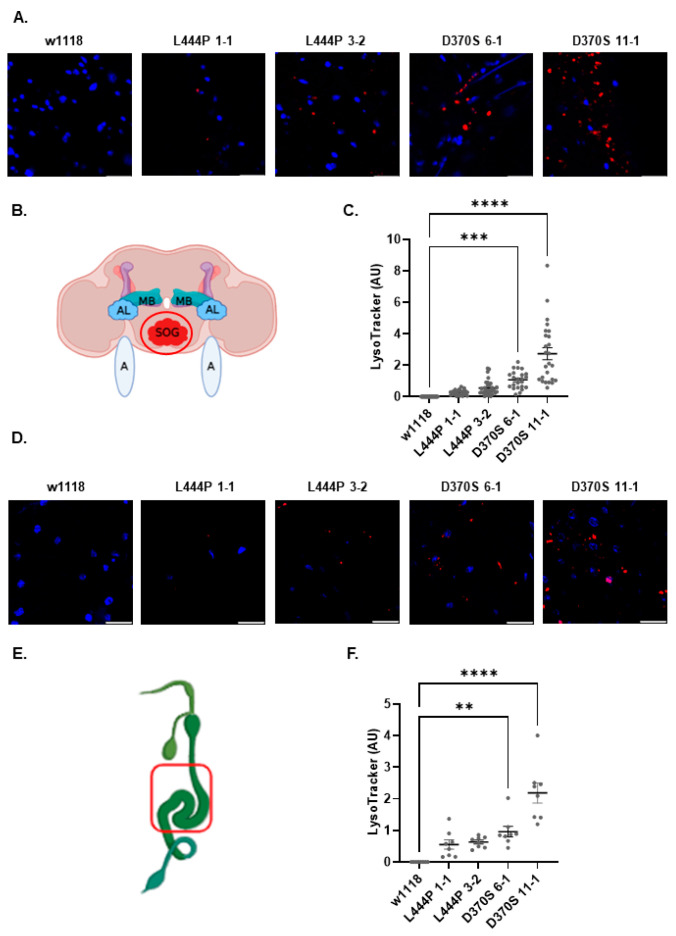
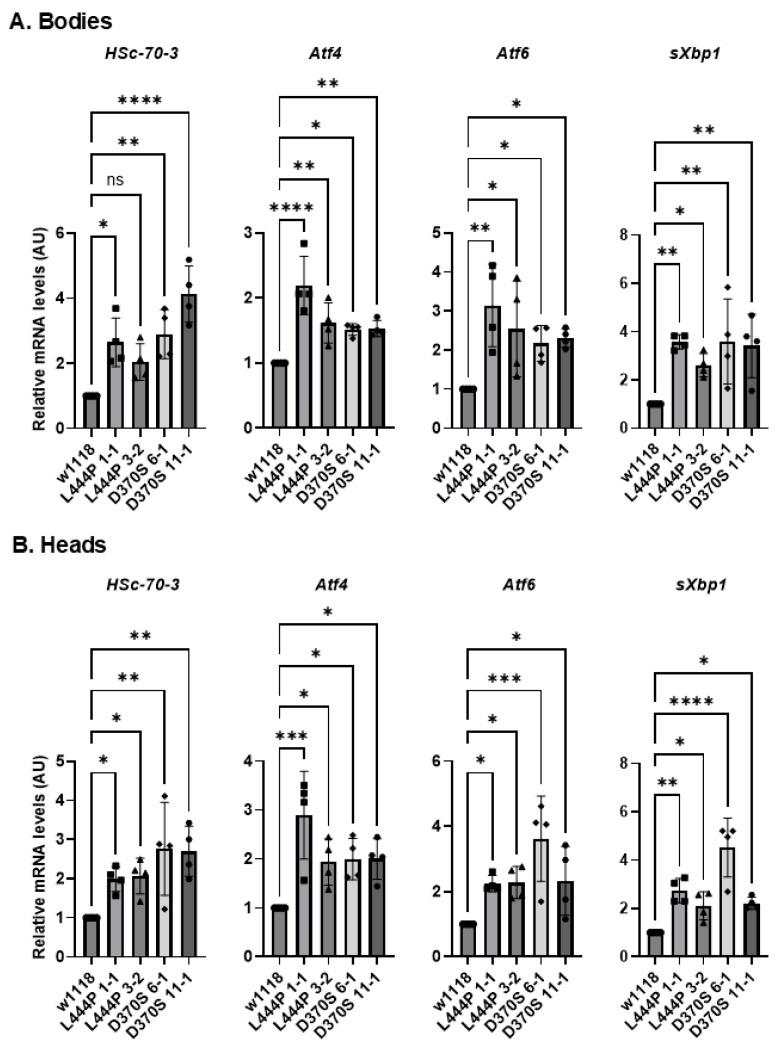
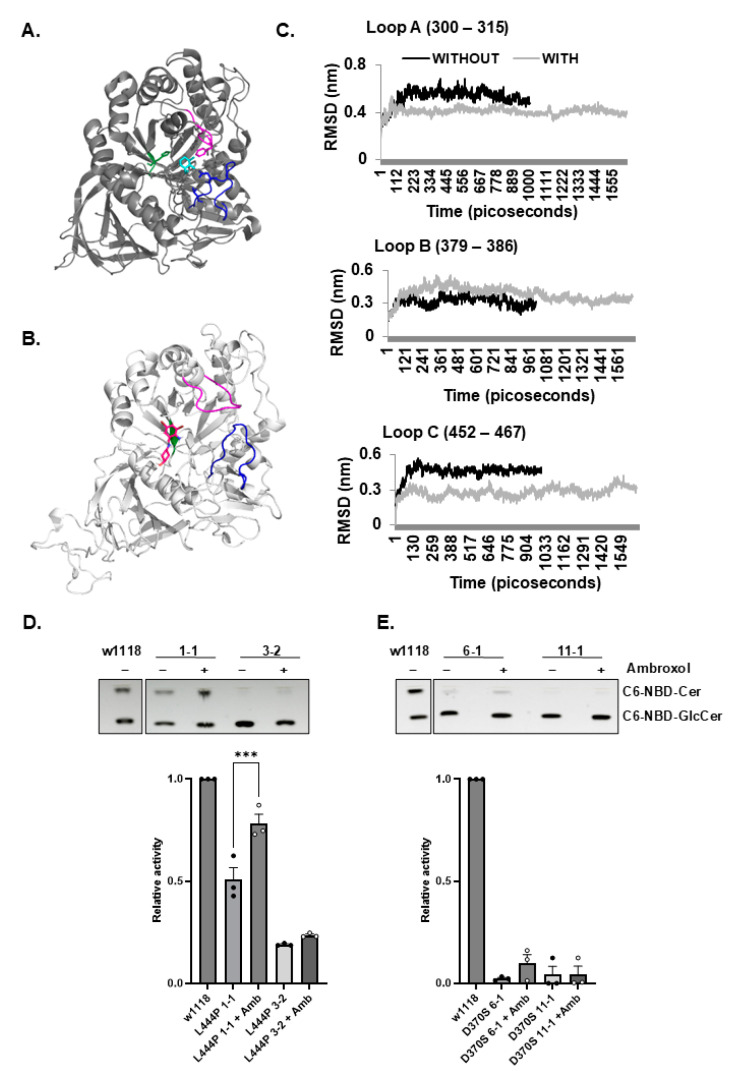
The human GBA1 gene encodes lysosomal acid β-glucocerebrosidase, whose activity is deficient in Gaucher disease (GD). In Drosophila, there are two GBA1 orthologs, Gba1a and Gba1b, and Gba1b is the bona fide GCase encoding gene. Several fly lines with different deletions in the Gba1b were studied in the past. However, since most GD-associated GBA1 mutations are point mutations, we created missense mutations homologous to the two most common GD mutations: the mild N370S mutation (D415S in Drosophila) and the severe L444P mutation (L494P in Drosophila), using the CRISPR-Cas9 technology. Flies homozygous for the D415S mutation (dubbed D370S hereafter) presented low GCase activity and substrate accumulation, which led to lysosomal defects, activation of the Unfolded Protein Response (UPR), inflammation/neuroinflammation, and neurodegeneration along with earlier death compared to control flies. Surprisingly, the L494P (called L444P hereafter) flies presented higher GCase activity with fewer lysosomal defects and milder disease in comparison to that presented by the D370S homozygous flies. Treatment with ambroxol had a limited effect on all homozygous fly lines tested. Overall, our results underscore the differences between the fly and human GCase enzymes, as evidenced by the distinct phenotypic outcomes of mutations in flies compared to those observed in human GD patients.

Keywords: Drosophila; GBA1; Gaucher disease; acid-β-glucocerebrosidase; ambroxol; glucosylceramide.


Conflict of interest statement

The authors declare no conflicts of interest.

Figures

Figure 1
Figure 1
Design of Drosophila Gba1bL444P and Gba1bD370S genes. (A). Multiple sequence alignment of GBA1 fragments from different organisms containing the two amino acids that were mutated in the present study. The N370 is highlighted in green, and the L444 is highlighted in yellow. (B). The original and the established nucleotide sequence of the mutated amino acids. Highlighted in red are the mutated nucleotides. (C). Shown in red is the exon localization of the mutated amino acids. (D). Comparison between Gba1b fragments containing either the mutant (M) or the normal (N) sequence based on non-lethal genotyping. Boxed in blue are the nucleotide changes introduced to obtain the D370S (D415S) mutation, and in red are the nucleotide changes introduced to obtain the L444P (L494P) mutation. (E). Schematic representation of the Gba1b region on chromosome 3 of the homozygous Gba1bD370S/D370S line generated. (F). Schematic representation of the Gba1b region on chromosome 3 of the homozygous Gba1bL444P/L444P line generated.
Figure 2
Figure 2
Decreased GCase activity and substrate accumulation in the mutant fly lines. (A). GCase activity was measured in 50 µg protein lysates prepared from 2-day-old Gba1bL444P/L444P, Gba1bD370/D370SS (homozygous—H) lines, and Gba1bD370/+, Gba1bL444P/+ (heterozygous—T) flies, as well as from Gba1bm/+ (T), Gba1bm/m (H), and w1118 lines, as detailed in the Methods section. The activity level of w1118 was considered 1. (B). The quantification of (A) is shown as the average ± standard error. (C). TLC analysis of GCase activity of the four selected homozygous lines (D370S-Gba1bD370/D370SS; L444P-Gba1bL444P/L444P). (D). The quantification of (C) is shown as the average ± standard error. One-way ANOVA was used to calculate the significance of the results. (E). TLC plate showing substrate accumulation in lipid extracts prepared from 22-day-old homozygous flies (D370S-Gba1bD370/D370SS; L444P-Gba1bL444P/L444P). (F). Quantification of results as shown in (E). The results are presented as average ± standard error. One-way ANOVA was used to calculate the significance of the results. ** p < 0.01, *** p < 0.001, **** p < 0.0001. SEM—standard error. Each dot denotes an independent experiment.
Figure 3
Figure 3
Lysosomal abnormalities in the homozygous mutant flies. (A). Confocal images of the suboesophageal ganglion region in the brains of control w1118, Gba1bL444P/L444P lines 1-1 and 3-2, and Gba1bD370S/D370S lines 6-1 and 11-1 flies, at 15 days post-eclosion. Red—LysoTracker, Blue—DAPI. (B). Graphical presentation of the Drosophila brain was created using BioRender. MB—mushroom body, AL—anntenal lobe, SOG—suboesophageal ganglion, A—anntena. The imaged region is circled in red. (C). Quantification of LysoTracker intensity in images like the one shown in (A). The results are presented as an average ± standard error for 25 different brains for each line. Significance was calculated using one-way ANOVA. (D). Confocal images of the gut region of w1118, Gba1bL444P/L444P lines 1-1 and 3-2, and Gba1bD370S/D370S lines 6-1 and 11-1 flies at 15 days post-eclosion. Red—LysoTracker, Blue—DAPI. (E). Graphical presentation of the Drosophila gut. The image was taken from BioRender, and the imaged region is boxed in red. (F). Quantification of LysoTracker intensity in images like the one shown in (D). The results are presented as an average ± standard error for 7 different guts for each line. Significance was calculated using one-way ANOVA. ** p < 0.01, *** p < 0.001, **** p < 0.0001. Each dot denotes an independent experiment.
Figure 4
Figure 4
ERAD of the mutant Gba1b variants. (A). A total of 60 µg of protein lysates, prepared from 2-day-old flies expressing the WT-Gba1b (UAS-WT Gba1b), D370S (UAS-D370S), and L444P (UAS-L444P) mutants under the Da-GAL4 driver, were electrophoresed through SDS-PAGE and the corresponding blots were interacted with anti-myc antibody to visualize the GCase proteins and with anti-actin antibody, as a loading control. (B). Quantification of results as presented in (A). The results are presented as average ± standard error. One-way ANOVA was used to determine the statistical significance of the results. (C). Protein lysates (60 µg), prepared from 22-day-old mutant flies described in (A), were processed as specified in (A). (D). Quantification of results as presented in (C). The results are presented as average ± standard error. Analysis was performed as explained in (B). (E). Protein lysates (60 µg), prepared as in (A) and treated with endo-H were subjected to electrophoresis and blotting as in (C). The blots interacted with anti-myc antibody to visualize the GCase proteins and with anti-actin antibody as a loading control. * p < 0.05, ** p < 0.01. Each dot denotes an independent experiment.
Figure 5
Figure 5
UPR activation in the mutant flies. (A). mRNA levels of UPR markers: HSc-70-3, Atf4, Atf6, and sXbp1 were tested in the bodies (A) and heads (B) of 22-day-old homozygous Gba1bL444P/L444P fly lines 3-2 and 1-1 and homozygous Gba1bD370S/D370S fly lines 6-1 and 11-1. The results are presented as average ± standard error. Each dot represents a triplicate of an independent experiment. One-way ANOVA was used to determine the statistical significance of the results. * p < 0.05, ** p < 0.01, *** p < 0.001, **** p < 0.0001, ns—non-significant. Each dot denotes an independent experiment.
Figure 6
Figure 6
Inflammation and neuroinflammation in the mutant flies. (A). The inflammatory pathways in Drosophila (created with BioRender). (B). mRNA levels of inflammatory markers: AttC, Cec, Drs, and Mtk were tested in the bodies (B) and heads (C) of 22-day-old Gba1bL444P/L444P fly lines 3-2 and 1-1 and Gba1bD370S/D370S lines 6-1 and 11-1. The results are presented as average ± standard error. One-way ANOVA was used to determine the statistical significance of the results. * p < 0.05, ** p < 0.01, *** p < 0.001, **** p < 0.0001. Each dot denotes an independent experiment.
Figure 7
Figure 7
Neuropathology and survival of the mutant flies. (A). Thirty flies from Gba1bL444P/L444P lines 3-2 and 1-1 and Gba1bD370S/D370S lines 6-1 and 11-1 were tested for their locomotion abilities at 2, 12, and 22 days post-eclosion. Results are presented as average ± standard error. Two-way ANOVA was used to determine the statistical significance of the results. (B) Kaplan–Meier curve presenting the survival of 100 control (w1118), homozygous Gba1bL444P lines 3-2 and 1-1, and Gba1bD370S/D370S lines 6-1 and 11-1 flies. Below is a table showing the significance measured by Kaplan–Meier’s multiple comparisons. * p < 0.05, ** p < 0.01. Each dot denotes an independent experiment.
Figure 8
Figure 8
Molecular dynamic simulation of Gba1b-encoded GCase with ambroxol. (A). X-ray structure of human WT GCase with ambroxol (depicted in cyan) (based on Figure 7B from JBC 2009 [21]). The loops that are stabilized upon formation of ambroxol–GCase complex are pink (loop A), green (loop B), and blue (loop C). (B). The predicted Gba1b WT model with ambroxol (16 ns stimulation). Ambroxol is painted in dark pink. Loops A, B, and C are colored as in (B). (C). RMSD stimulation of Gba1b GCase with (16 nanoseconds) and without (10 nanoseconds) ambroxol. Each graph shows the RMSD status of a different loop in the Gba1b-encoded GCase. Loops A and C are stabilized upon ambroxol binding. (D). GCase activity of homozygous Gba1bL444P/L444P flies (lines 1-1 and 3-2), grown for 22 days with and without ambroxol. GCase activity level of w1118 was considered 1. Results are presented as the average ± standard error. One-way ANOVA was used to calculate the statistical significance. (E). GCase activity of the homozygous Gba1bD370S/D370S flies (lines 6-1 and 11-1), grown for 22 days with and without ambroxol. Activity levels of w1118 with ambroxol were considered 1. Results are represented as the average ± standard error. One-way ANOVA was used to calculate the statistical significance. *** p < 0.005. Each dot denotes an independent experiment.
Figure 9
Figure 9
Change in UPR parameters upon ambroxol treatment. (A). mRNA levels of UPR markers: HSc-70-3, Atf4, Atf6, and sXbp1 were tested in the bodies (A) and heads (B) of Gba1bL444P/L444P lines 3-2 and 1-1 and Gba1bD370S/D370S lines 6-1 and 11-1 flies that were grown for 22 days with and without ambroxol. The results are presented as average ± standard error. Relative mRNA expression level was calculated using the 2−ΔΔCT method. Two-way ANOVA was used to calculate the statistical significance. * p < 0.05, ** p < 0.01, *** p < 0.001, **** p < 0.0001. Each dot denotes an independent experiment.
Figure 10
Figure 10
Effect of ambroxol on inflammation/neuroinflammation. (A). mRNA levels of inflammatory markers: AttC, Cec, Drs, and Mtk were tested in the bodies (A) and heads (B) of homozygous Gba1bL444P/L444P lines 3-2 and 1-1 and Gba1bD370S/D370S 6-1 and 11-1 flies that were grown for 22 days with and without ambroxol. The results are presented as average ± standard error. Relative mRNA expression level was calculated using the 2−ΔΔCT method. Two-way ANOVA was used to calculate the statistical significance. * p < 0.05, ** p < 0.01, *** p < 0.001, **** p < 0.0001. Each dot denotes an independent experiment.

Similar articles

References

    1. Brady R.O., Kanfer J.N., Shapiro D. Metabolism of glucocerebrosides II. Evidence of an enzymatic deficiency in Gaucher’s disease. Biochem. Biophys. Res. Commun. 1965;18:221–225. doi: 10.1016/0006-291X(65)90743-6. - DOI - PubMed
    1. Nilsson O., Svennerholm L. Accumulation of Glucosylceramide and Glucosylsphingosine (Psychosine) in Cerebrum and Cerebellum in Infantile and Juvenile Gaucher Disease. J. Neurochem. 1982;39:709–718. doi: 10.1111/j.1471-4159.1982.tb07950.x. - DOI - PubMed
    1. Raghavan S.S., Mumford R.A., Kanfer J.N. Deficiency of glucosylsphingosine: -Glucosidase in Gaucher disease. Biochem. Biophys. Res. Commun. 1973;54:256–263. doi: 10.1016/0006-291X(73)90916-9. - DOI - PubMed
    1. Orvisky E., Sidransky E., McKinney C.E., LaMarca M.E., Samimi R., Krasnewich D., Martin B.M., Ginns E.I. Glucosylsphingosine Accumulation in Mice and Patients with Type 2 Gaucher Disease Begins Early in Gestation. Pediatr. Res. 2000;48:233–237. doi: 10.1203/00006450-200008000-00018. - DOI - PubMed
    1. Dekker N., van Dussen L., Hollak C.E.M., Overkleeft H., Scheij S., Ghauharali K., van Breemen M.J., Ferraz M.J., Groener J.E.M., Maas M., et al. Elevated plasma glucosylsphingosine in Gaucher disease: Relation to phenotype, storage cell markers, and therapeutic response. Blood. 2011;118:e118–e127. doi: 10.1182/blood-2011-05-352971. - DOI - PMC - PubMed

Publication types

LinkOut - more resources