. 2024 Oct 11;386(6718):217-224.
doi: 10.1126/science.adq1456. Epub 2024 Oct 10.

Somatic mosaicism in schizophrenia brains reveals prenatal mutational processes

Affiliations

Somatic mosaicism in schizophrenia brains reveals prenatal mutational processes

Eduardo A Maury et al. Science. .

Abstract

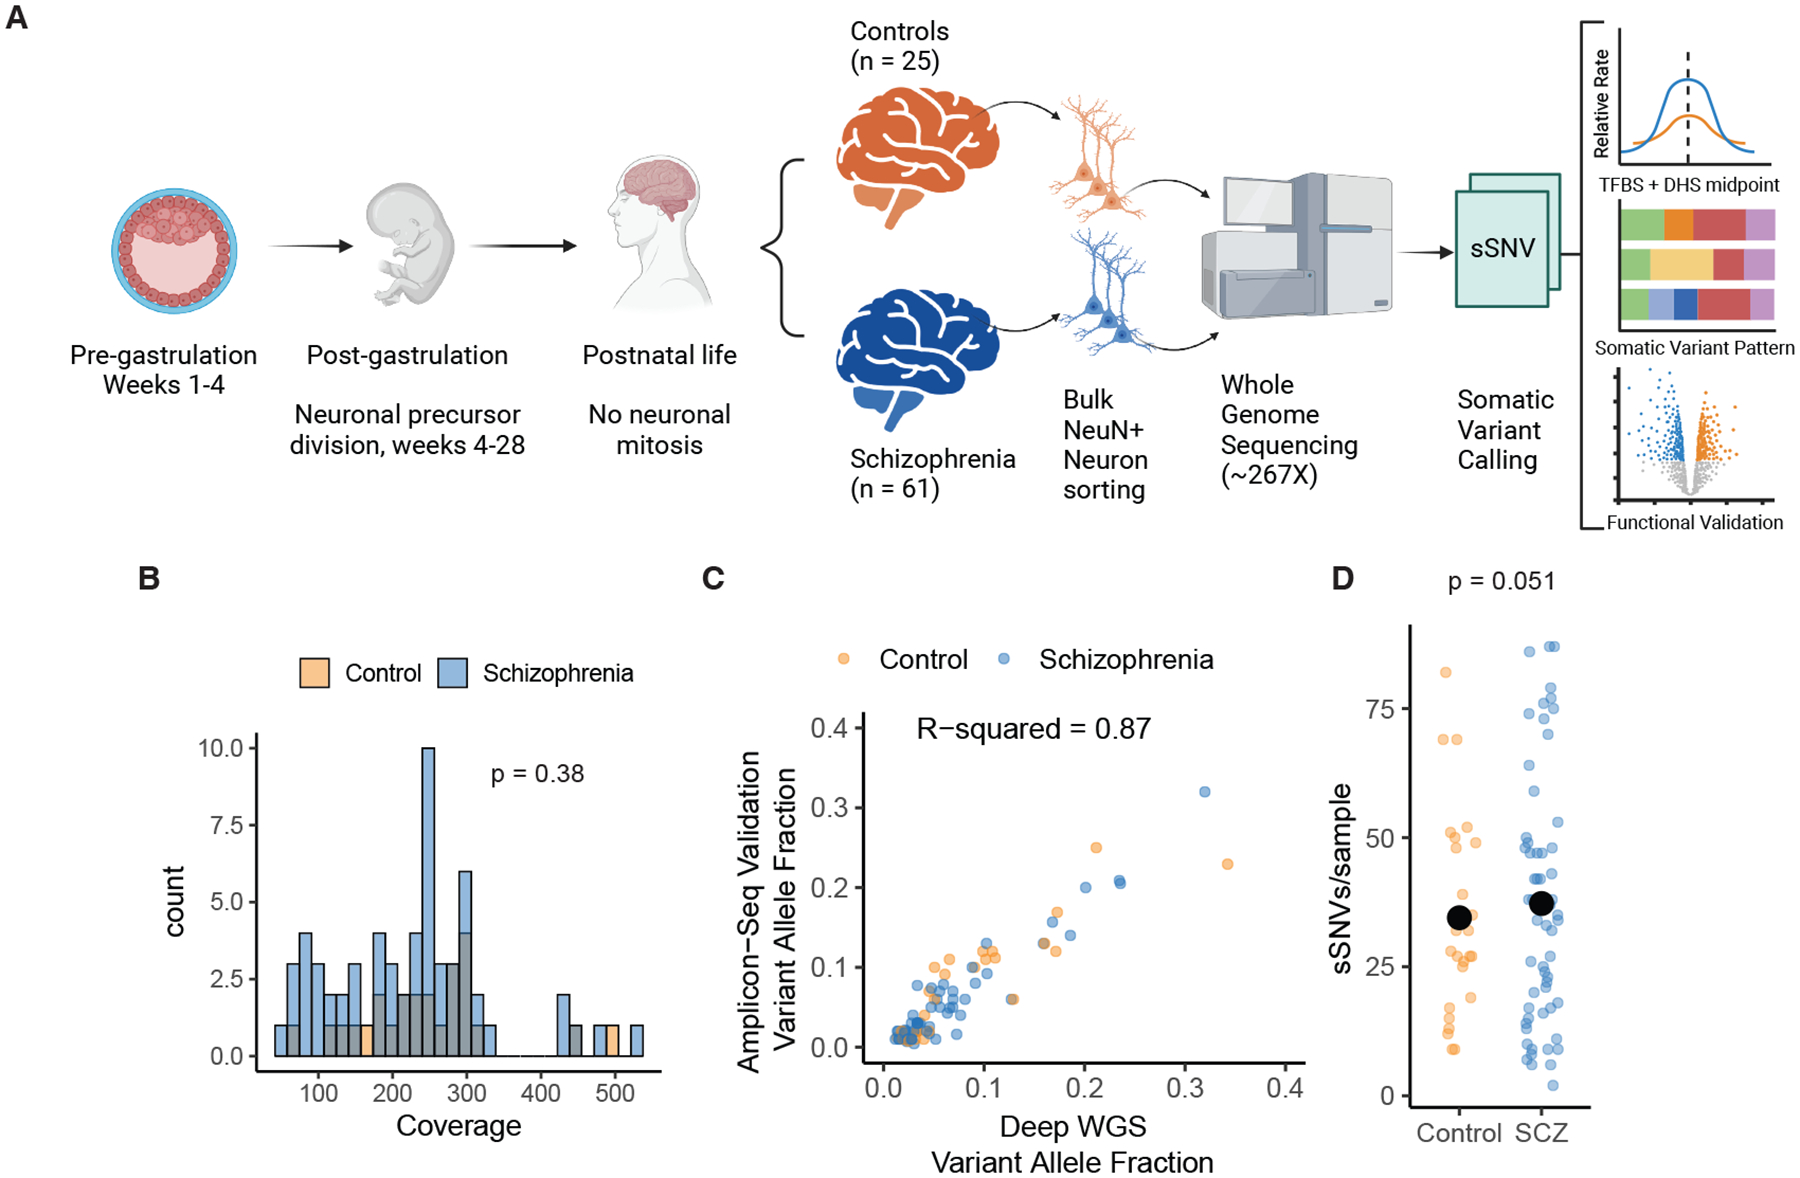
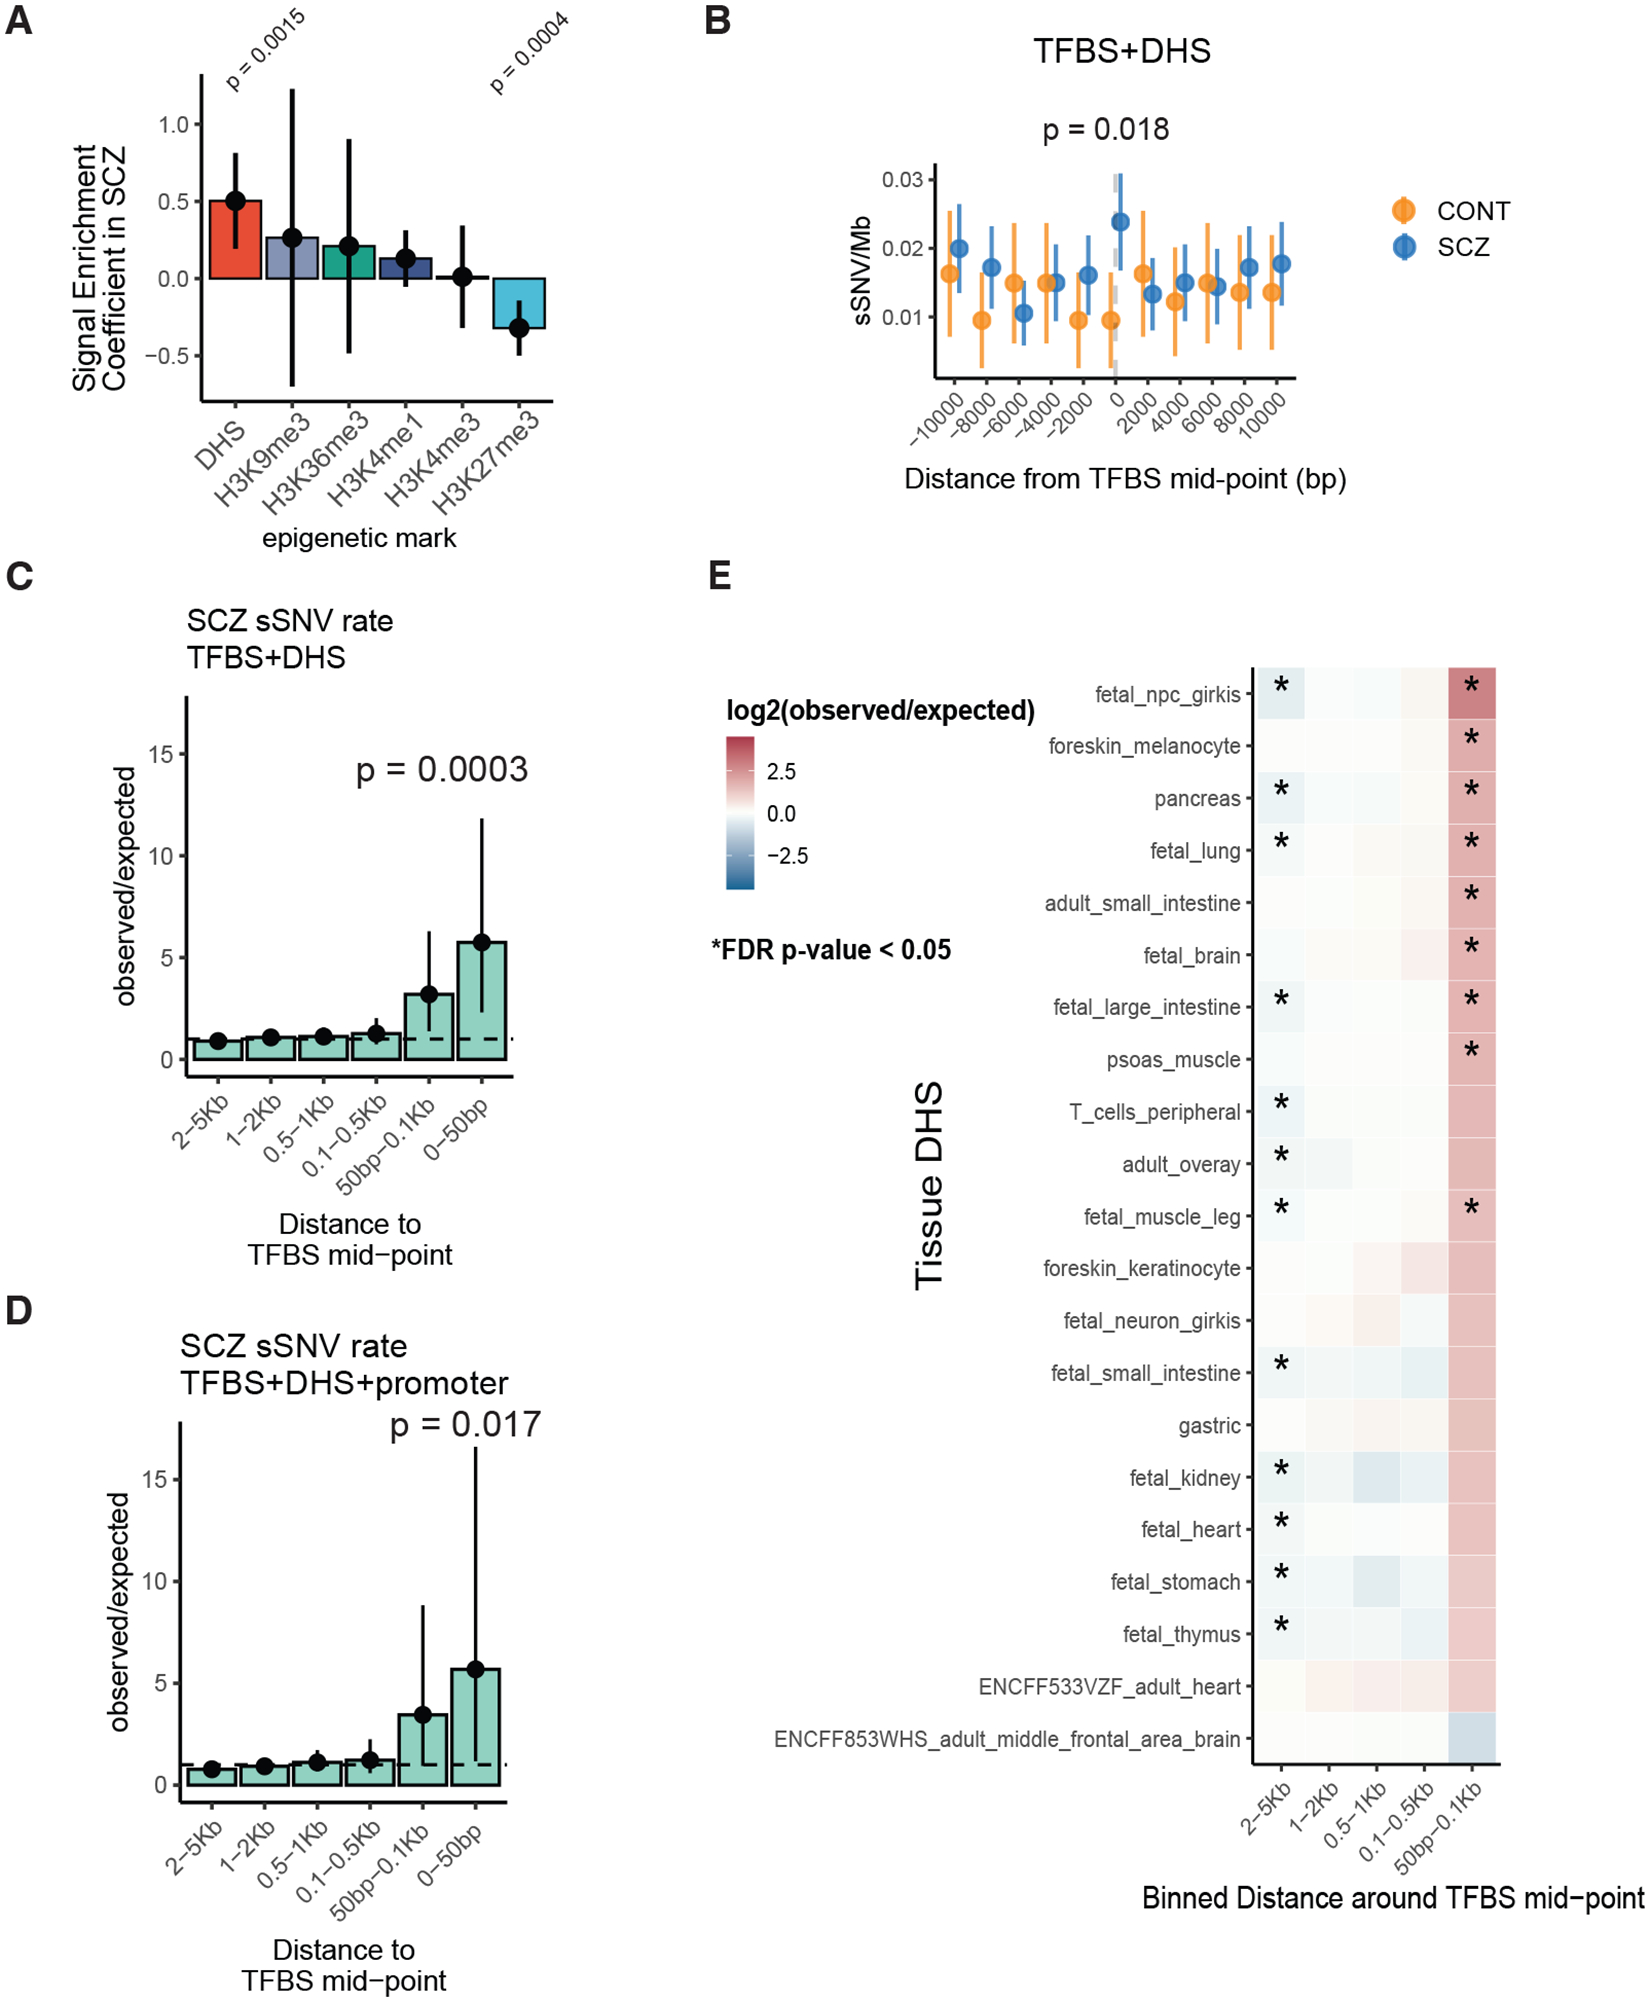
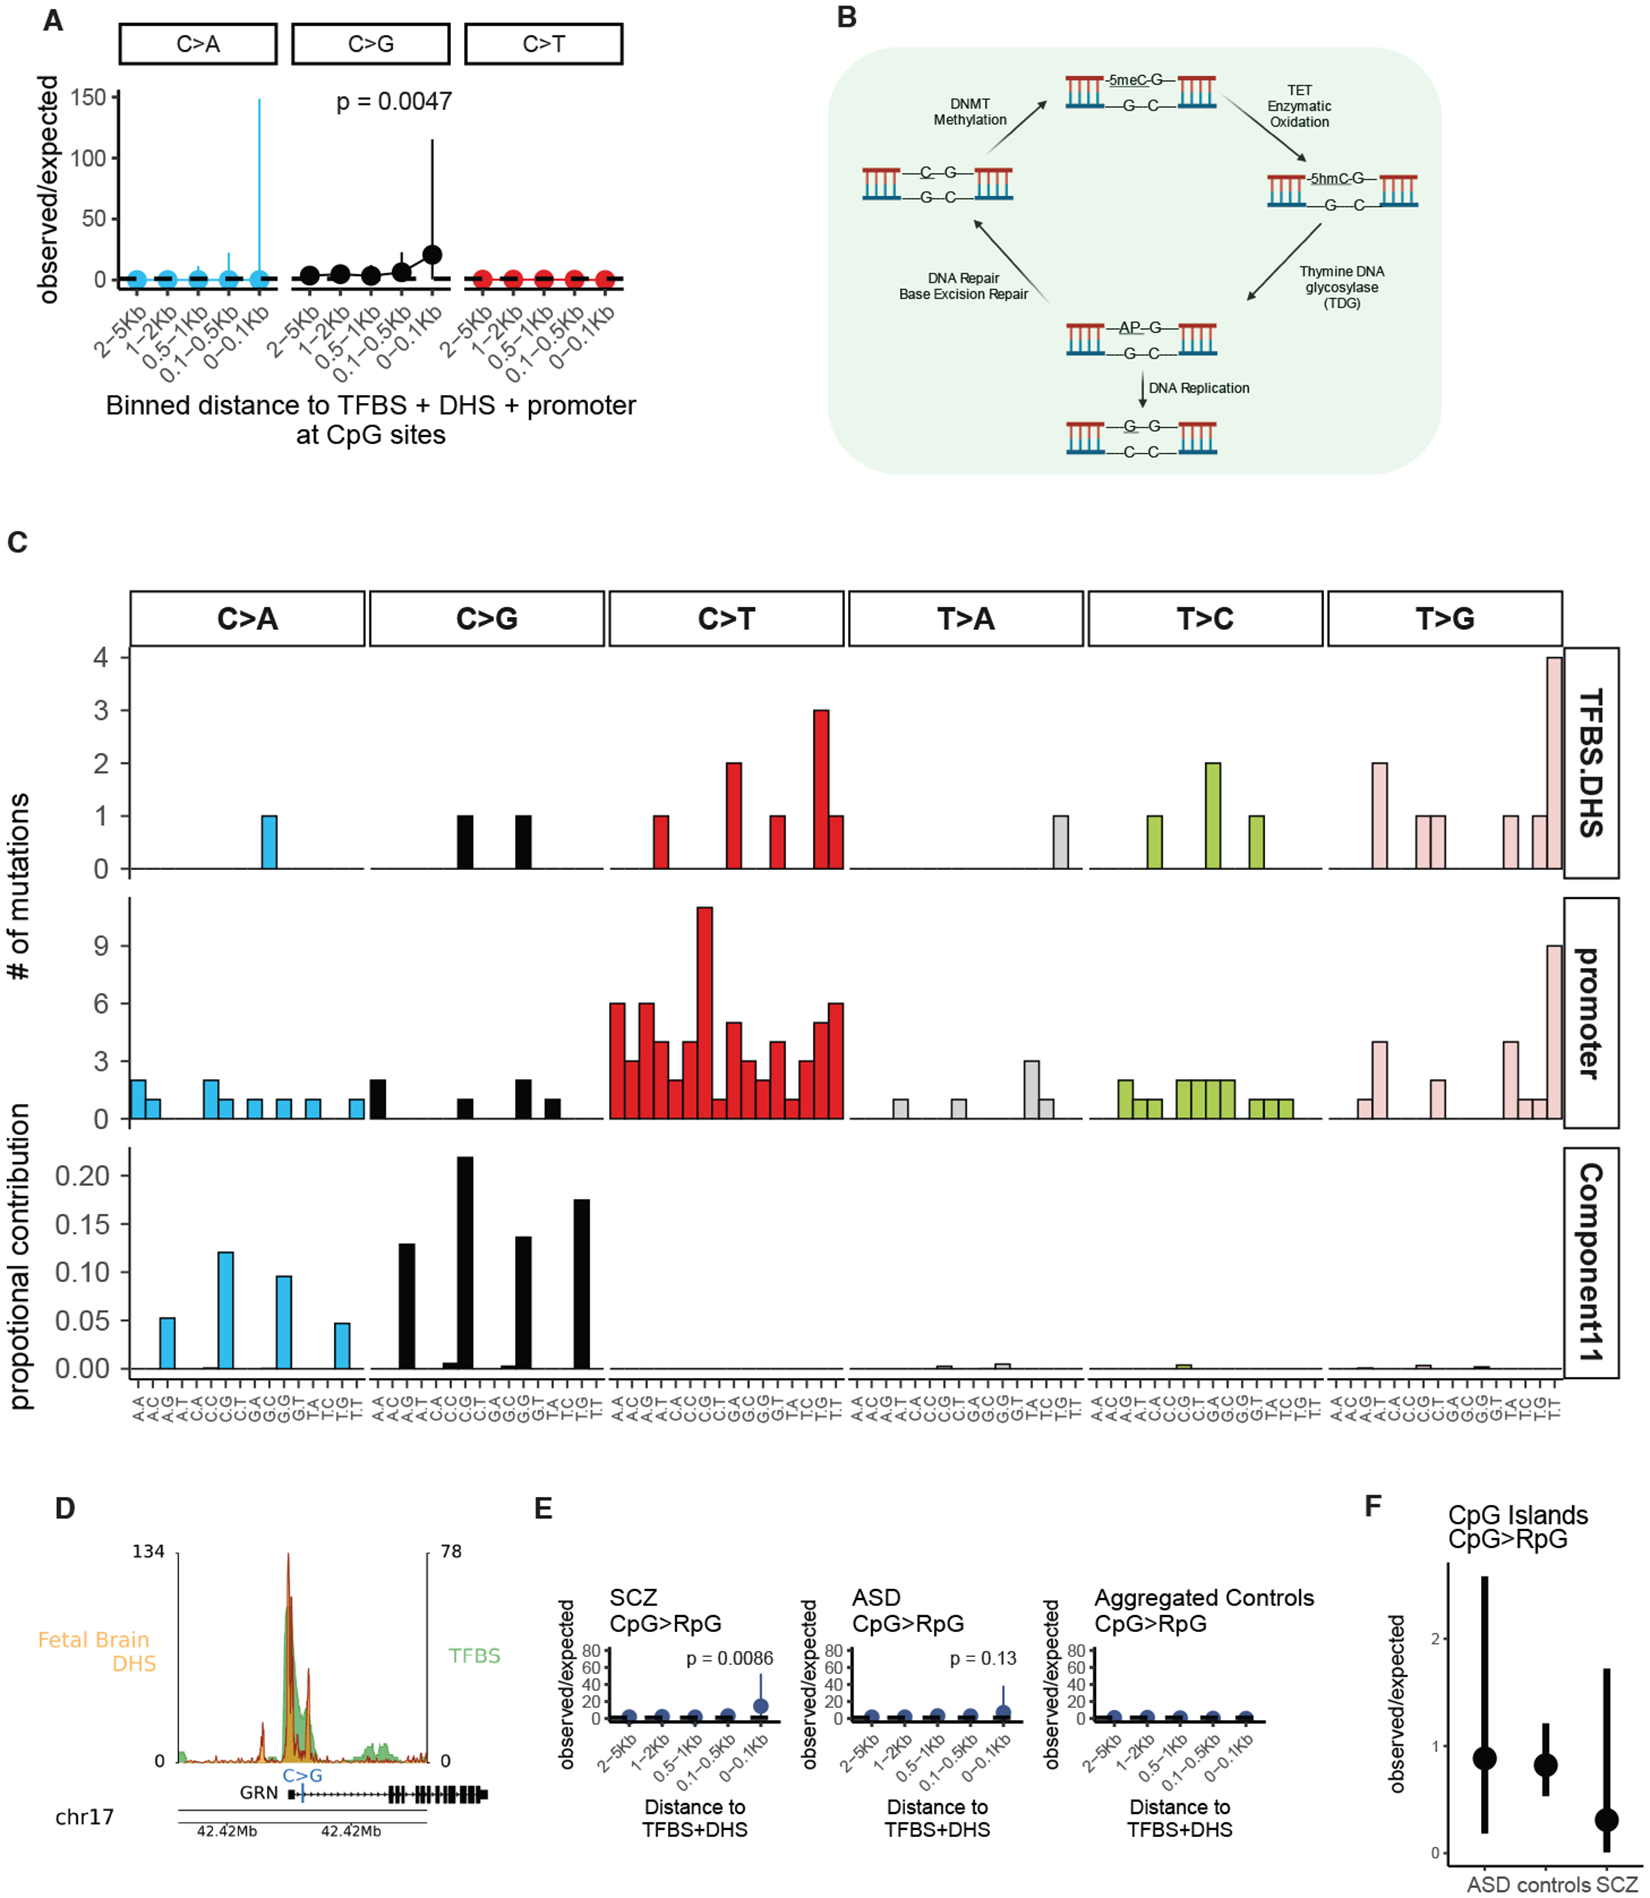
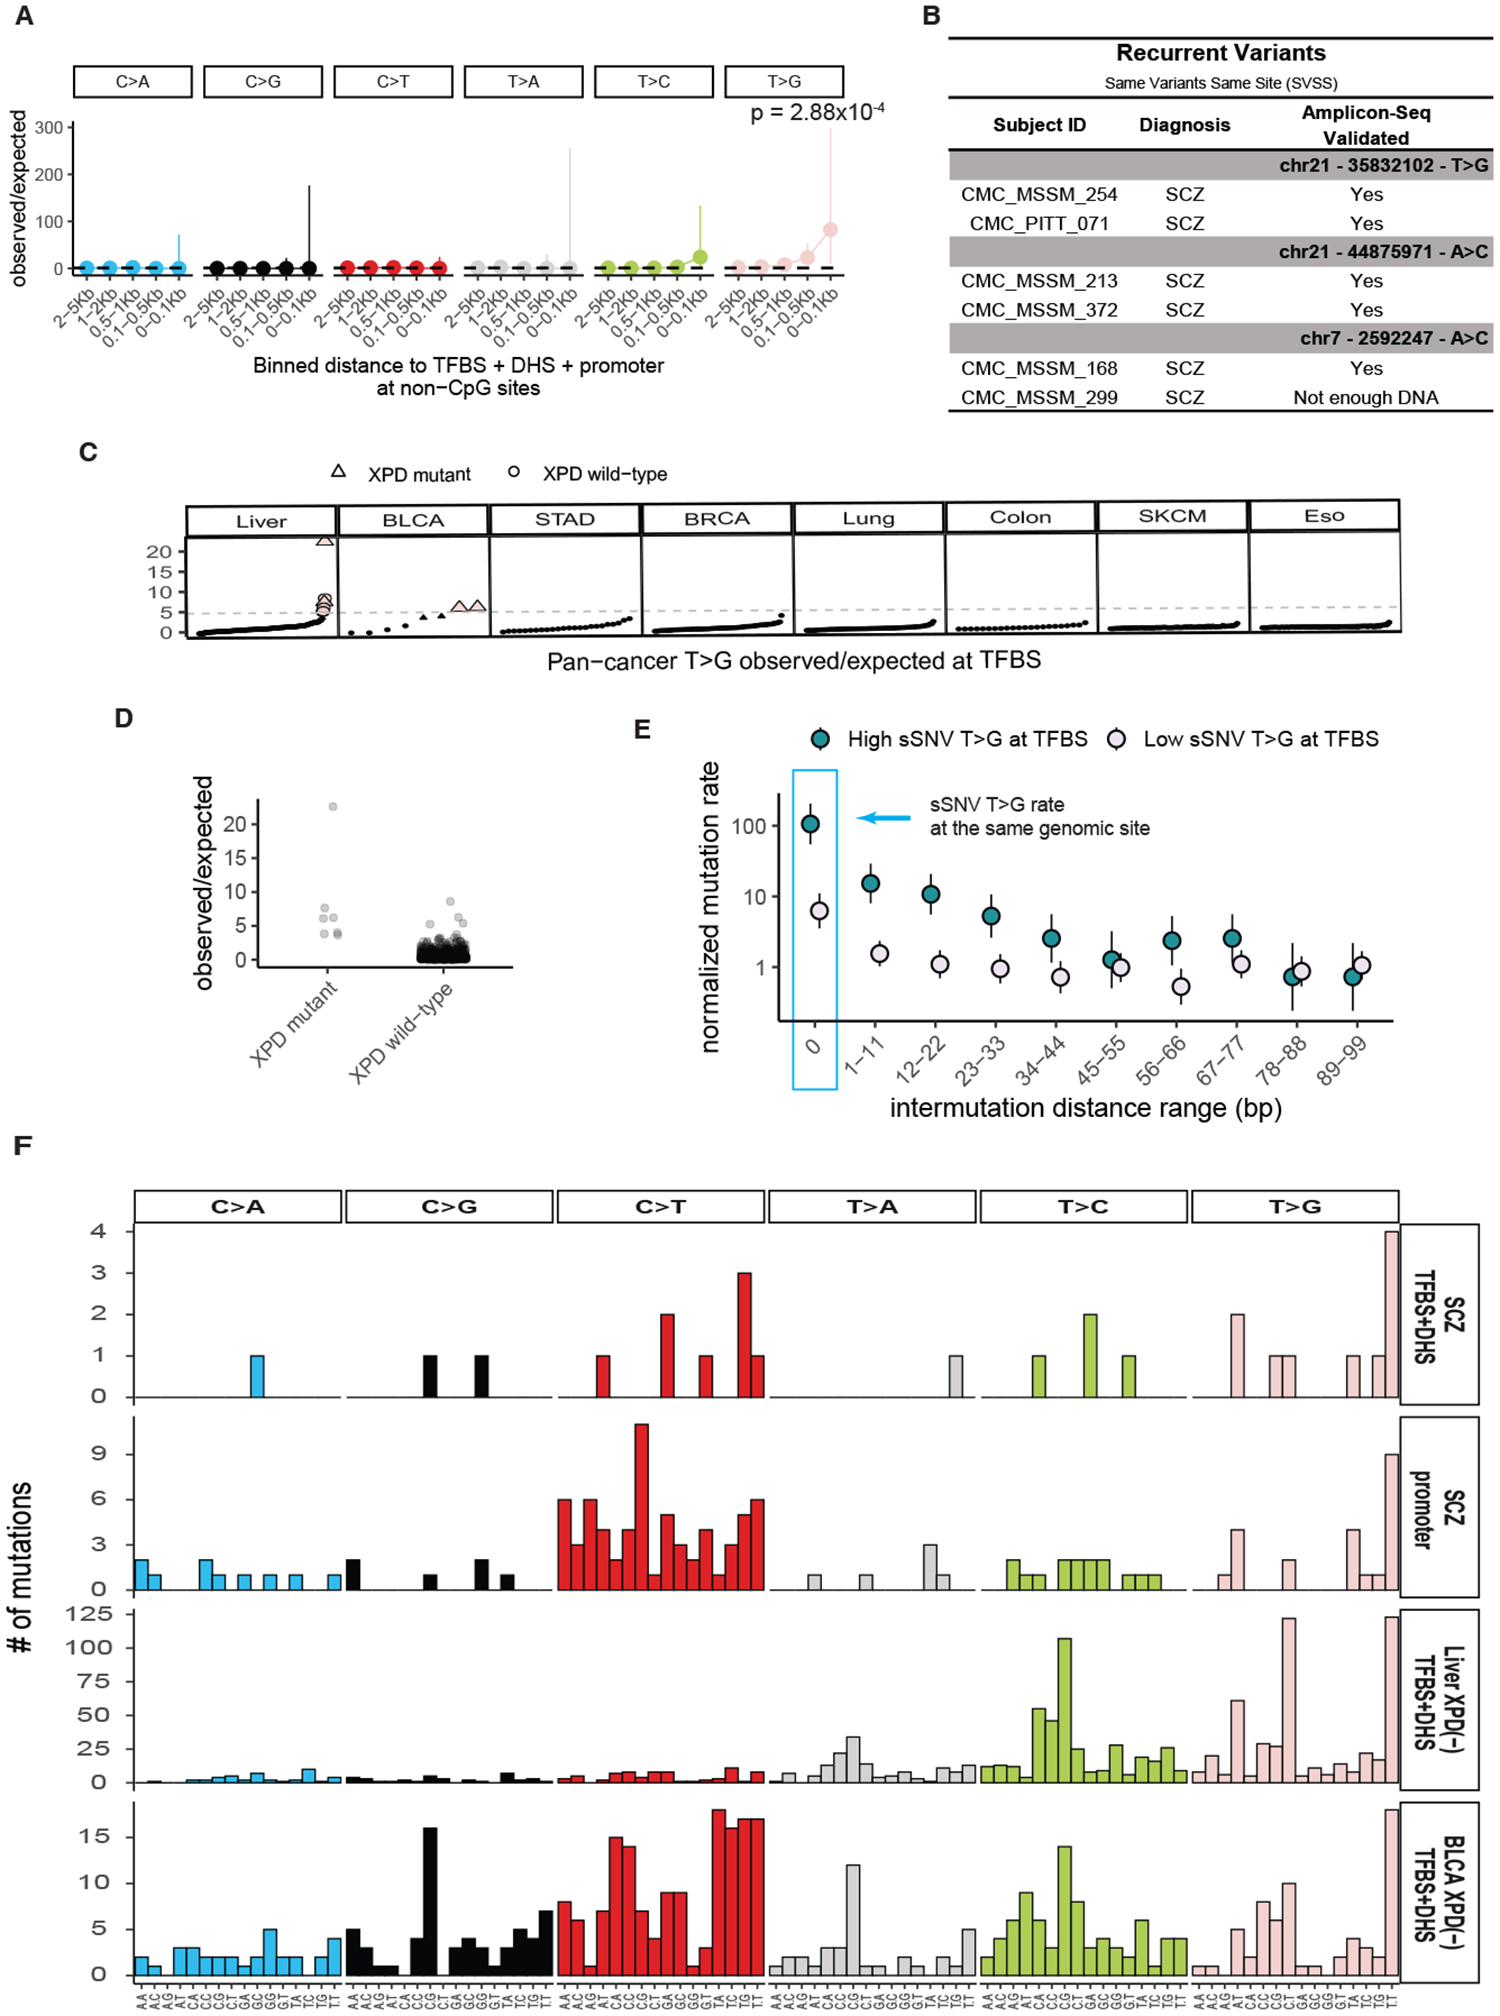
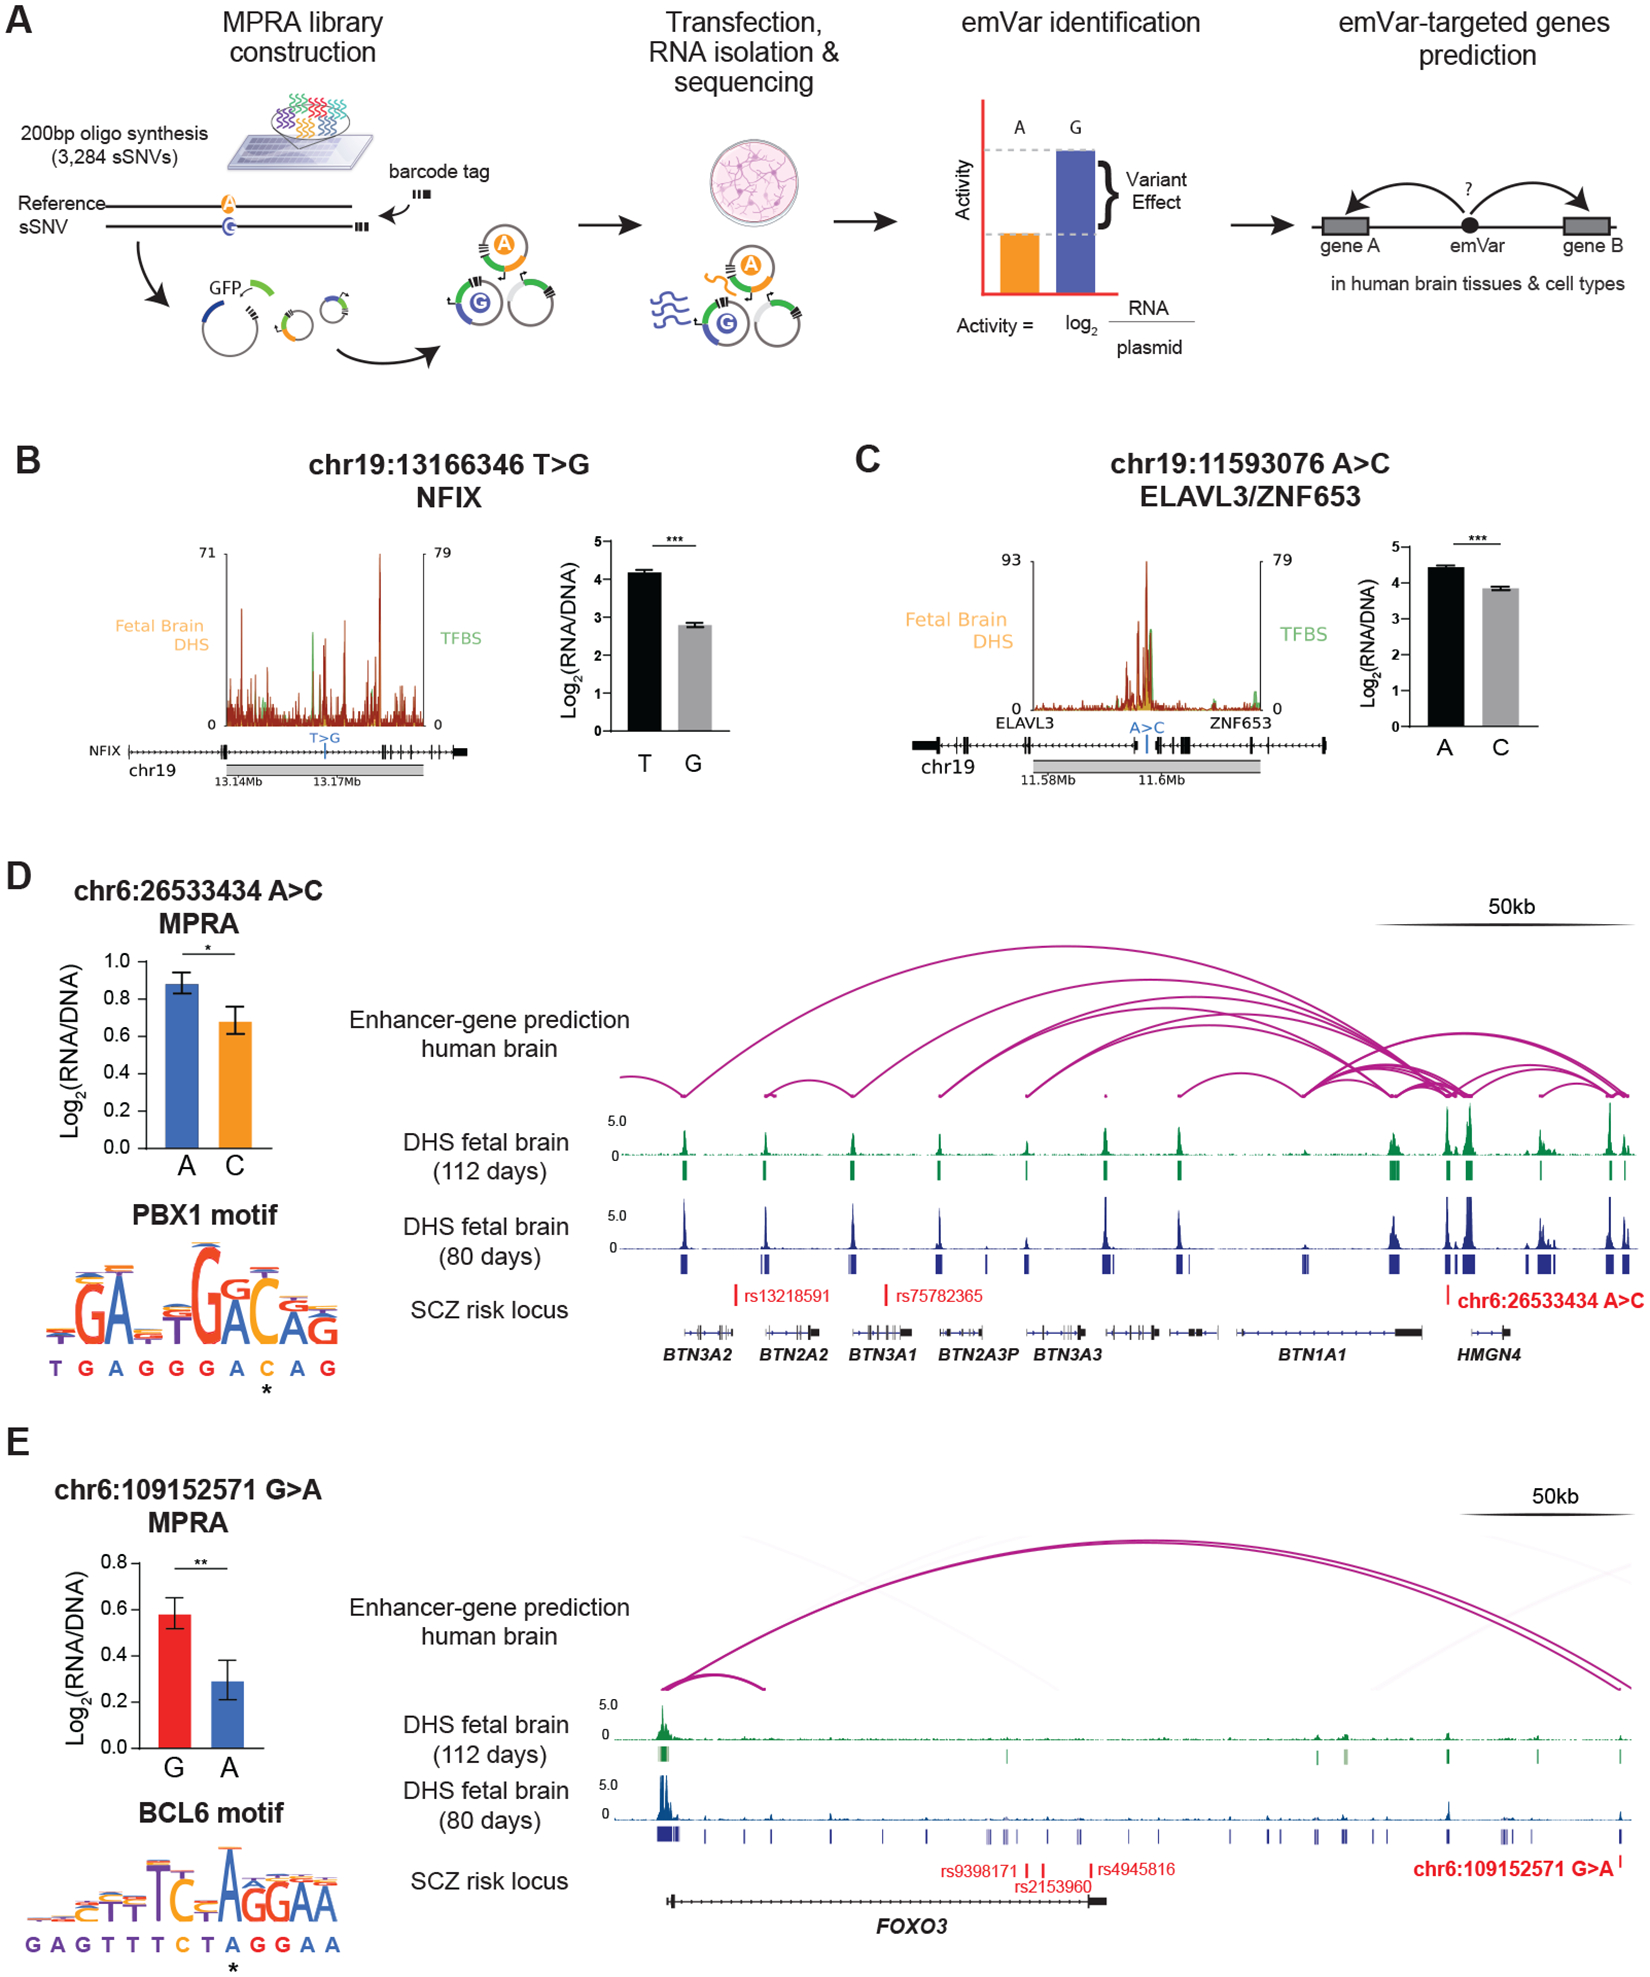
Germline mutations modulate the risk of developing schizophrenia (SCZ). Much less is known about the role of mosaic somatic mutations in the context of SCZ. Deep (239×) whole-genome sequencing (WGS) of brain neurons from 61 SCZ cases and 25 controls postmortem identified mutations occurring during prenatal neurogenesis. SCZ cases showed increased somatic variants in open chromatin, with increased mosaic CpG transversions (CpG>GpG) and T>G mutations at transcription factor binding sites (TFBSs) overlapping open chromatin, a result not seen in controls. Some of these variants alter gene expression, including SCZ risk genes and genes involved in neurodevelopment. Although these mutational processes can reflect a difference in factors indirectly involved in disease, increased somatic mutations at developmental TFBSs could also potentially contribute to SCZ.


Conflict of interest statement

Competing interests:. C.A.W. a consultant for Maze Therapeutics (Equity), Regeneron Pharmaceuticals (Cash), Bristol-Myers Squibb (Cash) and Flagship Ventures (Cash), none of which relate to this work.

Figures

Fig. 1.
Fig. 1.. Experimental design and orthogonal validation.
A) Schematic of experimental and analysis design. Notably, neuronal clonal somatic mutations that are shared across neurons originate during prenatal brain development; occurring either before organogenesis (pre-gastrulation) or during neuronal proliferation during neurogenesis, resulting in somatic variants present in cells across multiple tissues. Mutations occurring postnatally in neurons are not clonal and hence undetectable with this method. B) Histogram of average sequencing coverage for schizophrenia cases and control samples. C) Scatter plot of Deep WGS variant allele fraction (VAF) for variant submitted for validation and the VAF from the validation amplicon sequencing from SCZ and controls samples. R-squared value was computed from ordinary linear regression model. D) Scatter plot of number of sSNV per sample for schizophrenia cases and control after removal of an outlier SCZ case with 188 sSNVs. Large black points represent the sample medians. The p-value was calculated using permutation based negative binomial step-regression (see Methods).
Fig. 2.
Fig. 2.. Increased sSNV rate at developmentally active transcription factor binding sites (TFBS in SCZ.
A) Bar plot of binomial regression interaction term between epigenomic tracks and disease status. Positive values indicate enrichment in SCZ and negative values indicate depletion. Line ranges indicate 95% confidence intervals from binomial regression. B) Somatic SNV rate at +/− 10Kb region from active TFBS in fetal brain (TFBS+DHS) in SCZ and controls. C, D) Bar plot of observed over expected mutation rate at binned regions around TFBS in SCZ. E) Heatmap of rate ratios in SCZ at TFBS using different DHS tracks. For B, C, D, and E p-values and confidence intervals were calculated using Poisson tests. For E, stars indicate statistical significance at the FDR adjusted p < 0.05 level.
Fig. 3.
Fig. 3.. Increased somatic CpG transversions at active transcription factor binding sites in SCZ.
A) Forest plots of rate ratios in SCZ of different base changes in active TFBS at CpG sites. B) Trinucleotide context plot of sSNV in schizophrenia at active TFBS and promoter sites, and CpG transversion signature Component 11(24). C) Schematic of enzymatic demethylation mechanism resulting in CpG transversions. Abbreviations: 5meC, 5-methyl-cytosine; 5hmc, 5-hydroxymethyl-cytosine; AP abasic site. D) Illustration of promoter CpG>GpG mutation of GRN gene with DHS and TFBS tracks. E) Forest plots of observed vs expected CpG transversions at active TFBS in promoter regions from schizophrenia, autism spectrum disorder, and aggregated control. F) Forest plot of the relative observed vs expected CpG transversions at CpG islands across diagnostic categories. For panels A, E, and F, p-values and 95% confidence intervals were computed using a Poisson test.
Fig. 4.
Fig. 4.. Increased somatic T>G substitutions at active TFBS in SCZ and cancer samples.
A) Forest plots of rate ratios in SCZ of different base changes in active TFBS at promoter regions at non-CpG sites. P-values and 95% confidence intervals were computed using a Poisson test. B) List of T>G variants occurring at the same genomic position. C) T>G sSNV observed vs. expected mutation rate at TFBS across various cancer types. Samples on the x-axis are sorted based on observed/expected ratios for each cancer category. Pink data points indicate samples with enriched T>G burden at TFBS. Triangles indicate samples with XPD mutation. D) Observed over expected ratio of T>G sSNV at TFBS in cancer samples carrying XPD mutations, vs non-carriers. E) Forest plot of sSNV rate in Liver and Bladder cancers stratified by enrichment of T>G mutations at TFBS (pink data points from panel C). F) 96 trinucleotide context of SCZ sSNV at active TFBS (TFBS+DHS) and at promoter regions, along with liver and bladder cancer sSNV from samples with XPD dysfunction at active TFBS. The corresponding tissue DHS track for each cancer type was obtained from the ENCODE database (Table S5).
Fig. 5.
Fig. 5.. Transcriptional impact of early developmental somatic variants in SCZ and control individuals.
A) Schematic of MPRA experimental design. B, C) Schematic of T>G sSNV occurring near developmental genes NFIX and ELAVL3/ZNF63, with DHS and TFBS tracks. MPRA bar plots represent expression levels from each allele in MPRA. P-values represent Benjamini-Hochberg-corrected Wald’s test between the log ratios of the reference and alternative alleles. D) & E) MPRA results, motif break prediction, and integrative genomic viewer of enhancer-gene linkage map for somatic-emVars targeting known SCZ risk genes. MPRA bar plots represent expression levels from each allele in MPRA, and P-values represent Benjamini-Hochberg-corrected Wald’s test between the log ratios of the reference and alternative alleles. DHS tracks for human fetal brain tissues at different stages are from the ENCODE portal.

Similar articles

References

    1. Owen MJ, Legge SE, Rees E, Walters JTR, O’Donovan MC, Genomic findings in schizophrenia and their implications. Mol Psychiatry 28, 3638–3647 (2023). - PMC - PubMed
    1. Bae T et al., Different mutational rates and mechanisms in human cells at pregastrulation and neurogenesis. Science (New York, N.Y 359, 550–555 (2018). - PMC - PubMed
    1. Bizzotto S et al., Landmarks of human embryonic development inscribed in somatic mutations. Science (New York, N.Y 371, 1249–1253 (2021). - PMC - PubMed
    1. Heinzen EL, Somatic variants in epilepsy - advancing gene discovery and disease mechanisms. Curr Opin Genet Dev 65, 1–7 (2020). - PMC - PubMed
    1. Khoshkhoo S et al., Contribution of Somatic Ras/Raf/Mitogen-Activated Protein Kinase Variants in the Hippocampus in Drug-Resistant Mesial Temporal Lobe Epilepsy. JAMA Neurol 80, 578–587 (2023). - PMC - PubMed