. 2024 Oct 10;20(10):e1011438.
doi: 10.1371/journal.pgen.1011438. eCollection 2024 Oct.

Tissue-specific knockout in the Drosophila neuromuscular system reveals ESCRT's role in formation of synapse-derived extracellular vesicles

Affiliations

Tissue-specific knockout in the Drosophila neuromuscular system reveals ESCRT's role in formation of synapse-derived extracellular vesicles

Xinchen Chen et al. PLoS Genet. .

Abstract

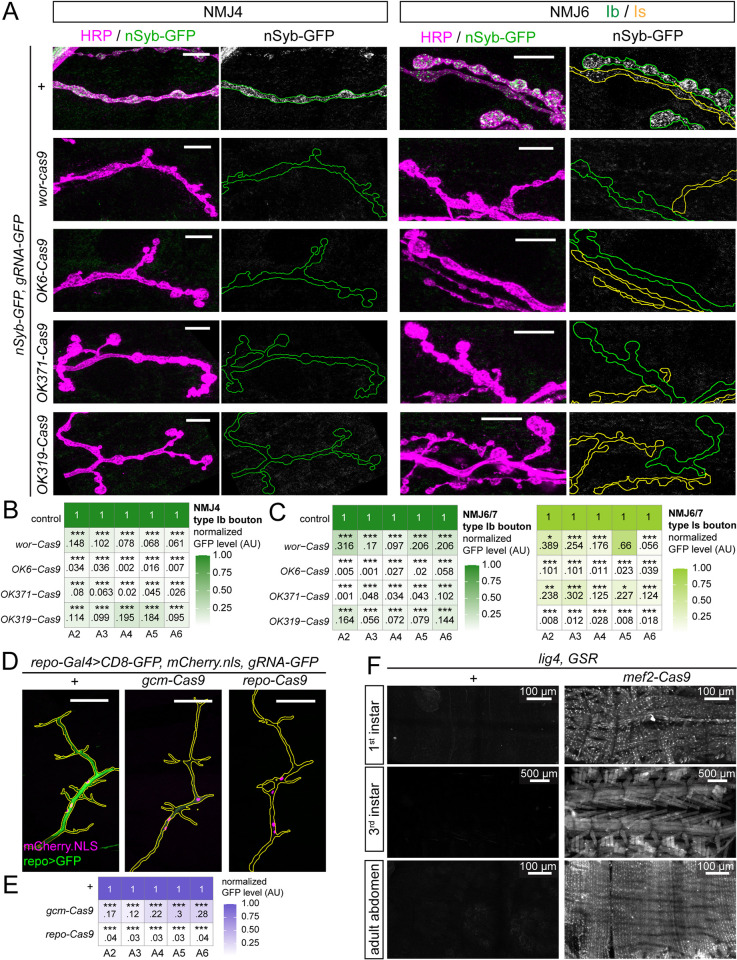
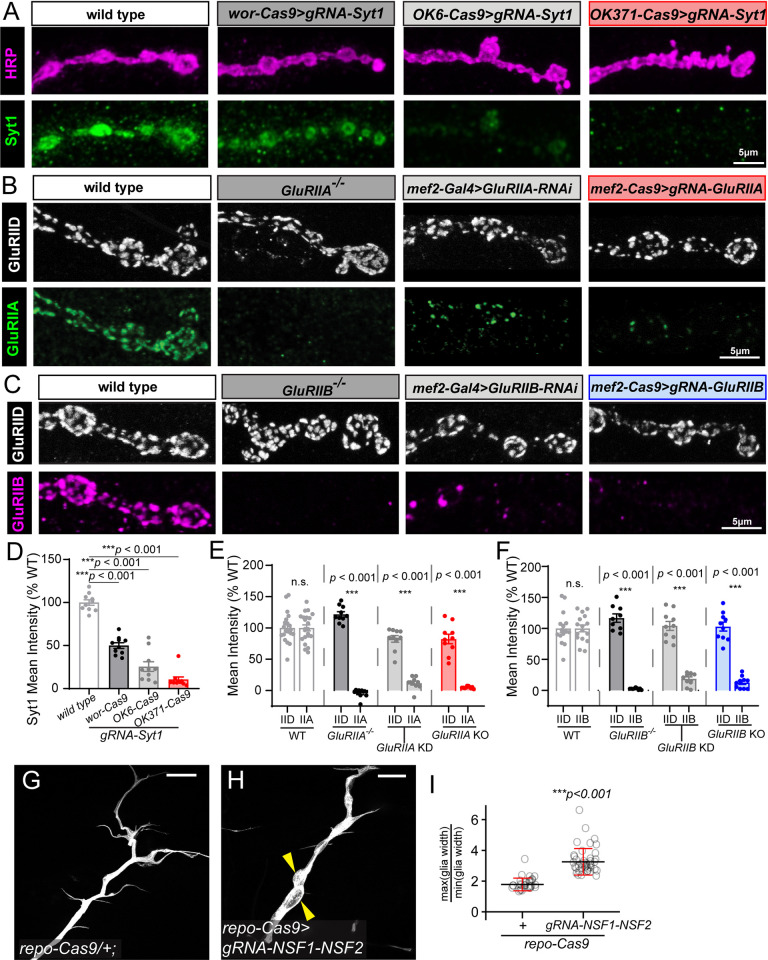
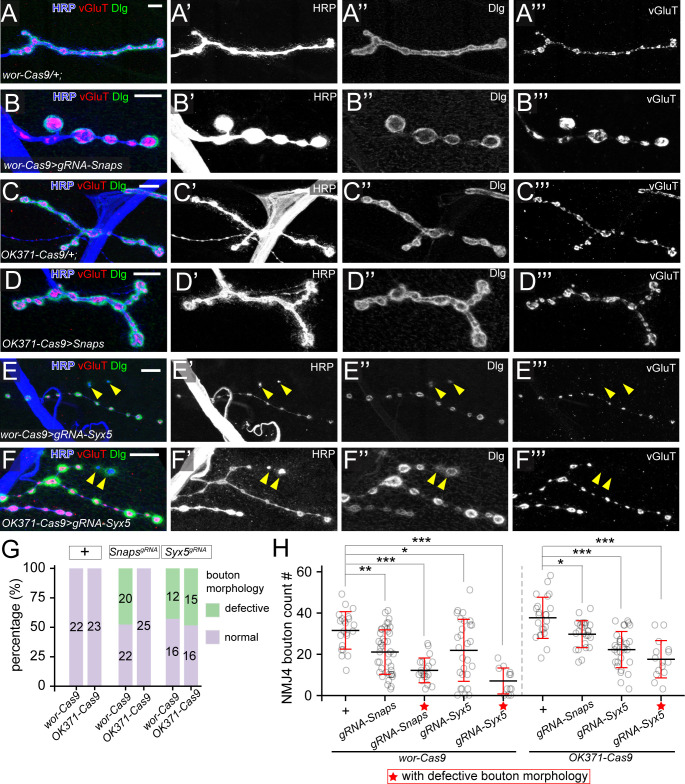
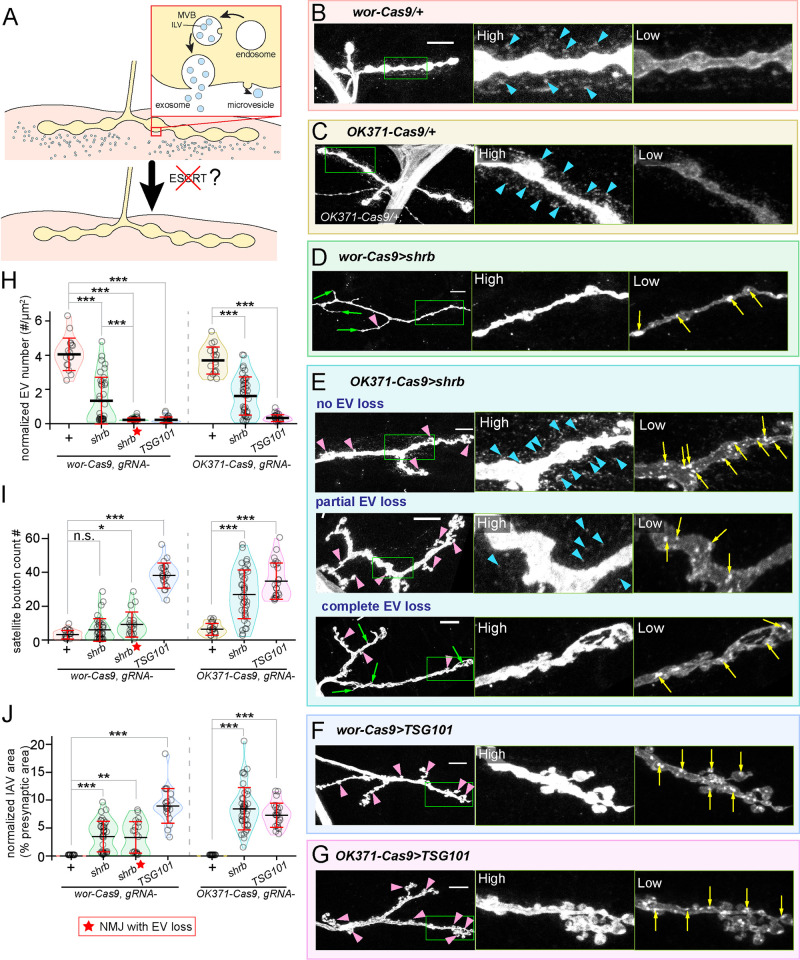
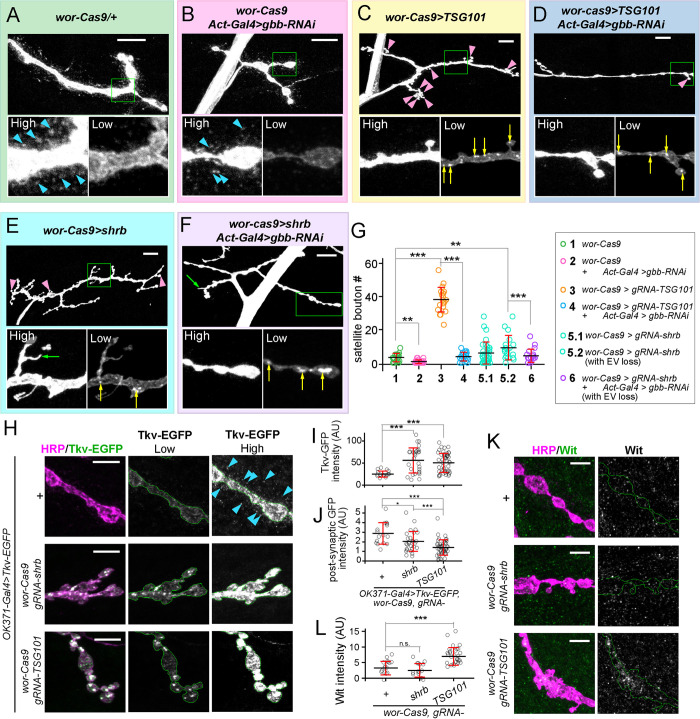
Tissue-specific gene knockout by CRISPR/Cas9 is a powerful approach for characterizing gene functions during development. However, this approach has not been successfully applied to most Drosophila tissues, including the Drosophila neuromuscular junction (NMJ). To expand tissue-specific CRISPR to this powerful model system, here we present a CRISPR-mediated tissue-restricted mutagenesis (CRISPR-TRiM) toolkit for knocking out genes in motoneurons, muscles, and glial cells. We validated the efficacy of CRISPR-TRiM by knocking out multiple genes in each tissue, demonstrated its orthogonal use with the Gal4/UAS binary expression system, and showed simultaneous knockout of multiple redundant genes. We used CRISPR-TRiM to discover an essential role for SNARE components in NMJ maintenance. Furthermore, we demonstrate that the canonical ESCRT pathway suppresses NMJ bouton growth by downregulating retrograde Gbb signaling. Lastly, we found that axon termini of motoneurons rely on ESCRT-mediated intra-axonal membrane trafficking to release extracellular vesicles at the NMJ. Thus, we have successfully developed an NMJ CRISPR mutagenesis approach which we used to reveal genes important for NMJ structural plasticity.


Conflict of interest statement

The authors have declared that no competing interests exist.

Figures

Fig 1
Fig 1. Tissue-specific Cas9 activity patterns characterized by Cas9 reporters.
(A) Activity patterns of neuron-specific Cas9 lines at the NMJs of muscle 4 (NMJ4) and muscle 6/7 (NMJ6/7) as visualized by the negative tester nSyb-GFP; gRNA-GFP. The control cross does not have a Cas9. Type Ib boutons of NMJ4 and NMJ6/7 and Type Is boutons of NMJ6/7 were examined. Scale bar: 10 μm. (B–C) Quantification of presynaptic GFP intensity at NMJ4 (B) and NMJ6/7 (C). ***p≤0.001; one-way ANOVA. p values were adjusted by Bonferroni post hoc method. See S2 Table for sample sizes. (D) Activity patterns of glia-specific Cas9 lines in intersegmental nerves (ISNs) characterized with a negative tester repo-Gal4, UAS-CD8-GFP, UAS-mCherry.nls, gRNA-GFP. Scale bar: 10 μm. (E) Quantification of glial GFP intensity along ISNs. ***p≤0.001; one-way ANOVA. p values were adjusted by Bonferroni post hoc method. See S2 Table for sample sizes. (F) The activity pattern of muscle-specific Mef2-Cas9, characterized by a single strand annealing (SSA)-based positive tester GSR. The non-homologous end joining (NHEJ)-deficient lig4 mutation was combined with GSR to increase the frequency of SSA and thus the reliability of GSR labeling. Upper panel, 1st instar larva; middle panel, 3rd instar larva fillet; lower panel, adult abdomen.
Fig 2
Fig 2. Efficient gene knockout induced by CRISPR-TRiM in the larval neuromuscular system.
(A) Syt1 knockout (KO) in motoneurons by wor-Cas9, OK6-Cas9 and OK371-Cas9. The Syt1 protein is detected by antibody staining. The axon membrane is visualized by HRP staining. (B) Comparison of different methods to remove GluRIIA expression in muscles: whole animal GluRIIA mutant (2nd panel), muscle-specific RNAi (3rd panel), and muscle-specific CRISPR KO (4th panel). The GluRIIA protein is detected by antibody staining. GluRIID staining serves as an internal control. (C) Comparison of similar methods as (B) to induce GluRIIB loss-of-function in muscles. GluRIIB protein level is detected by antibody staining. GluRIID level is unaffected and serves as an internal control. (D–F) Mean intensity of staining of Syt1 (D), GluRIIA and GluRIID (E), and GluRIIB and GluRIID (F) in the indicated genotypes. One-way ANOVA, p < 0.0001 for all 3 datasets compared to wild type; WT, n = 10; wor-Cas9>gRNA-Syt1, n = 10; OK6-Cas9>gRNA-Syt1, n = 10; OK371-Cas9>gRNA-Syt1, n = 10; WT, n = 22; GluRIIA-/-, n = 10; Mef2-Gal4>GluRIIA-RNAi, n = 10; Mef2-Cas9>gRNA-GluRIIA, n = 10; WT, n = 16; GluRIIB-/-, n = 9; Mef2-Gal4>GluRIIB-RNAi, n = 10; Mef2-Cas9>gRNA-GluRIIB, n = 10. All NMJs shown are Ib boutons at NMJ4 in A2-A4 segments. No data were thrown out in the analysis. (G–H) Intersegmental nerve glia in the control (G) and glial-specific KO of NSF1/NSF2 by repo-Cas9 (H). Glial cells are labeled with repo-Gal4>UAS-CD4-tdTomato. Yellow arrowheads indicate glial enlargement. Scale bar: 50 μm. (I) The ratio of maximal/minimal nerve thickness in control and glial NSF1/NSF2 KO. The segment before the first major branch in each intersegmental nerve (ISN) is examined (see S2D Fig). ***p≤0.001; t-test. repo-Cas9: n = 29; repo-Cas9>gRNA-NSF1-NSF2: n = 41.
Fig 3
Fig 3. SNARE components are required for NMJ maintenance.
(A–C) Boutons of wor-Cas9 (A), triple KO of Snap24/Snap25/Snap29 by wor-Cas9 (B) and Syx5 KO by wor-Cas9 (C). Scale bar: 10μm. (D–F) Boutons of OK371-Cas9 (D), triple KO of Snap24/Snap25/Snap29 by OK371-Cas9 (E), and Syx5 KO by OK371-Cas9 (F). In (A–F), neuronal membrane is labeled by HRP staining, presynaptic density is marked by vesicular glutamate transporter (vGluT) antibody staining and subsynaptic reticulum (SSR) is labeled by Disc Large (Dlg) antibody staining. Scale bar: 10μm. (G) Penetrance of observable bouton morphology defects in 6 genotypes shown in (A–F). Numbers indicate the sample size of each genotype. (H) Bouton numbers of genotypes shown in (A–F). ***p≤0.001; **p≤0.01; *p≤0.05; One-way ANOVA. Each circle represents an NMJ: wor-Cas9, n = 22; Snapswor-Cas9, n = 42; ★Snapswor-Cas9, n = 20; Syx5wor-Cas9, n = 28; ★Syx5wor-Cas9, n = 12; OK371-Cas9, n = 23; SnapsOK371-Cas9, n = 25; Syx5OK371-Cas9, n = 31; ★Syx5OK371-Cas9, n = 15, p values are from multiple comparison test using Bonferroni adjustment. All boutons were from NMJ4 in segments A2-A4. Groups with red stars contain only NMJs with observable bouton defects.
Fig 4
Fig 4. CRISPR-TRiM reveals roles of ESCRT in motoneuron morphogenesis and EV biogenesis.
(A) A diagram of possible routes of EV biogenesis at the NMJ and the experimental design. (B–G) NMJs in wor-Cas9 (B) and OK371-Cas9 (C) controls, shrb KO by wor-Cas9 (D) and OK371-Cas9 (E), and TSG101 KO by wor-Cas9 (F) and OK371-Cas9 (G). Motoneurons are visualized by HRP staining. “High” and “Low” panels show the zoomed-in views of the area enclosed by the green box imaged with high (to visualize EVs) and low (to visualize IAVs) intensity settings. Three images of OK371-Cas9>shrb in (E) show different degrees of EV loss. Blue arrowheads in (B), (C) and (E) indicate the EVs surrounding the presynaptic compartment. Yellow arrows in (D), (E), (F) and (G) indicate IAVs. Green arrows in (D) and (E) indicate filamentous protrusions formed by the presynaptic membrane. Pink arrowheads in (D–G) indicate satellite boutons. Scale bar: 10μm. (H-J) EV numbers (H, normalized by the presynaptic area), satellite bouton numbers (I), and IAV areas (J, normalized by the presynaptic area) from various genotypes. ***p≤0.001, **p≤0.01, *p≤0.05, n.s., not significant. One-way ANOVA. Each circle represents an NMJ: wor-Cas9, n = 17; shrbwor-Cas9, n = 36; ★shrbwor-Cas9, n = 19; TSG101wor-Cas9, n = 21; OK371-Cas9, n = 18; shrbOK371-Cas9, n = 41; TSG101OK371-Cas9, n = 23; p values are from multiple comparison test using Bonferroni adjustment. All boutons were from NMJ4 in segments A2-A4. Groups with red stars contain only NMJs with strong EV loss.
Fig 5
Fig 5. ESCRT LOF causes satellite bouton overgrowth by regulating BMP signaling.
(A–F) NMJ morphologies in the control (A), global gbb KD (B), TSG101 KO by wor-Cas9 (C), motoneuronal TSG101 KO combined with global gbb KD (D), shrb KO by wor-Cas9 (E) and motoneuronal shrb KO combined with global gbb KD (F). Motoneurons are visualized by HRP staining. “High” and “Low” panels show the zoomed-in views of the area enclosed by the green box. The same NMJ is imaged with both high and low intensity settings. Pink arrowheads indicate satellite boutons. Yellow arrows indicate IAVs. Blue arrowheads indicate EVs. Green arrowheads indicate protrusions from axons. Scale bar: 10μm. (G) satellite bouton numbers in the indicated genotypes. ***p≤0.001, **p≤0.01, One-way ANOVA. Each circle represents an NMJ: wor-Cas9, n = 17; gbb-RNAiAct-Gal4, n = 25; TSG101wor-Cas9, n = 21; TSG101wor-Cas9 / gbb-RNAiAct-Gal4, n = 20; shrbwor-Cas9, n = 36; shrbwor-Cas9 with EV loss, n = 19; shrbwor-Cas9 / gbb-RNAiAct-Gal4 with EV loss, n = 20; between-group p values are from multiple comparison test using Bonferroni adjustment. The datasets of wor-Cas9>gRNA-shrb and wor-Cas9>gRNA-TSG101 are the same as in Fig 4. (H) Tkv-EGFP signals in control (upper panel), shrb KO (middle panel) and TSG101 KO (lower panel) neurons. Blue arrowheads indicate EVs. Scale bar: 10μm. (I) Mean Tkv-EGFP intensity inside boutons in control, shrb KO and TSG101 KO animals. ***p≤0.001, One-way ANOVA. Each circle represents an NMJ: Gal4OK371>Tkv-EGFP, n = 16; Gal4OK371>Tkv-EGFP, Cas9wor>shrbgRNA, n = 29; Gal4OK371>Tkv-EGFP, Cas9wor>TSG101gRNA, n = 46, between-group p values are from multiple comparison test using Bonferroni adjustment. (J) Mean postsynaptic Tkv-EGFP intensity in control, shrb KO and TSG101 KO animals. ***p≤0.001, *p≤0.05, One-way ANOVA. Each circle represents an NMJ: Gal4OK371>Tkv-EGFP, n = 16; Gal4OK371>Tkv-EGFP, Cas9wor>shrbgRNA, n = 29; Gal4OK371>Tkv-EGFP, Cas9wor>TSG101gRNA, n = 46, between-group p values are from multiple comparison test using Bonferroni adjustment. (K) Wit staining in control (upper panel), shrb KO (middle panel) and TSG101 KO (lower panel) neurons. Scale bar: 5 μm. (L) Mean Wit level inside boutons in control, shrb KO and TSG101 KO animals. ***p≤0.001, One-way ANOVA. Each circle represents an NMJ: wor-Cas9, n = 16; Cas9wor>shrbgRNA, n = 14; Cas9wor>TSG101gRNA, n = 28, between-group p values are from multiple comparison test using Bonferroni adjustment.

Update of

Similar articles

References

    1. Port F, Chen HM, Lee T, Bullock SL. Optimized CRISPR/Cas tools for efficient germline and somatic genome engineering in Drosophila. Proc Natl Acad Sci U S A. 2014;111(29):E2967–76. Epub 20140707. doi: 10.1073/pnas.1405500111 ; PubMed Central PMCID: PMC4115528. - DOI - PMC - PubMed
    1. Platt RJ, Chen S, Zhou Y, Yim MJ, Swiech L, Kempton HR, et al.. CRISPR-Cas9 knockin mice for genome editing and cancer modeling. Cell. 2014;159(2):440–55. Epub 20140925. doi: 10.1016/j.cell.2014.09.014 ; PubMed Central PMCID: PMC4265475. - DOI - PMC - PubMed
    1. Ablain J, Durand EM, Yang S, Zhou Y, Zon LI. A CRISPR/Cas9 vector system for tissue-specific gene disruption in zebrafish. Dev Cell. 2015;32(6):756–64. Epub 20150305. doi: 10.1016/j.devcel.2015.01.032 ; PubMed Central PMCID: PMC4379706. - DOI - PMC - PubMed
    1. Port F, Strein C, Stricker M, Rauscher B, Heigwer F, Zhou J, et al.. A large-scale resource for tissue-specific CRISPR mutagenesis in Drosophila. Elife. 2020;9. Epub 20200213. doi: 10.7554/eLife.53865 ; PubMed Central PMCID: PMC7062466. - DOI - PMC - PubMed
    1. Singha DL, Das D, Sarki YN, Chowdhury N, Sharma M, Maharana J, et al.. Harnessing tissue-specific genome editing in plants through CRISPR/Cas system: current state and future prospects. Planta. 2021;255(1):28. Epub 20211228. doi: 10.1007/s00425-021-03811-0 . - DOI - PubMed

MeSH terms

Substances

LinkOut - more resources