[Preprint]. 2024 Sep 29:2024.09.28.615444.
doi: 10.1101/2024.09.28.615444.

Mapping and engineering RNA-controlled architecture of the multiphase nucleolus

Affiliations

Mapping and engineering RNA-controlled architecture of the multiphase nucleolus

S A Quinodoz et al. bioRxiv. .

Abstract

Biomolecular condensates are key features of intracellular compartmentalization. As the most prominent nuclear condensate in eukaryotes, the nucleolus is a layered multiphase liquid-like structure and the site of ribosome biogenesis. In the nucleolus, ribosomal RNAs (rRNAs) are transcribed and processed, undergoing multiple maturation steps that ultimately result in formation of the ribosomal small subunit (SSU) and large subunit (LSU). However, how rRNA processing is coupled to the layered nucleolar organization is poorly understood due to a lack of tools to precisely monitor and perturb nucleolar rRNA processing dynamics. Here, we developed two complementary approaches to spatiotemporally map rRNA processing and engineer de novo nucleoli. Using sequencing in parallel with imaging, we found that rRNA processing steps are spatially segregated, with sequential maturation of rRNA required for its outward movement through nucleolar phases. Furthermore, by generating synthetic de novo nucleoli through an engineered rDNA plasmid system in cells, we show that defects in SSU processing can alter the ordering of nucleolar phases, resulting in inside-out nucleoli and preventing rRNA outflux, while LSU precursors are necessary to build the outermost layer of the nucleolus. These findings demonstrate how rRNA is both a scaffold and substrate for the nucleolus, with rRNA acting as a programmable blueprint for the multiphase architecture that facilitates assembly of an essential molecular machine.


Conflict of interest statement

Competing interests C.P.B. is a scientific founder, Scientific Advisory Board member, shareholder, and consultant for Nereid Therapeutics.

Figures
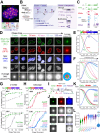
Figure 1:
Figure 1:. Sequencing and imaging of nascent ribosomal RNA flux provides a spatiotemporal map of processing in the nucleolus.
(A) The three phases of the nucleolus in MCF10A cells: the fibrillar center (FC, green), dense fibrillar component (DFC, red), and granular component (GC, blue). Schematic of pre-rRNA processing and outflux as it is assembled into small and large ribosomal subunits (SSU and LSU). (B) The 5eU-seq and 5eU-imaging approach. Cells were pulsed with 5eU to label nascent RNA for 15 min, followed by chase with excess uridine over various time points for imaging to measure rRNA flux or sequencing to measure rRNA cleavage and 2’-O-methylation (2’-O-Me). (C) Schematic of cleavage steps occurring during pre-rRNA processing (only one of the two cleavage pathways is drawn for simplicity). Cleavage junctions and intermediates are categorized into early (green), middle (red), late (blue), and mature (purple) based on 5eU-seq data in H. (D) 5eU-imaging in MCF10A cells shows radial outflux of 5eU-labeled pre-rRNA from the FC center over different chase times. Individual nucleoli are outlined by dashed lines. Averaged 5eU images around FCs are shown. (E) Min-max normalized intensities (y axis) of FC, DFC, GC nucleolar phases by distance from FC center (μm, x axis), quantified from images in D; number of nucleoli (n) = 4274. A color bar indicating the localization of FC, DFC, GC phases is shown. (F) Min-max normalized intensities of 5eU (y axis) by distance from FC center (μm, x axis) over different chase timepoints, quantified from images in d; number of nucleoli (n) = 717, 459, 499, 603, 470, 451, 550, 525 for sequential time points. (G) 18S and 28S pre-rRNA 2’-O-methylation (2’-O-Me) levels (ScoreC) detected by 5eU-seq over time. The top color bar relates chase time with distance, generated based on measured 5eU peak location over time (Supplementary Figure 2A). (H) Fraction of pre-rRNA cleaved at early, middle, and late sites over time measured by 5eU-seq. (I) Schematic of RNA FISH probe localization along rDNA. (J) Average fluorescence images around FCs of all FISH probes and the three nucleolar phases. See Supplementary Figure 2D for example images. (K) Min-max normalized intensity of FISH probes over distance from FC center with probes for early, middle, late rRNA cleavage junctions. (L) Quantified Pearson’s correlation between all FISH probes and GC. For k-l, the number of nucleoli (n) = 72 (5’ ETS), 95 (3’ ETS), 24 (Junc01), 111 (Junc1), 230 (Junc2), 38 (Junc3’), 105 (Junc4’), ITS2–28S (318), 18S (72), 28S (310). Violin plots are centered by median and quartiles are shown. All scale bars = 1 μm. All error bars are s.e.m. All FCs are labeled with RNA polymerase I (Pol I) subunit RPA194 IF, DFCs with fibrillarin (FBL) IF and GC with endogenously tagged mTagBFP2-NPM1 as validated in Supplementary Figure 2E–F.
Figure 2:
Figure 2:. Impaired rRNA processing impacts rRNA flux and alters nucleolar morphology.
(A) Cells were treated with various pre-rRNA processing perturbations followed by 5eU pulse chase. 5eU-seq measures defects in pre-rRNA processing while 5eU imaging measures the flux of nascent RNA through the nucleolus as well as nucleolar morphology changes. (B) Fold change in 5’ ETS cleavage (junction 1) or ITS2 (region downstream of 3’ junction) measured using 5eU-seq upon different perturbations: 2 μM Flavopiridol (FVP) treatment (general processing inhibitor, purple), knockdown (KD) of SSU processing factors (U3 snoRNA or FBL, red), or LSU processing factors (RPL5 or U8 snoRNA, blue). (C) Representative images of 5eU-labeled RNA (white) in nucleolus (mTagBFP2-NPM1) after 60 min chase in control and in various perturbation conditions. Quantification of 5eU correlation with NPM1 (GC) 0–120 minutes after transcription (chase time) upon all perturbations. (D) Average 18S and 28S rRNA 2’-O-Me levels (quantified by ScoreC) by 5eU-seq upon all perturbations (dashed lines) or control (solid lines) across 0–90 min after transcription (chase time). (E) Representative images and schematics of GC (NPM1, blue), DFC (FBL, red), and FC (RPA194, green) labeled with IF for all conditions except for FBL KD, where mTagBFP2-NPM1, NOP56-mCherry, RPA16-GFP was used. (F) Quantification of FC and DFC enrichment on the rim of the nucleolus in control and all perturbations (normalized to control average value). Violin plots are centered by median (solid line) and quartiles are shown (dashed lines). **** p-value < 0.0001 (two-tailed Mann-Whitney test) n = 1116 (Controls), 97 (Fib), 228 (RPL5), 153 (U3), 105 (U8) cells. All scale bars = 3 μm. All error bars are s.e.m.
Figure 3:
Figure 3:. Engineered synthetic nucleoli in cells recapitulate normal multiphase architecture with the expression of the LSU precursors required for GC recruitment.
(A) Schematics of endogenous rDNA and plasmids expressing synthetic rDNA sequences. Synthetic rDNA plasmids contain three segments (Δ1, Δ2, and Δ3) deleted from the 5’ ETS region of endogenous rDNA, enabling detection of endogenous rRNA (Endo.) 5’ ETS probes. The synthetic rDNA sequences have unique insertions in 18S and 28S that can be probed with 18S* and 28S* FISH probes. SSU only and LSU only plasmids with truncated rDNA sequences are shown. Refer to Supplementary Figure 8A–B for plasmid details. (B-D) RNA FISH detection of endogenous pre-rRNA by endo. 5’ ETS probes (yellow) or plasmid-expressed pre-rRNA by 18S* probe (white) in HEK293T cells after transient transfection in B. All dashed lines demarcate individual nucleoli and solid lines demarcate individual nuclei. Based on the nucleolar mean intensity of 18S* probe and endo. 5’ ETS probe, different classes of nucleoli are defined, including “De novo” (from rDNA plasmids only), “Endogenous” (from endogenous rDNA repeats), and “Hybrid” (when rDNA plasmids fuse with endogenous nucleoli), quantified in D. Example nucleoli from each class are shown in C with DFC (FBL IF) and GC (NPM1 IF). See Supplementary Figure 9A for antisense FISH probe control and Supplementary Figure 10B for de novo nucleoli visualized with all three phases labeled. (E) Left, de novo nucleoli formed from rDNA, SSU only, and LSU only plasmids. Plasmid RNA visualized with RNA FISH (28S* for rDNA and LSU only, 18S* for SSU only) in nucleoli labeled by DFC (NOP56-mCherry) and GC (mTagBFP2-NPM1). Right, cytoplasmic plasmid rRNA signals for each condition are shown on the side. (F) Quantification of mean nucleolar NOP56 (DFC) intensity and NPM1 (GC) intensity from images in E. *P value = 0.0248, **P value = 0.0012, **** P value <0.0001 (two-tailed Mann Whitney test); n = 24 (WT), 14 (SSU only), 17 (LSU only) nucleoli. (G) The mean cytoplasmic RNA FISH intensity for rDNA, SSU only, and LSU only plasmids quantified from images in E. ** p value = 0.0016; **** p value < 0.0001 (two-tailed Mann Whitney test). n = 32 (WT; 18S* rRNA), 47 (WT; 28S* rRNA), 90 (SSU only), 7 (LSU only) cells. Scale bars in B and E (right; whole cells) are 3 μm while the ones in C and E (left; nucleoli) are 1 μm. Box and Whisker Plots: median plotted, boxes span 25th to 75th percentiles, whiskers span min-max values.
Figure 4:
Figure 4:. SSU processing drives the layering of the multiphase nucleolus and the outflux of SSU precursors from the nucleolus.
(A) Schematics of plasmids expressing both U3 snoRNA and synthetic rDNA with various mutations at U3 binding sites (red). Refer to Supplementary Figure 8C–G for details. (B) The nucleolar morphology of de novo nucleoli as shown by the lack of endogenous 5’ ETS signal (yellow) labeled by GC (mTagBFP2-NPM1; blue) and DFC (NOP56-mCherry; red) from plasmids with normal U3 hybridization sequence, 3’ hinge mutations, 3’,5’ hinge mutations, or mutant U3 snoRNAs that rescue the hybridization. Schematics illustrate nucleolar morphology and 18S* (plasmid) rRNA localization. Cytoplasmic signals for plasmid-expressed 18S and 28S rRNAs for each condition are shown along the side. Solid lines demarcate individual nuclei. See Supplementary Figure 10B–D for all morphologies reproduced without overexpression (using IF) and visualization of all 3 nucleolar phases. (C) Quantification of DFC enrichment on nucleolar rim (rim enrichment score) for all plasmids in B. **** p-value < 0.0001; ** p-value = 0.0024 (two-tailed Mann-Whitney test); n = 95, 12, 19, 9, 18, 13 nucleoli (D) Pearson’s correlation of nucleolar 18S* signal with the GC phase (NPM1) of the nucleolus, quantified from all plasmids in B. * p-value = 0.0221; ** p-value = 0.0012 (two-tailed Mann-Whitney test); n = 7, 9, 6, 15, 8 nucleoli. (E) Quantification of cytoplasmic 18S* signal from B. **** p-value < 0.0001 (two-tailed Mann-Whitney test). n = 32, 38, 58, 79, 102 cells. (F) Schematics of wild type (WT) or mutant SSU only plasmids, refer to Supplementary Figure 8B for details, and example images of nucleoli formed by these two plasmids, labeled with DFC (NOP56-mCherry) and FC (RPA194 IF). Quantification of FC rim enrichment is in Supplementary Figure 11A. (G) Visualization of protein of interest (POI, shown in green), in WT SSU only nucleoli demarcated by NOP56-mcherry (red), including processing factors FBL (IF), EXOSC10 (IF), and ribosomal protein RPS6-Halotag. Plasmid-expressed 18S* RNA is shown in white. (H) Quantification of the radial distribution of 18S* RNA and factors in g around the DFC boundary (distance=0 is defined at 50% of maximal NOP56 signal). n = 74 (Nop56, 18S), 87 (FBL), 21 (RPS6), 12 (EXOSC10). (I) Examples of DFC (NOP56-mCherry) and 18S* in WT vs mutant SSU only nucleoli with their radial distribution quantified. All scale bars = 1 μm except for the right part of B (= 3 μm); n = 74 (WT SSU), 164 (Mutant SSU) nucleoli. Box and Whisker Plots: Median plotted, Boxes span 25th to 75th percentiles, Whiskers span min-max values. All error bars are s.e.m.
Figure 5:
Figure 5:. An RNA-dependent multiphase model of nucleolar architecture.
(A) Proposed model of how rRNA transcription and rRNA processing shape the multiphase nucleolus. A 13 kb pre-rRNA is transcribed from rRNA, processed, and cleaved to assemble the SSU and LSU. Here we show that the LSU precursors are necessary for assembling the nucleolar GC phase (blue) and SSU processing drives the ordering of the DFC (red) and GC (blue) phases. Different arrangements of multiphase structures (e.g. normal or inversion) can arise from changes in interfacial tensions across multiple interfaces: Nucleoplasm (NP)-DFC (γNP, DFC), NP-GC (γNP, GC), GC-DFC (γGC, DFC). Under normal U3-mediated cleavage of 5’ ETS from SSU pre-rRNA, the DFC localizes inside the GC. Upon impaired U3-mediated SSU processing, SSU pre-rRNAs build up in the DFC phase and are absent in the GC phase. This results in a change in the interfacial tensions and the nucleolar morphology inverts, where GC is now enveloped by the DFC. (B) Different nucleolar morphologies are recapitulated in a phase-field model that considers the partitioning of different rRNA precursors (e.g. SSU pre- and post- 5’ ETS cleavage) into the different nucleolar phases (DFC and GC). For simplicity, the FC and DFC are modeled as one nucleolar phase. Changes in U3-mediated processing, RNA Pol I transcription, or LSU production (SSU only) alter the concentrations of rRNA precursors in each phase, resulting in different nucleolar morphologies. (C) Modeling of SSU processing (5’ ETS cleavage) over time whereby an accumulation of SSU precursors (pre 5’ ETS cleavage) results in inversion of the nucleolar phases. (D) Modeling of RNA Pol I transcriptional inhibition. Decreased concentration of all SSU and LSU rRNA precursors results in the nucleolar capping morphology.

Similar articles

References

    1. Alberti S., Gladfelter A. & Mittag T. Considerations and Challenges in Studying Liquid-Liquid Phase Separation and Biomolecular Condensates. Cell 176, 419–434 (2019). - PMC - PubMed
    1. Banani S. F., Lee H. O., Hyman A. A. & Rosen M. K. Biomolecular condensates: organizers of cellular biochemistry. Nat. Rev. Mol. Cell Biol. 18, 285–298 (2017). - PMC - PubMed
    1. Shin Y. & Brangwynne C. P. Liquid phase condensation in cell physiology and disease. Science 357, (2017). - PubMed
    1. Brangwynne C. P., Tompa P. & Pappu R. V. Polymer physics of intracellular phase transitions. Nat. Phys. 11, 899–904 (2015).
    1. Pappu R. V., Cohen S. R., Dar F., Farag M. & Kar M. Phase Transitions of Associative Biomacromolecules. Chem. Rev. 123, 8945–8987 (2023). - PubMed

Publication types