. 2024 Oct 8;14(1):23387.
doi: 10.1038/s41598-024-73143-y.

5-Fluorouracil induces apoptosis in nutritional deprived hepatocellular carcinoma through mitochondrial damage

Affiliations

5-Fluorouracil induces apoptosis in nutritional deprived hepatocellular carcinoma through mitochondrial damage

Ankita Dutta et al. Sci Rep. .

Abstract

5-Fluorouracil (5-FU) is the leading chemotherapeutic drug used to treat hepatocellular carcinoma, one of the major cancer diseases after atherosclerosis. Because of chemo-resistance, the success rate of treatment declines with time due to continuous drug exposure. Though autophagy induction is majorly responsible for acquired resistance, the exact role of this evolutionary conserved mechanism is unknown in cancer cell survival and suppression. The usual practice involves the combinatorial use of chemotherapeutic drugs with autophagy inhibitors like Chloroquine and Bafilomycin A, while neglecting the side effects caused by autophagy impairment in healthy cells. Starvation is a well-known physiological inducer of autophagy. In this study, by caloric modulation, we tried to circumvent the resistance imposed by prolonged drug exposure and investigated the effect of 5-FU in nutrient-sufficient and deficient conditions. Our findings show a substantial correlation between autophagy and increased cancer cell death in the presence of 5-FU, with negligible effects on normal cells. Experimental data revealed that nutritional deprivation augmented cell death in the presence of 5-FU through mitochondrial membrane damage and excessive reactive oxygen species (ROS) production, initiating apoptosis. Lipidation study also unveiled that under such combinatorial treatment cellular metabolism shifts from glucose to lipid biosynthesis. Overall, our experimental findings suggest that nutritional deprivation in combination with chemotherapeutic medication can be a new effective strategy to control hepatocellular carcinoma.

Keywords: 5–Fluorouracil; Apoptosis; Autophagy; Hepatocellular carcinoma; Reactive oxygen species (ROS); Starvation.


Conflict of interest statement

The authors declare no competing interests.

Figures

Fig. 1
Fig. 1
Autophagy induction via complete nutrient starvation: (a) Autophagy induced in normal (WRL-68) and cancer cell (HepG2) lines. (i) Formation of autophagosomes were detected by CYTO-ID® autophagy detection kit in presence of complete media (control), PBS and rapamycin (inducer of autophagy) in both cell lines, (ii) Quantitative change in fluorescence intensity relative to control. (b) LDH assay was performed in complete media (as control) and PBS and the results are represented as ± SD of at least three independent experiments. p < 0.05 was considered as significant; the standard deviations of the data have been shown in the form of error bars. Scale bar = 30 µM.
Fig. 2
Fig. 2
Cellular ROS, GST, and nitric oxide determination in autophagic cells: (a) ROS production was determined by 2’-7’-Dichlorodihydrofluoroscein diacetate (H2DCFDA) dye (2 µg/ml) in presence of complete media control), PBS, H2O2, and rapamycin. (i) All the cells were observed using fluorescence microscope (Magnus MLXi, India). Images included here are representative of three independent experiments on both cell lines. (ii) Quantitative change in fluorescence intensity relative to control. (b) (c) (d) & (e) Stress response enzyme assay was performed by quantitative measurement of glutathione’s transferase, nitric oxide, nitrite and nitrate activity, respectively. Values are represented as ± SD of at least three independent experiments. p < 0.05 was considered as significant; the standard deviations of the data have been shown in the form of error bars. Scale bar = 30 µM.
Fig. 3
Fig. 3
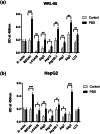
ATGs (Autophagic Targeted Genes) expression profile in autophagic WRL-68 and HepG2 cell lines: (a) and (b) Autophagy progression was determined in control (cells without treatment), and PBS (nutrient deprived for 3 h) by antibody based indirect ELISA method. The cytosolic protein was isolated from each treated condition and was subjected to indirect ELISA for quantifying autophagy related biomarkers. Quantification was achieved by recording absorbance at 450 nm using SPECTROStar Nano plate reader (BMG Labteck, Germany). All data are representative of three independent experiments and are expressed as mean ± SD. p < 0.05 was considered as significant; the standard deviations of the data have been shown in the form of error bars.
Fig. 4
Fig. 4
The comparative cell viability study in starved autophagic cells in presence of 5-FU: (a) The percentage of cell viability after 5- Fluorouracil treatment in WRL-68 and HepG2 cell by MTT assay after 24 h. IC50 dose of 250 µM and 300 µM were determined for WRL-68 and HepG2, respectively. (b) Trypan blue exclusion assay was performed for the accurate quantification of viable and non-viable cells in all treated conditions – control, PBS only (without nutrient), control + 5-FU and PBS + 5-FU (starvation induced autophagic condition + 5-Fluorouracil). All the values plotted are the averages of three different experiments; the standard deviations of the data have been shown in the form of error bars. (c) Morphological changes of HepG2 cell line and WRL-68 were observed under phase contrast microscope at initial stage (0 h) and after successful autophagy induction (3 h). All the experiments were performed in triplicate. Scale bar = 80 µM. (d) Autophagolysosomes were detected by the formation of acidic vacuole organelles under following conditions– complete media(control), nutrient deficient condition (PBS), 5-FU treated cells in presence/absence of nutrient (control + 5-FU and PBS + 5-FU) and Rapamycin treated cells (as positive control). All the experiments were done in triplicate and images represented are representative of three individual treatments. Scale bar = 30 µM.
Fig. 5
Fig. 5
Detection of reactive oxygen species formation using Dihydroethidium (DHE) dye. (a) Superoxide formation was detected by staining the cells with DHE (2 µg/ml) in presence and absence of nutrient along with 5-Fluorouracil. (i) WRL-68 and HepG2 cells were visualized under fluorescence microscope (Magnus MLXi, India). (ii) Quantitative change in fluorescence intensity relative to control. Scale bar = 50 µM. (b) Qualitative measurement of cellular lipidation status under each mentioned condition –complete media(control), PBS (nutrient deficient condition), 5-Fluorouracil under nutrient sufficient (control + 5-FU) and nutrient deficient condition (PBS + 5-FU). All stained cells were observed under a fluorescence microscope (Magnus MLXi, India). Scale bar = 30 µM. (c) Differential lipidation pattern was observed in – Control (without treatment), PBS (Nutrient deficient condition), 5-Fluorouracil under nutrient sufficient (control + 5-FU) and nutrient deficient condition (PBS + 5-FU). Extraction of the dye was done with 100% isopropanol and absorbance was recorded at 492 nm by SPECTROstar nano plate reader (BMG Labteck, Germany). 100% isopropanol was used as background control to subtract the background signal. All the values plotted are the averages of three different experiments; the standard deviations of the data have been shown in the form of error bars.
Fig. 6
Fig. 6
Detection of mitochondrial membrane damage through TMRE Assay. (a) Assessment of cell death was separately recorded in WRL-68 (normal liver cell line) and HepG2 (Hepatocarcinoma cell line) by Annexin V-FITC/PI conjugate assay- WRL-68 and HepG2 cells were treated with 5-FU drugs in complete media (control), PBS for 3 h and stained according to manufacturer’s protocol. (i) Slides were visualized under a fluorescence microscope (Magnus MLXi, India) and all the figures are representative of three individual experiments. (ii) Quantitative change in fluorescence intensity relative to control. Scale bar = 100 µM. (b) WRL-68 and HepG2 cells were treated with 5-FU drug in complete media (control) and with PBS. Cells were stained with 50 nM of tetramethylrhodamine ethyl ester (TMRE) dye. (i) Cells were observed using a fluorescence microscope (Magnus MLXi, India).and all the images included here are representative of three independent experiments on both cell lines. (ii) Quantitative change in fluorescence intensity relative to control. Scale bar = 30 µM. (c) Acridine Orange/Ethidium Bromide (2 µg/ml) staining was performed to detect apoptosis in cells under the combinatorial effect of PBS + 5-FU (5-Fluorouracil under nutrient deprived condition). (i) Early and late apoptotic cells were detected by staining with acridine orange and ethidium bromide dye using a fluorescence microscope (Magnus MLXi, India). Presence of apoptotic cells were compared with that of untreated control (with growth media) by three independent experiments. (ii) Quantitative changes in red and green fluorescence intensity. Scale bar = 30 µM.

Similar articles

References

    1. McGlynn, K. A., Petrick, J. L. & El-Serag, H. B. Epidemiology of hepatocellular carcinoma. Hepatol. 73, 4–13 (2021). - PMC - PubMed
    1. World Health Organization, International agency for research on cancer. (2019).
    1. Farshid, P. et al. Repetitive chemoembolization of hypovascular liver metastases from the most common primary sites. Future Oncol. 9, 419–426 (2013). - PubMed
    1. Penchev, D. K., Vladova, L. V., Zashev, M. Z. & Gornev, R. P. Distant liver metastases as a major factor influencing survival in patients with colorectal Cancer. Folia Med. 58, 182 (2016). - PubMed
    1. Xu, T. et al. Synergistic effects of Curcumin and 5-Fluorouracil on the Hepatocellular Carcinoma in vivo and vitro through regulating the expression of COX-2 and NF-κB. J. Cancer. 11, 3955 (2020). - PMC - PubMed

MeSH terms

LinkOut - more resources