. 2024 Oct 3:11:1891-1905.
doi: 10.2147/JHC.S485532. eCollection 2024.

Gut Microbiome and Hepatic Transcriptomic Determinants of HCC Development in Mice with Metabolic Dysfunction-Associated Steatohepatitis

Affiliations

Gut Microbiome and Hepatic Transcriptomic Determinants of HCC Development in Mice with Metabolic Dysfunction-Associated Steatohepatitis

Lillian I Dolapchiev et al. J Hepatocell Carcinoma. .

Abstract

Purpose: Hepatocellular carcinoma (HCC) related to metabolic dysfunction-associated steatotic liver disease (MASLD) is often diagnosed at a late stage, and its incidence is increasing. Predictive biomarkers are therefore needed to identify individuals at high risk of HCC. We aimed to characterize the gut microbiome and hepatic transcriptome associated with HCC development in female mice with hepatocyte-deletion of Pten (HepPten -). These mice present with large variations in HCC development, making them a powerful model for biomarker discovery.

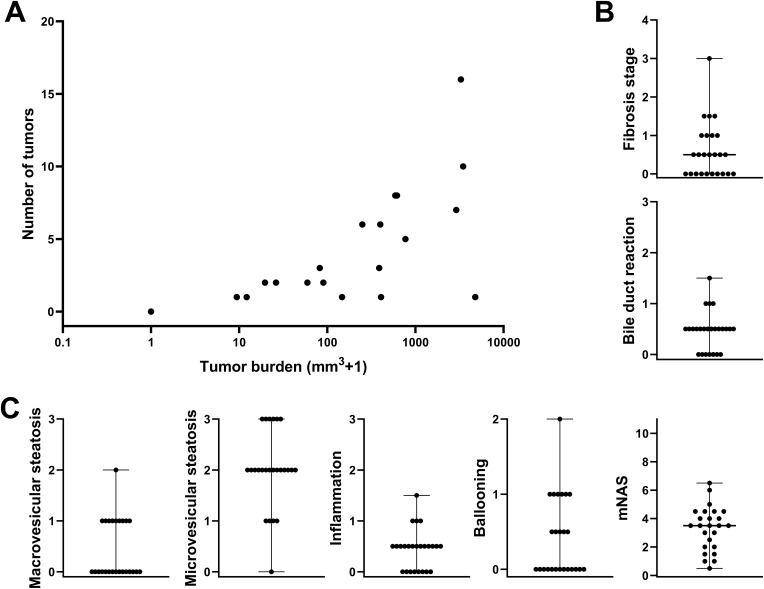
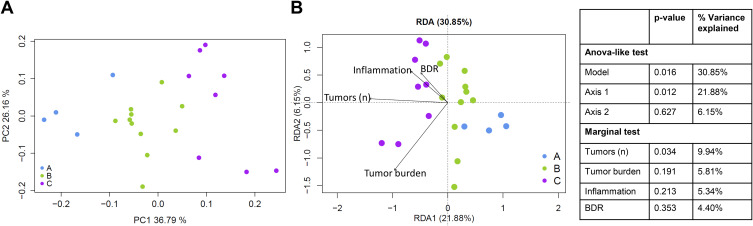
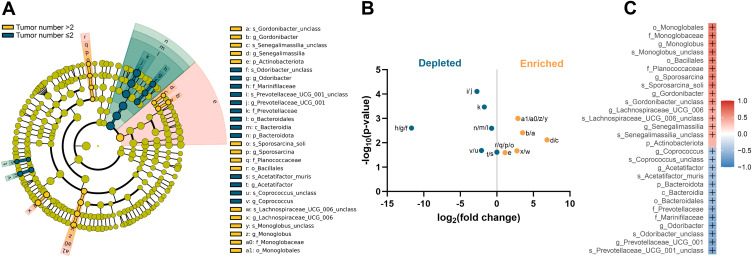
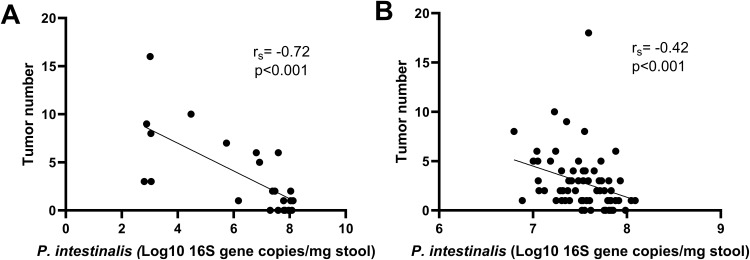
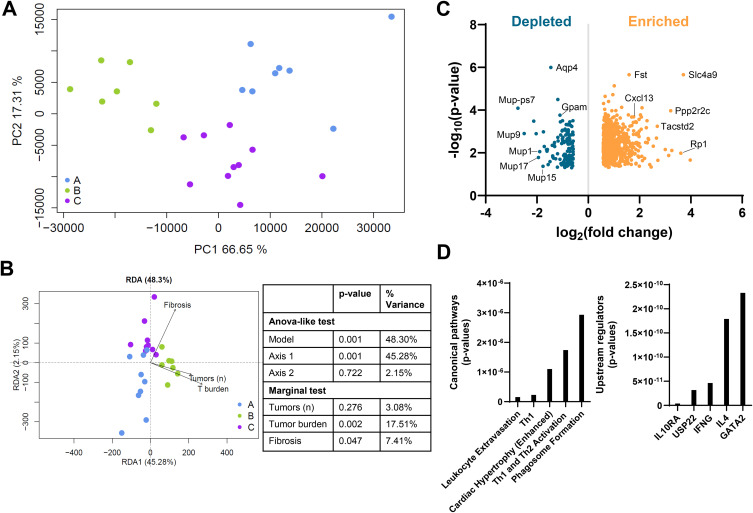
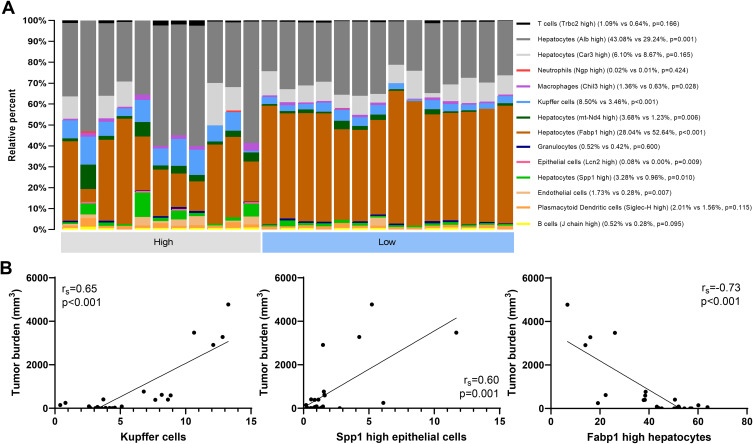
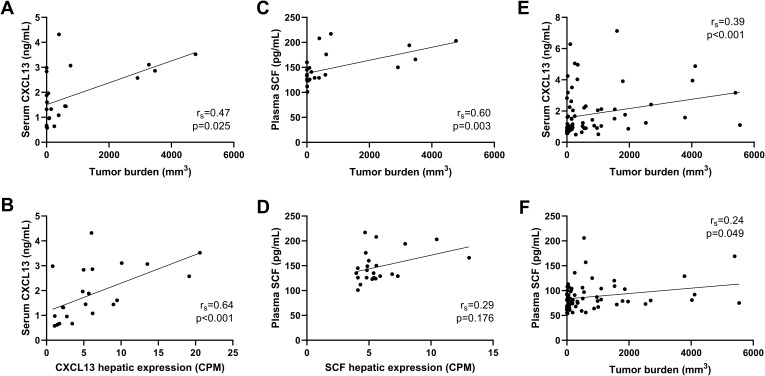
Methods & results: Sequencing of stool 16S and hepatic RNA was performed on a first set of mice. Among all liver histology parameters measured, the strongest association with microbiome composition changes was with the number of tumors detected at necropsy, followed by inflammation. The gut microbiome of mice with more than 2 tumors was enriched with Lachnospiraceae UCG and depleted of Palleniella intestinalis and Odoribacter. In contrast, hepatic transcriptomic changes were most strongly associated with tumor burden, followed by liver fibrosis. The 840 differentially expressed genes correlating with tumor burden were enriched in leukocyte extravasation and interleukin 10 receptor A (IL10RA) pathways. In addition, the abundance of Spp1-high epithelial cells is correlated with tumor burden. Association between tumor number and depletion of Palleniella intestinalis, and between tumor burden and circulating levels of C-X-C motif chemokine ligand 13 (CXCL13) and stem cell factor (SCF), was further validated in an independent set of mice.

Conclusion: We identified microbiome components contributing to liver carcinogenesis by inducing inflammation, and changes in hepatic gene expression and hepatic cells distribution that contribute to tumor growth. Such information can be highly valuable for the development of new prevention strategies as well as of new biomarkers for risk modeling in HCC.

Keywords: MASLD; cancer risk biomarkers; liver cancer; microbiome.


Conflict of interest statement

The authors have declared that no conflict of interests exists in this work.

Figures

Figure 1
Figure 1
Liver tumor and liver histology characteristics for the 25 HepPten female mice. (A) Scatterplot showing number of tumors and tumor burden per mouse observed in 25 HepPten female mice. Liver histological parameter scores for (B) liver fibrosis, bile ductular reaction and for (C) MASH parameters in these 25 mice. Median and range bars are shown.
Figure 2
Figure 2
Relationship between stool microbiome profiles and liver parameters. (A) PCoA plot of stool microbiome profiles from 23 female HepPten- mice, based on weighted UniFrac distances. Samples are grouped by PAM clusters. (B) Triplot of the weighted UniFrac distance-based RDA, which was performed to assess the relationship between selected liver parameters (explanatory variables) and the stool microbiome profiles. p-values and % variance explained with the ANOVA-like significance test of the model and the marginal test of the explanatory variables, are shown.
Figure 3
Figure 3
Bacterial taxa with altered abundance in mice with high tumor numbers. (A) Cladogram showing bacterial taxa with significantly different abundances between mice with high (>2) and low tumor (≤2) numbers, as assessed by the LEfSe algorithm. Classifications at the phylum (p_), class (c_), order (o_), family (f_), genus (g_), and species (s_) levels are shown. (B) Corresponding volcano plots showing all taxa that are significantly depleted or enriched in mice with a high tumor number, with taxa labelled as in the cladogram. Significance (p<0.05) was assessed using a Mann–Whitney test. The x-axis represents the base 2 log of the fold change (high/low); the y-axis represents the negative base 10 log of the p-value for each taxon. (C) Spearman correlation matrix between tumor number and significant taxa from the LEfSe analyses. + indicates a significant correlation (p<0.05).
Figure 4
Figure 4
Relationship between Palleniella intestinalis concentration and tumor number in mice in discovery and validation groups. Scatterplots showing Spearman correlation between the concentrations of Palleniella intestinalis and tumor number in (A) the HepPten discovery female mice group, and (B) the HepPten validation female mice group. Spearman correlation p-values and rank correlation coefficients are shown.
Figure 5
Figure 5
Relationship between liver transcriptome profiles and tumor growth. (A) PCoA plot of liver RNAseq gene expression from the same 25 female HepPten mice. Samples are grouped by PAM clusters. (B) Triplot of the gene expression RDA, which was performed to assess the relationship between selected liver parameters (explanatory variables) and the liver RNAseq data. p-values and % variance explained with the ANOVA-like significance test of the model and the marginal test of the explanatory variables, are shown. (C) Volcano plot showing the 840 DEGs identified in the liver of mice by DESeq2, all significantly correlated with tumor burden. 706 DEGs were enriched (colored in yellow) in mice with high tumor burden while the remaining 134 DEGs were depleted (colored in blue) in mice with high tumor burden. The base 2 log of the fold change (high/low) was graphed on the x-axis while the negative base 10 log of the DESeq2 adjusted p-values were graphed on the y-axis. Genes that were labeled represent the genes that were most depleted or most enriched. (D) Bar graph (left) showing the significant p-values for 5 canonical pathways enriched by DEGs with tumor burden as determined by IPA analysis and a bar graph (right) showing the significant p-values for 5 upstream regulators.
Figure 6
Figure 6
Relationship between hepatic cell types and tumor burden in discovery mice. (A) Cellular distribution of cell-types (relative percent) in the liver of the 25 discovery mice with high tumor burden (11 left-most vertical bars) versus low tumor burden (14 right-most vertical bars). Cell deconvolution analysis with a mouse liver matrix was used. (B) Scatterplots showing Spearman correlation between tumor burden and the presence of Kupffer cells (left), between tumor burden and the presence of Spp1-high epithelial cells (center), and between tumor burden and the presence of Fabp1 hepatocytes (right). Spearman correlation p-values and rank correlation coefficients are shown.
Figure 7
Figure 7
Significant association between tumor burden and protein biomarkers CXCL13 and SCF. (A) Scatterplot showing correlation between tumor burden (mm3) and serum CXCL13 protein concentration (ng/mL) in the HepPtendiscovery female mice set. (B) Correlation between CXCL13 hepatic expression using RNA sequencing measured in adjusted counts per million (CPM) and serum CXCL13 protein concentration (ng/mL) from the HepPten discovery female mice set. (C) Scatterplot showing correlation between tumor burden (mm3) and SCF plasma protein concentration (pg/mL) in the HepPten discovery female mice set. (D) Correlation between SCF hepatic expression using RNA sequencing measured in adjusted counts per million (CPM) and SCF plasma protein concentration (pg/mL) from the HepPten discovery female mice set. (E) Correlation between tumor burden and serum CXCL13 protein concentration (ng/mL) in the HepPten validation female mice set. (F) Correlation between tumor burden and SCF plasma protein concentration (pg/mL) in the HepPten validation female mice set. Spearman correlation was used for all six plots. Spearman correlation p-values and rank correlation coefficients are shown. p<0.05 was considered significant.

Similar articles

References

    1. Younossi ZM, Marchesini G, Pinto-Cortez H, Petta S. Epidemiology of nonalcoholic fatty liver disease and nonalcoholic steatohepatitis: implications for liver transplantation. Transplantation. 2019;103(1):22–27. doi:10.1097/TP.0000000000002484 - DOI - PubMed
    1. Younossi ZM, Blissett D, Blissett R, et al. The economic and clinical burden of nonalcoholic fatty liver disease in the United States and Europe. Hepatol. 2016;64(5):1577–1586. doi:10.1002/hep.28785 - DOI - PubMed
    1. Younossi ZM, Koenig AB, Abdelatif D, Fazel Y, Henry L, Wymer M. Global epidemiology of nonalcoholic fatty liver disease-Meta-analytic assessment of prevalence, incidence, and outcomes. Hepatol. 2016;64(1):73–84. doi:10.1002/hep.28431 - DOI - PubMed
    1. Estes C, Anstee QM, Arias-Loste MT, et al. Modeling NAFLD disease burden in China, France, Germany, Italy, Japan, Spain, United Kingdom, and United States for the period 2016-2030. J Hepatol. 2018;69(4):896–904. doi:10.1016/j.jhep.2018.05.036 - DOI - PubMed
    1. Siegel RL, Miller KD, Jemal A. Cancer statistics, 2019. Ca a Cancer J Clinicians. 2019;69(1):7–34. - PubMed

LinkOut - more resources