. 2024 Oct 2;12(10):e009617.
doi: 10.1136/jitc-2024-009617.

Cancer cell-specific PD-L1 expression is a predictor of poor outcome in patients with locally advanced oral cavity squamous cell carcinoma

Affiliations

Cancer cell-specific PD-L1 expression is a predictor of poor outcome in patients with locally advanced oral cavity squamous cell carcinoma

Minyu Wang et al. J Immunother Cancer. .

Abstract

Background: Locally advanced oral cavity squamous cell carcinoma (OCSCC) presents a significant clinical challenge despite being partially responsive to standard treatment modalities. This study investigates the prognostic implications of programmed death-ligand 1 (PD-L1) expression in these tumors, focusing on its association with treatment outcomes and the immune microenvironment.

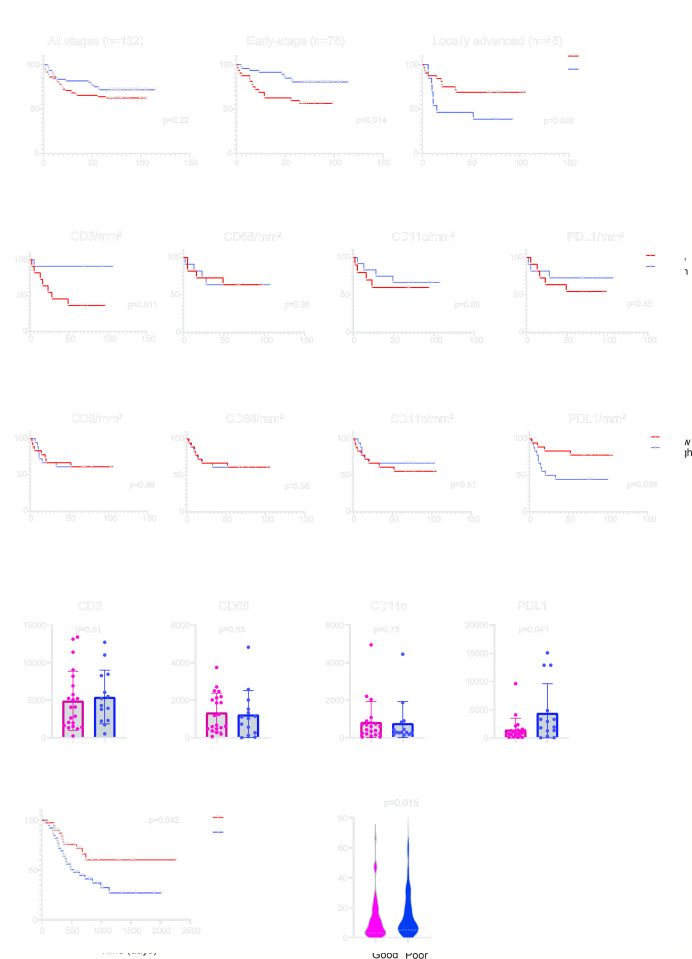
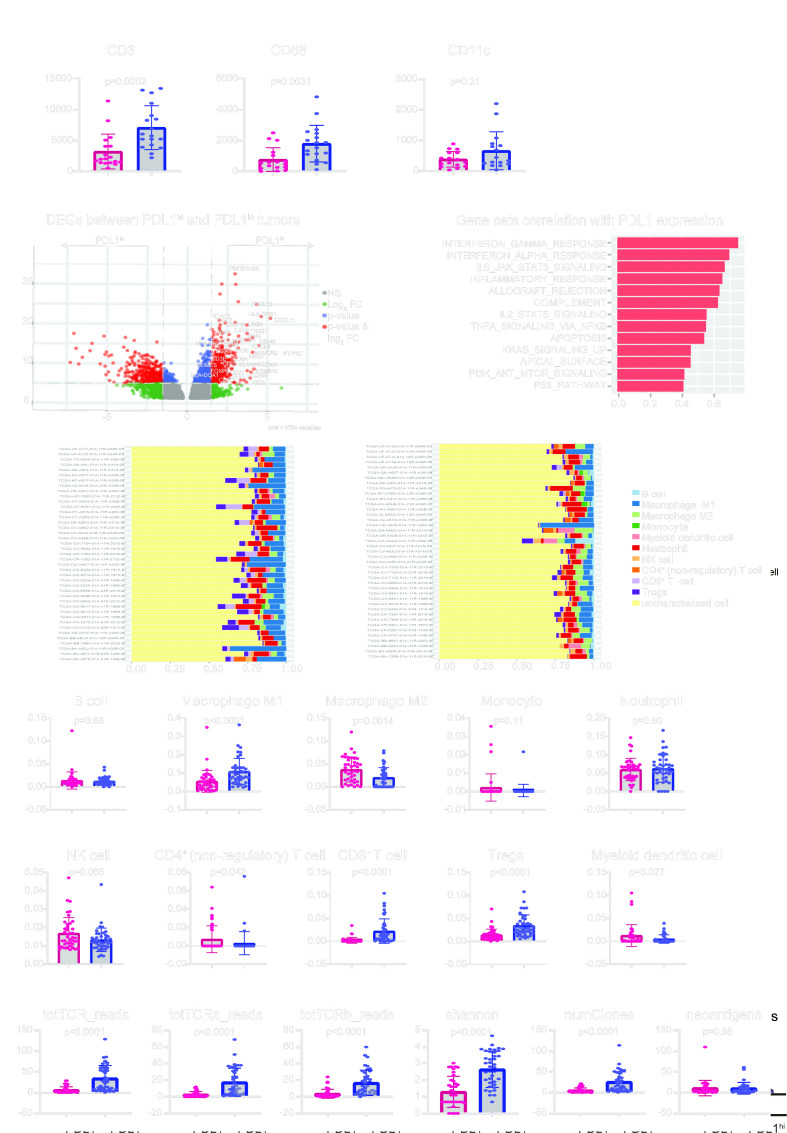
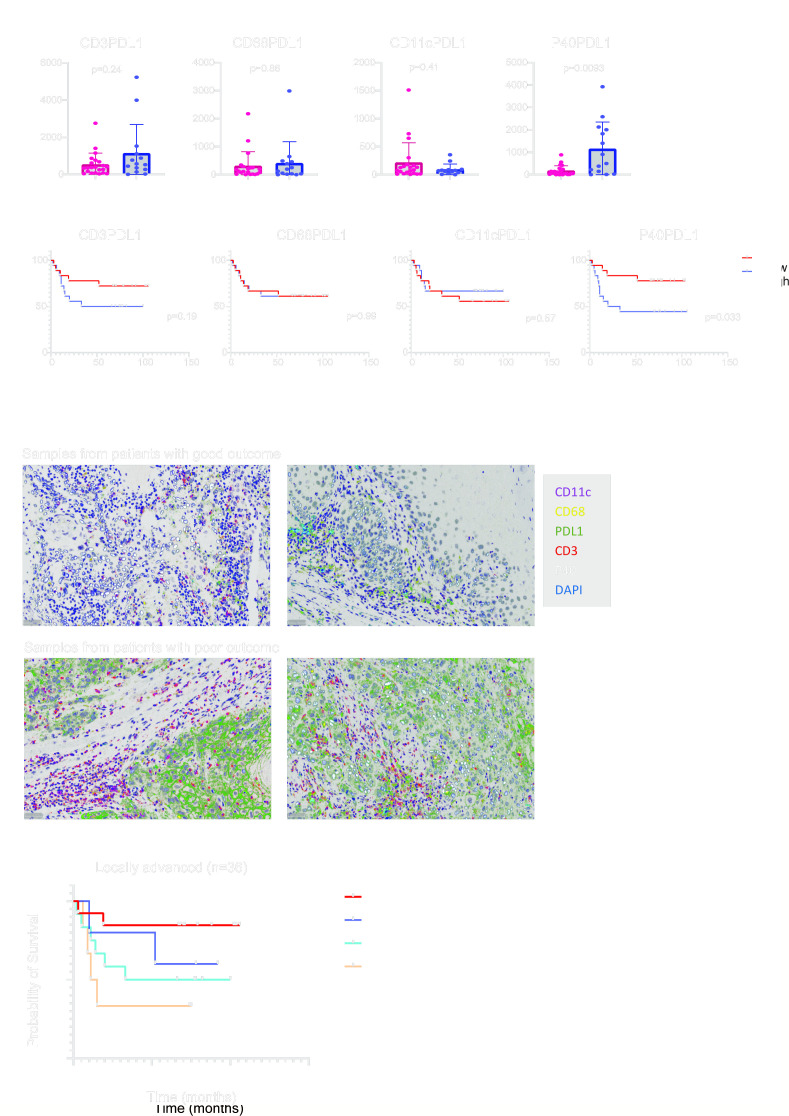
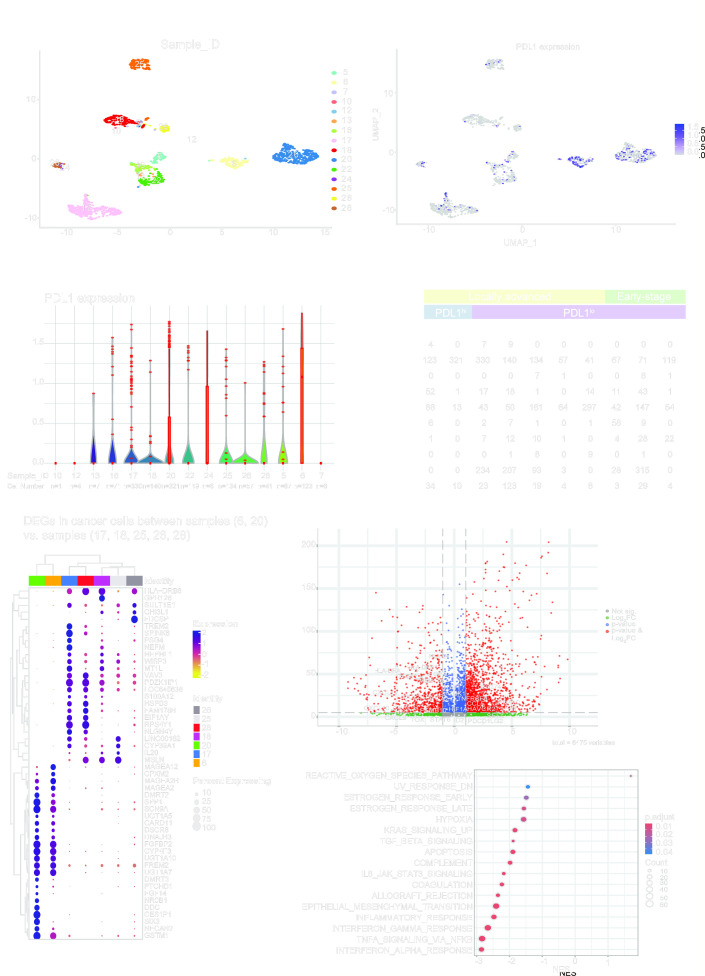
Methods: We assessed tumor-infiltrating lymphocytes (TILs) in 132 patients with OCSCC to evaluate their impact on survival. Multiplex immunohistochemistry staining for CD3, CD68, CD11c, PD-L1, and P40 was used to explore correlations with clinical outcomes in patients with early-stage (n=22) and locally advanced (n=36) OCSCC. These initial findings were validated through differential gene expression analysis, gene set enrichment, and immune cell deconvolution in a The Cancer Genome Atlas cohort of 163 locally advanced OCSCC tumors. Additionally, single-cell RNA sequencing (scRNA-seq) on a smaller cohort (n=10) further characterized the PD-L1hi or PD-L1lo cancer cells in these tumors.

Results: Elevated PD-L1 expression was associated with poor outcomes in patients with locally advanced OCSCC undergoing standard adjuvant therapy, irrespective of "hot" or "cold" classification based on TILs assessment. PD-L1hi tumors exhibited an active immune response phenotype, enriched with M1 macrophages, CD8+ T cells and T regulatory cells in the tumor microenvironment. Notably, the negative impact of PD-L1 expression on outcomes was primarily attributed to its expression by cancer cells, rather than immune cells. Furthermore, scRNA-seq revealed that immune interactions were not essential for PD-L1 upregulation in cancer cells, instead, complex regulatory networks were involved. Additionally, PD-L1lo locally advanced tumors exhibited more complex pathway enrichment and diverse T-cell populations compared with those in the early-stage.

Conclusion: Our findings underscore the prognostic significance of PD-L1 expression in locally advanced OCSCC, and unveil the complex interplay between PD-L1 expression, immune responses, and molecular pathways in the tumor microenvironment. This study provides insights that may inform future therapeutic strategies, including the possibility of tailored immunotherapeutic approaches for patients with PD-L1hi locally advanced OCSCC.

Keywords: Adjuvant; Head and Neck Cancer; Immune Checkpoint Inhibitor; Radiotherapy/Radioimmunotherapy; Tumor Microenvironment.


Conflict of interest statement

Competing interests: No, there are no competing interests.

Figures

Figure 1
Figure 1. Elevated PD-L1 expression in locally advanced OCSCC indicates poor outcome. (A) Survival stratification based on stromal TILs (sTILs) assessment on H&E slides from patients with OCSCC with all stages (n=132), early-stage (n=78) or locally advanced stage (n=45). (B) Survival stratification based on CD3+, CD68+, CD11c+ or PD-L1+ cell densities (per mm2 in early-stage OCSCC (n=22). (C) Survival stratification based on CD3+, CD68+, CD11c+ or PD-L1+ cell densities (per mm2 in locally advanced OCSCC (n=36). (D) Differences of CD3+, CD68+, CD11c+ or PD-L1+ cell densities (per mm2 between patients with good or poor outcomes in locally advanced OCSCC (n=36). (E) Survival differences between PD-L1hi (top 25% n=41) and PD-L1lo (bottom 25% n=41) in the TCGA—locally advanced OCSCC cohort. (F) Differences in PD-L1 messenger RNA expression between patients with good or poor outcomes in the TCGA—locally advanced OCSCC cohort (n=163). Data are expressed as mean±SEM. OCSCC, oral cavity squamous cell carcinoma; PD-L1, programmed death ligand 1; TCGA, The Cancer Genome Atlas; TILs, tumor-infiltrating lymphocytes.
Figure 2
Figure 2. PD-L1hi tumors demonstrate an active immune response in the tumor microenvironment in locally advanced OCSCC. (A) Differences in CD3+, CD68+ and CD11c+ cells densities (per mm2 between PD-L1hi (n=18) and PD-L1lo (n=18) locally advanced OCSCC. (B) Differentially expressed genes between PD-L1hi (n=41) and PD-L1lo (n=41) samples from the TCGA—locally advanced OCSCC cohort. (C) Spearman’s correlation was performed to assess the correlations between individual hallmark gene sets and PD-L1 mRNA expression. Gene sets with rho values above 0.40 were illustrated. (D) Differences in immune cell composition using quanTIseq deconvolution analysis between PD-L1hi (n=41, left) and PD-L1lo (n=41, right) samples. (E) Differences of B cell, M1, M2, monocyte, neutrophil, NK cell, CD4+ non-regulatory cell, CD8+ T cell, Tregs, and myeloid dendritic cell populations between PD-L1hi (n=41) and PD-L1lo (n=41) samples using quanTIseq method. (F) Differences of total TCR, TCR-α, and TCR-β reads, Shannon’s entropy index, number of clones and neoantigens between PD-L1hi (n=41) and PD-L1lo (n=41) samples. Data are expressed as mean±SEM. DEGs, differentially expressed genes; FDR, false discovery rate; NK cell, natural killer cell; OCSCC, oral cavity squamous cell carcinoma; PD-L1, programmed death ligand 1; TCGA, The Cancer Genome Atlas; TCR, T-cell receptor; Tregs, T regulatory cells.
Figure 3
Figure 3. PD-L1 expression on the cancer cells, not immune cells, is associated with poor outcomes in the locally advanced OCSCC. (A) Differences in CD3+PD-L1+, CD68+PD-L1+, CD11c+PD-L1+ and P40+PD-L1+ cell densities (per mm2 between patients with good and poor outcomes (n=36). (B) Survival stratification based on CD3+PD-L1+, CD68+PD-L1+, CD11c+PD-L1+ and P40+PD-L1+ cell densities (per mm2 in locally advanced OCSCC (n=36). (C) Examples of multiplex staining for CD11c (magenta), CD68 (yellow), PD-L1 (green), CD3 (red) and P40 (white) in patients with good (n=2) and poor (n=2) outcomes. Scale bar, 50 µm. (D) Survival stratification based on stromal TILs (sTILs) and PD-L1 densities in locally advanced OCSCC tumors (n=36). Data are expressed as mean±SEM. OCSCC, oral cavity squamous cell carcinoma; PD-L1, programmed death ligand 1; TILs, tumor-infiltrating lymphocytes.
Figure 4
Figure 4. Complex regulatory networks other than immune interactions are involved in PD-L1 expression on cancer cells in locally advanced tumors. (A) Cancer cell clusters based on sample IDs from the single cell RNA sequencing cohort. (B) PD-L1 expression on individual cancer cells from different tumor samples. (C) Violin plot of PD-L1 expression on individual cancer cells from different tumor samples. (D) Single-cell compositions in the samples (n=10) with evaluable cancer cells (cell number >10). (E) Top 50 differentially expressed genes (DEGs) in cancer cells between samples 6 and 20 (PD-L1hi locally advanced tumors) and samples 17,18, 25, 26 and 28 (PD-L1lo locally advanced tumors). (F) Volcano plot of 6,475 variables from the comparison in panel E with immune-related genes labeled. (G) Enriched hallmark gene set analysis of DEGs from the comparison in panel E. NES, normalized enrichment score; PD-L1, programmed death ligand 1; UMAP, uniform manifold approximation and projection.
Figure 5
Figure 5. More complex pathway enrichment and diverse T cells in PD-L1lo locally advanced tumors compared with early-stage ones. (A) Top 50 differentially expressed genes (DEGs) in cancer cells between samples 5, 16 and 22 (PD-L1 lo early-stage tumors) and samples 17,18, 25, 26 and 28 (PD-L1lo locally advanced tumors). (B) Volcano plot of 1,572 variables from the comparison in panel A with immune-related genes labeled. (C) Enriched hallmark gene set analysis of DEGs from the comparison in panel A. (D) Composition of cell phenotypes of T cells from samples 17, 18 and 25 (PD-L1lo locally advanced tumors) using the Monaco method. (E) Composition of cell phenotypes of T cells from samples 5 and 16 (PD-L1lo early-stage tumors) using the Monaco method. (F) Differences in T-cell composition between PD-L1lo locally advanced tumors (samples 17, 18 and 25) and PD-L1lo early-stage tumors (samples 5 and 16). NES, normalized enrichment score; PD-L1, programmed death ligand 1; Th cells: T helper cells; UMAP, uniform manifold approximation and projection; Vd2 gd T cells: V-delta 2 gamma delta T cell.

Similar articles

References

    1. Dhar H, Vaish R, D’Cruz AK. Management of locally advanced oral cancers. Oral Oncol. 2020;105:104662. doi: 10.1016/j.oraloncology.2020.104662. - DOI - PubMed
    1. Kim D, Li R. Contemporary treatment of locally advanced oral cancer. Curr Treat Options Oncol. 2019;20:32. doi: 10.1007/s11864-019-0631-8. - DOI - PubMed
    1. Cohen EEW, Bell RB, Bifulco CB, et al. The society for immunotherapy of cancer consensus statement on immunotherapy for the treatment of squamous cell carcinoma of the head and neck (HNSCC) J Immunother Cancer. 2019;7:184. doi: 10.1186/s40425-019-0662-5. - DOI - PMC - PubMed
    1. Ferris RL, Blumenschein G, Jr, Fayette J, et al. Nivolumab for recurrent squamous-cell carcinoma of the head and neck. N Engl J Med. 2016;375:1856–67. doi: 10.1056/NEJMoa1602252. - DOI - PMC - PubMed
    1. Mehra R, Seiwert TY, Gupta S, et al. Efficacy and safety of pembrolizumab in recurrent/metastatic head and neck squamous cell carcinoma: pooled analyses after long-term follow-up in KEYNOTE-012. Br J Cancer. 2018;119:153–9. doi: 10.1038/s41416-018-0131-9. - DOI - PMC - PubMed

MeSH terms