. 2024 Oct 2;20(10):e1011433.
doi: 10.1371/journal.pgen.1011433. eCollection 2024 Oct.

Yeast Nat4 regulates DNA damage checkpoint signaling through its N-terminal acetyltransferase activity on histone H4

Affiliations

Yeast Nat4 regulates DNA damage checkpoint signaling through its N-terminal acetyltransferase activity on histone H4

Mamantia Constantinou et al. PLoS Genet. .

Abstract

The DNA damage response (DDR) constitutes a vital cellular process that safeguards genome integrity. This biological process involves substantial alterations in chromatin structure, commonly orchestrated by epigenetic enzymes. Here, we show that the epigenetic modifier N-terminal acetyltransferase 4 (Nat4), known to acetylate the alpha-amino group of serine 1 on histones H4 and H2A, is implicated in the response to DNA damage in S. cerevisiae. Initially, we demonstrate that yeast cells lacking Nat4 have an increased sensitivity to DNA damage and accumulate more DNA breaks than wild-type cells. Accordingly, upon DNA damage, NAT4 gene expression is elevated, and the enzyme is specifically recruited at double-strand breaks. Delving deeper into its effects on the DNA damage signaling cascade, nat4-deleted cells exhibit lower levels of the damage-induced modification H2AS129ph (γH2A), accompanied by diminished binding of the checkpoint control protein Rad9 surrounding the double-strand break. Consistently, Mec1 kinase recruitment at double-strand breaks, critical for H2AS129ph deposition and Rad9 retention, is significantly impaired in nat4Δ cells. Consequently, Mec1-dependent phosphorylation of downstream effector kinase Rad53, indicative of DNA damage checkpoint activation, is reduced. Importantly, we found that the effects of Nat4 in regulating the checkpoint signaling cascade are mediated by its N-terminal acetyltransferase activity targeted specifically towards histone H4. Overall, this study points towards a novel functional link between histone N-terminal acetyltransferase Nat4 and the DDR, associating a new histone-modifying activity in the maintenance of genome integrity.


Conflict of interest statement

The authors have declared that no competing interests exist.

Figures
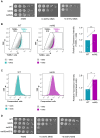
Fig 1
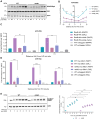
Fig 1. Lack of Nat4 increases sensitivity to DNA damage.
A) Phenotypic analysis of wild-type or nat4-deleted yeast cells by spotting serial dilutions of logarithmically growing cells onto plates containing nutrient-rich medium, with or without the addition of increasing concentrations of DNA-damaging agent methyl methanesulfonate (MMS), as indicated. Rad52 single mutant (rad52Δ) was used as a control of DNA damage sensitivity. Plates were incubated at 30°C for 2–3 days and images were captured to assess growth and viability. B) Representative TUNEL assay scatter plots of wild-type (WT) and nat4Δ cells treated with 0.1% MMS for 2h and analyzed by flow cytometry. TUNEL+ wild-type (turquoise) and nat4Δ (purple) cells are defined by the shift of the population on the x-axis when overlapped with the untreated (-MMS) control cells (grey) of each strain (left and middle panels). Relative fluorescence intensity of TUNEL+ cells was determined by the ratio of the mean fluorescence intensity (MFI) of the test samples to the MFI of the corresponding internal negative control of each test sample (right panel). Error bars represent standard error of the mean (SEM) of three independent experiments. ***P < 0.001; calculated by paired two-tailed Student’s t-test. C) Representative histograms of wild-type (WT) and nat4Δ cells treated with 0.1% MMS for 5h and stained with Live/Dead dye before analysis by flow cytometry. Wild-type (turquoise) or nat4Δ (purple) cells with compromised membranes are defined by the shift of the population on the x-axis when overlapped with the untreated control cells (grey) of each strain (left and middle panels). Quantification of the relative fluorescence intensity of compromised cells was determined by the ratio of the MFI of the treated samples to the MFI of the corresponding untreated control cells of each test sample (right panel). Error bars represent SEM of three independent experiments. **P < 0.01; calculated by ratio paired two-tailed Student’s t-test. D) Serial-fold serial dilutions of log-phase yeast cells were spotted onto plates with 0.003% and 0.005% MMS to study the genetic assessment of nat4-deleted cells with rad51 single and double mutant. Plates were incubated at 30°C for 2–3 days and images were captured to assess growth and viability.
Fig 2
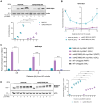
Fig 2. Nat4 expression is induced upon MMS treatment and it is recruited to an HO-induced DSB.
A) Expression levels of Nat4 analyzed by qRT–PCR using total RNA extracted from wild-type (WT), NAT4p-Nat4-HA and STE5p-Nat4-HA strains grown in YPD (t = 0) and treated with 0.1% MMS for 1, 3 and 9 hours (h). NAT4 mRNA levels were normalized to ACT1. Error bars represent SEM of three independent experiments. *P < 0.05, ****P < 0.0001; calculated by unpaired two-tailed Student’s t-test. B) Left panel demonstrates a representative immunoblot showing Nat4-HA protein levels in untreated controls and cells treated with 0.1% MMS for 1, 3, and 9 hours. Nat4 is tagged with a hemagglutinin (HA) epitope for detection, and a wild-type untagged strain was used to validate antibody specificity. Actin serves as a loading control. Right plot shows the quantification of Nat4-HA protein levels normalized to actin, demonstrating changes in Nat4 expression upon MMS treatment over time. Error bars represent SEM of three independent experiments. **P < 0.01, ****P < 0.0001; calculated by two-way ANOVA, Sidak’s multiple comparisons test. C) Illustration depicting the HO cut-site at the MAT locus. HO endonuclease expression is under the control of the GAL1 promoter and can be induced upon galactose addition to form a DSB at the MAT locus. The respective strain carrying the construct is null for both the HML and HMR loci, as indicated, that normally serve as donor templates, making the localized DSB unrepairable. ChIP analysis was performed with primers flanking the HO cut-site at 0.6, 2, 3, 7 and 10kb for the analysis of DDR factors recruitment and DNA damage-induced histone modifications enrichment at the break. D) ChIP analysis for Nat4-HA and nat4(E186Q)-HA strains after 3 hours of GAL::HO endonuclease induction in galactose (GAL). Uninduced conditions represent cells exposed to raffinose (RAFF), in which HO is not expressed. A wild-type (WT) untagged strain served as a control for the specificity of the anti-HA antibody used in ChIP. Quantification of the ChIP signal is presented as the ratio of the 0.6, 2 or 3kb signals to the corresponding input of each strain and then normalized to the same ratio of the uncleaned site at SMC2. Error bars represent SEM of two independent experiments. ****P < 0.0001; calculated by two-way ANOVA, Dunnett’s multiple comparisons test.
Fig 3
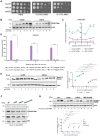
Fig 3. Nat4 regulates the DNA damage checkpoint signaling cascade.
A) Wild-type (WT) and nat4Δ cells were assessed in a time-course of 9 hours after 0.1% MMS treatment and a representative immunoblot is shown for the global levels of H2AS129ph. Total histone H2A and β-actin levels were used as a loading control between extracts. B) ChIP-qPCR showing H2AS129ph distribution surrounding the HO-induced double-strand break (DSB). Cells were grown in overnight until log phase, followed by addition of either raffinose (RAFF) as control or galactose (GAL) in order to induce DSB for 3h before chromatin cross-linking. Primer pairs flanking right and left of the DSB at the MAT locus at sites 3, 7, and 10kb, were used for qPCR. Anti-H4 signal was used to normalize for histone occupancy. The ratio of H2AS129ph/H4 at the MAT locus was normalized to the corresponding signal at the chromosome V intergenic control locus. Data represents the mean of two independent biological replicates. Error bars represent SEM of two independent experiments. **P < 0.01, ***P < 0.001, ****P < 0.0001; calculated by two-way ANOVA, Tukey’s multiple comparisons test. C) ChIP analysis was performed in wild-type (WT) and nat4Δ cells carrying Rad9 tagged with HA (Rad9-HA) following a 3-hour induction of GAL::HO endonuclease in galactose (GAL). Uninduced conditions depict cells exposed to raffinose (RAFF), where HO expression is absent. Isogenic WT cells lacking the HA tag were assessed in parallel to control for HA antibody specificity. Quantification of ChIP signals are shown as the ratio of enrichment at 3kb away from the right and left side of the break compared to the corresponding input of each strain, and normalized against the uncut SMC2 locus. Error bars represent SEM from two independent experiments. **P < 0.0001; calculated by two-way ANOVA, Sidak’s multiple comparisons test. D) ChIP analysis after 3 hours of an HO galactose-induced DSB for the examination of myc-tagged Mec1 recruitment in wild-type and nat4Δ cells after growing in raffinose (RAFF) as control or galactose (GAL) for DSB induction. Myc-tagged Mec1 recruitment was examined at 0.6, 2 and 3kb away from the HO cut-site and normalized to the signal of the uncut locus SMC2. A WT untagged strain was used as control for the specificity of the anti-myc antibody. Error bars represent SEM of two independent experiments. ****P < 0.0001; calculated by two-way ANOVA, Dunnett’s multiple comparisons test. E) In the left panel, wild-type and nat4Δ cells treated with 0.1% MMS up to 5 hours were immunoblotted for the detection of Rad53 phosphorylation. In t = 0, Rad53 is found in its unphosphorylated form in the absence DNA damage. β-actin was used as control for equal loading. In the right panel, quantification of Rad53 phosphorylation was initially normalized relative to total Rad53 levels, followed by normalization to actin, and subsequently to the untreated condition. Error bars represent SEM of three independent experiments. Ns > 0.05, *P > 0.05, ***P < 0.001, ****P < 0.0001; calculated by two-way ANOVA, Sidak’s multiple comparisons test.
Fig 4
Fig 4. Nat4 N-terminal acetyltransferase activity is necessary for the activation of both the DDR and downstream checkpoint.
A) HA-tagged wild-type Nat4 (Nat4-HA) and catalytically mutant Nat4 (nat4(E186Q)-HA) cells were treated with or without MMS for up to 9 hours and whole cell extracts were immunoblotted to detect the phosphorylation levels of H2AS129. β-actin was used as equal loading control among cell extracts. Quantification of H2AS129ph levels normalized to β-actin, is presented in the accompanying graph below. Error bars represent SEM of three independent experiments. * P < 0.05, **** P < 0.0001; calculated by two-way ANOVA, Sidak’s multiple comparisons test. B) Site-specific investigation of H2AS129ph at regions 3, 7 and 10 kb flanking right and left of the HO galactose-induced DSB through ChIP-qPCR in cells carrying either HA-tagged wild-type nat4 (Nat4-HA) or catalytically mutant Nat4 (nat4(E186Q)-HA). Cells were grown in either raffinose (RAFF) control or galactose (GAL) induced condition. H2AS129ph enrichment was normalized first to histone H4 signal at the MAT locus and then to the chromosome V intergenic control locus. Error bars represent SEM of two independent experiments. *P < 0.05, ****P < 0.0001; calculated by two-way ANOVA, Dunnett’s multiple comparisons test. C) ChIP analysis for myc-tagged Mec1 enrichment in cells containing HA tagged wild-type Nat4 (Nat4-HA myc-Mec1) or catalytically mutant Nat4 (nat4(E186Q)-HA myc-Mec1) grown for 3 hours in raffinose (RAFF) control conditions or galactose-induced (GAL) HO DSB formation at the MAT locus. Myc-tagged Mec1 recruitment was examined at 0.6, 2 and 3 kb away from the HO cut-site and normalized to the signal of the uncut locus SMC2. A wild-type parental untagged (WT) strain was used as a control for the specificity of the anti-myc antibody. Error bars represent SEM of two independent experiments. ****P < 0.0001; calculated by two-way ANOVA, Dunnett’s multiple comparisons test. D) Representative immunoblot of Rad53 phosphorylation after MMS treatment. Cells bearing HA tagged wild-type Nat4 (Nat4-HA) or HA tagged catalytically inactive Nat4 (nat4(E186Q)-HA) were treated with 0.1% MMS for 1 to 5 hours. At t = 0, in untreated cells, Rad53 is present only in its unphosphorylated state. β-actin was used as a loading control between cell extracts. In the right panel, quantification of Rad53 phosphorylation was first normalized to total Rad53, then to actin, and finally to the untreated condition. Error bars represent the SEM from three independent experiments. Statistical significance was determined using two-way ANOVA with Sidak’s multiple comparisons test (***P < 0.001, ****P < 0.0001).
Fig 5
Fig 5. hNAA40 rescues the DDR signaling defects of NAT4-deletion.
A) Yeast cells having NAT4 deleted, and ectopically expressing the human NAA40 homolog (nat4Δ::hNAA40), as well as their isogenic wild-type (WT) strain were assessed during a 9 hour-treatment with 0.1% MMS. Whole cell extracts were analyzed by western blotting using an antibody against H2AS129ph. Equal loading was monitored using β-actin. B) Wild-type and nat4Δ::hNAA40 cells were exposed to 0.1% MMS for up to 5 hours. Whole yeast cell extracts were prepared and immunoblotted for Rad53 phosphorylation. The unphosphorylated form of Rad53 is apparent in t = 0 where cells are untreated and the DNA damage checkpoint is not activated. An antibody against β-actin was used as a loading control. On the right, Rad53 phosphorylation quantification was normalized sequentially to total Rad53, actin, and the untreated condition. Error bars represent the SEM from three independent experiments. Ns > 0.05; calculated by two-way ANOVA, Sidak’s multiple comparisons test.
Fig 6
Fig 6. Nat4 regulates DDR signaling through its N-terminal activity towards histone H4.
A) Phenotypic assessment of H4-WT and H4S1A mutant yeast cells by spotting serial dilutions of logarithmically growing cells onto nutrient-rich medium plates, with two increasing concentrations of the DNA-damaging agent methyl methanesulfonate (MMS) or without (-MMS). Rad52 single mutant (rad52Δ) served as a control for DNA damage sensitivity. Plates were incubated at 30°C for 2–3 days and viability was evaluated through image capture. B) Representative immunoblot of whole cell extracts that were prepared from H4S1A mutant and isogenic wild-type (H4-WT) cells treated with 0.1% MMS for up to 9h and immunoblotted with anti-H2AS129ph antibody. β-actin was used as equal loading control. C) Locus-specific ChIP enrichment of H2AS129ph at regions 3, 7 and 10kb flanking right and left of the HO galactose-induced DSB at MAT in H4S1A mutant or isogenic wild-type (H4-WT) cells. Cells grown in raffinose (RAFF) were the uninduced control condition. H2AS129ph enrichment was normalized to histone H4 signal at the MAT locus and the chromosome V intergenic control locus. Error bars show SEM of two independent experiments. **P < 0.01, ***P < 0.001, ****P < 0.0001; calculated by two-way ANOVA, Dunnett’s multiple comparisons test. D) ChIP analysis after 3 hours of an HO galactose-inducible DSB to examine myc-tagged Mec1 recruitment in wild-type (H4-WT myc-Mec1) and H4S1A mutated (H4S1A myc-Mec1) cells. Cells were grown either under raffinose (RAFF) non-induced control or galactose (GAL) inducible conditions. Myc-tagged Mec1 recruitment was investigated at 0.6, 2 and 3kb away from the HO cut-site and normalized to the signal of the uncut locus SMC2. An isogenic wild-type untagged (WT) strain was used as control for assessment of the specificity of the anti-myc antibody. Error bars represent SEM of two independent experiments. ****P < 0.0001; calculated by two-way ANOVA, Dunnett’s multiple comparisons test. E) Representative immunoblot of cells expressing either H4S1A mutant, or isogenic wild-type (H4-WT), or deleted for NAT4 (nat4Δ) were treated with 0.1% MMS and collected at the indicated time points up to 5 hours to detect Rad53 phosphorylation levels. β-actin was used to assure equal loading between extracts. The accompanying bottom graph represents the quantification of Rad53 phosphorylation levels that were normalized in sequence to total Rad53, actin, and then to the untreated condition. Error bars represent the SEM from three independent experiments. ****P < 0.0001; calculated by two-way ANOVA, Sidak’s multiple comparisons test. F) Wild-type (WT), nat4Δ, H4S1A and combination mutant H4S1Anat4Δ cells were assessed in a time-course of 9 hours after 0.1% MMS treatment and a representative immunoblot is shown for the global levels of H2AS129ph. β-actin levels were used as a loading control between extracts. G) In the upper panel, WT, nat4Δ, H4S1A and double mutant H4S1Anat4Δ cells treated with 0.1% MMS up to 5 hours were immunoblotted for the detection of Rad53 phosphorylation. In t = 0, Rad53 is found in its unphosphorylated form in the absence of DNA damage. β-actin was used as control for equal loading. In the lower panel, quantification of Rad53 phosphorylation was initially normalized relative to total Rad53 levels, followed by normalization to actin, and subsequently to the untreated condition. Error bars represent SEM of two independent experiments. ****P < 0.0001; calculated by two-way ANOVA, Tukey’s multiple comparisons test.
Fig 7
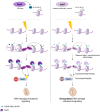
Fig 7. Model depicting the regulation of Nat4 in DNA damage checkpoint signaling.
In response to double-strand breaks (DSBs), several sequential events ensure activation of the DNA damage signaling cascade, requiring the presence of Nat4 and its N-terminal acetyltransferase activity towards histone H4 (left panel). In the absence of Nat4 or of its enzymatic activity (right panel) during the induction of DNA damage, Mec1 kinase recruitment to a DSB is reduced, which in turn results in decreased deposition of H2AS129ph around the break. Consequently, the reduced H2AS129ph sites, crucial for Rad9 recruitment, result in diminished Rad9 binding around the DSB. As a result, Rad53 phosphorylation, indicative of DNA damage checkpoint activation, is reduced. The deregulated DDR signaling and defective DNA damage checkpoint activation ultimately culminate to increased sensitivity to genotoxic damage and accumulated DNA breaks. Elements of the Fig 7 were created using BioRender.com (Agreement#_EA274VTBS7).

Similar articles

References

    1. Aksnes H, McTiernan N, Arnesen T. NATs at a glance. J. Cell Sci. 2023. Jul 15;136(14):jcs260766. doi: 10.1242/jcs.260766 - DOI - PubMed
    1. Ree R, Varland S, Arnesen T. Spotlight on protein N-terminal acetylation. Exp Mol Med. 2018. Jul;50(7):1–13. doi: 10.1038/s12276-018-0116-z - DOI - PMC - PubMed
    1. Demetriadou C, Koufaris C, Kirmizis A. Histone N-alpha terminal modifications: genome regulation at the tip of the tail. Epigenetics & Chromatin. 2020. Dec;13(1):29. doi: 10.1186/s13072-020-00352-w - DOI - PMC - PubMed
    1. Aksnes H, Drazic A, Marie M, Arnesen T. First Things First: Vital Protein Marks by N-Terminal Acetyltransferases. Trends Biochem Sci. 2016. Sep;41(9):746–60. doi: 10.1016/j.tibs.2016.07.005 - DOI - PubMed
    1. Song O kyu, Wang X, Waterborg JH, Sternglanz R. An N α-Acetyltransferase Responsible for Acetylation of the N-terminal Residues of Histones H4 and H2A. J. Biol. Chem. 2003. Oct;278(40):38109–12. - PubMed

MeSH terms

Grants and funding

This study was co-funded by the European Regional Development Fund and the Republic of Cyprus through the Research & Innovation Foundation (projects: EXCELLENCE/0421/0302, EXCELLENCE/0421/0342). The funders did not play any role in study design, data collection and analysis, decision to publish, or preparation of the manuscript.

LinkOut - more resources