. 2024 Oct 2;15(1):8515.
doi: 10.1038/s41467-024-52961-8.

A plasmonic biosensor pre-diagnostic tool for Familial Mediterranean Fever

Affiliations

A plasmonic biosensor pre-diagnostic tool for Familial Mediterranean Fever

Idil Karaca Acari et al. Nat Commun. .

Abstract

Familial Mediterranean Fever (FMF) is an autosomal recessive genetic disorder, primarily observed in populations around the Mediterranean Sea, linked to MEFV gene mutations. These mutations disrupt inflammatory responses, increasing pyrin-protein production. Traditional diagnosis relies on clinical symptoms, family history, acute phase reactants, and excluding similar syndromes with MEFV testing, which is expensive and often inconclusive due to heterozygous mutations. Here, we present a biosensor platform that detects differences in pyrin-protein levels between healthy and affected individuals, offering a cost-effective alternative to genetic testing. Our platform uses gold nanoparticle-based plasmonic chips enhanced with anti-pyrin antibodies, achieving a detection limit of 0.24 ng/mL with high specificity. The system integrates an optofluidic system and visible light spectroscopy for real-time analysis, with signal stability maintained for up to six months. Our technology will enhance FMF diagnosis accuracy, enabling early treatment initiation and providing a cost-effective alternative to genetic testing, thus improving patient care.


Conflict of interest statement

I.K.A., S.N.T., C.A., E.U., B.M., S.K., B.A., I.Y., T.S., and A.E.C. have a pending patent application for the pre-diagnostic technology presented in this paper. The remaining authors declare no competing interests.

Figures

Fig. 1
Fig. 1. Plasmonic biosensor platform designed for preliminary diagnosis of Familial Mediterranean Fever (FMF).
Schematic illustration shows the diagnosis of FMF based on the test results provided by the plasmonic biosensor and the clinical findings.
Fig. 2
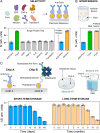
Fig. 2. Gold nanoparticle-based plasmonic chip utilized in the pre-diagnostic platform.
A Realization of plasmonic chips based on nanoparticle immobilization on a glass substrate using a synthesis and chemical modification method. B Experimentally obtained plasmonic resonance supported by the synthesized gold nanoparticles (T = Optical transmission). The inset in the figure shows the photograph of a plasmonic chip. C Cross-sectional electric field profile calculated at the plasmonic resonance. D Electric field profile calculated at z = z’ (highlighted with a white dashed line in Fig. 2C) along the xy-plane. The figure displays the propagation (k) and polarization (E) directions of the incident light source. E Schematic illustration of the constituent elements of the chip-preparation apparatus. F Photograph of the chip-preparation apparatus with a glass slide sandwiched inside. G SEM image of the gold nanoparticles bounded on the glass surface. H Zeta Sizer results demonstrating particle distributions based on diameter. Figure inset shows the substrate surface covered with gold particle (highlighted with green), demonstrating a 66.33% coverage ratio. I Variations within the resonance wavelength (λ, left) and the linewidth (full-width half-maximum - FWHM, middle) of the transmission resonance supported by n = 50 plasmonic chips with different surface coverage ratios (right). The box plot represents the interquartile ranges, and the black squares are the average values of the data. J Variations in the spectral position (λ, black) and the linewidth (orange) of n = 10 plasmonic chips over a 24-month period. In the figure, squares correspond to the mean values and the error bars represent double the standard deviation.
Fig. 3
Fig. 3. Limit of detection of the pre-diagnostic platform.
A Schematic illustration and photograph of the PDMS-based flow cell holder, ensuring a leak-free flow cell. The figure inset demonstrates the surface modification technique used to capture the pyrin protein in the sensor channel of the flow cell. B Variation in the transmission resonance supported by the nanoparticles: initial response under PBS (black curve), after the addition of 100 µg/mL protein A/G (orange curve), 100 µg/mL anti-pyrin antibody (or IgG, blue curve), and 100 µg/mL pyrin protein (green curve) diluted with PBS solution (T = Optical transmission). The spectral window used for the spectral integral method is highlighted in gray. The figure inset presents the calculated spectral integral values for each transmission spectrum. C Real-time changes in the spectral integral value for the IgG-coated nanoparticles: initial response (t = 0–6 min., blue curve), pyrin protein flowed over the sensing surface (t = 6–21 min., green curve), and surface saturation with pyrin protein (t = 21–30 min., orange curve). D Spectral integral values calculated for different pyrin concentrations (green squares) compared to protein IgG (blue square). The yellow line highlights the spectral integral values associated with the surface saturation case for pyrin protein. For each concentration, the spectral integral values were calculated after a 15-min pyrin injection. The figure inset zooms into a smaller pyrin concentration range. In the figure, squares correspond to the mean spectral values for n = 10 independent experiments, and the error bars represent double the standard deviation. The black line corresponds to the linear regression model fitted to the calibration data to define the system LOD (limit of detection). Gray area highlights the overlapping spectral integral datasets for different conditions. The repetition tests were conducted for all pyrin concentrations, and the error bars are displayed only in the zoomed-in figure.
Fig. 4
Fig. 4. Specificity and stability of the biosensor platform.
A Schematic illustration of the exposure of the plasmonic chip coated with anti-pyrin antibody to pyrin protein together with some common inflammatory and serum proteins for the selectivity test. (Left) Spectral integral values calculated for anti-pyrin antibody (blue bar), pyrin protein (green bar), and inflammatory and serum proteins (gray bars). Welch’s t-test: p (anti-pyrin vs. pyrin) = 3.74 × 10−11 and p (anti-pyrin vs. other proteins) > 0.13. (Right) Spectral integral values calculated for the anti-pyrin antibody (blue bar) and the protein mixture containing human pyrin CRP, TNF-α, IL-6, Albumin, IgG, and Transferrin proteins (yellow bar). Welch’s t-test: p (single pyrin vs. protein mixture) = 0.21. B Spectral integral values calculated for the plasmonic chip coated with anti-pyrin antibody (blue bar) after the addition of pyrin protein under PBS (green bar) and artificial serum sample (peach bar). All measurements were conducted under PBS. Welch’s t-test: p(PBS vs. Artificial Serum) = 0.19. C Schematic illustration of the two surface modification methodologies: Physisorption adapted for short-term storage and Streptavidin-biotin interaction adapted for long-term storage at 4 °C. Spectral integral values calculated for the plasmonic chips surface-modified via physisorption (blue bars) and streptavidin-biotin interaction (peach bars) for different storage durations. In the figures, bars correspond to the mean spectral integral values for n = 10 independent experiments, and the error bars represent double the standard deviation.
Fig. 5
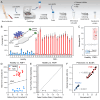
Fig. 5. Clinical tests with the pre-diagnostic platform.
A Schematic illustration depicting the collection and preparation of clinical samples. Created with BioRender.com. B Corrected spectral integral (SI) values determined for the control (gray bars) and sensor (blue bars: healthy samples, red bars: patient samples) channels in the flow cell. Total number of clinical samples, e.g., n (healthy) = 12 and n (patient) = 18. The figure inset shows the schematic illustration of the flow cell, where patient samples were flowed through the control (bare surface) and the sensor channels (surface coated with anti-pyrin antibody). In the figure, squares correspond to the mean spectral values for ten independent experiments, and the error bars represent double the standard deviation. C Normalized spectral integral values for healthy and patient samples. Blue and red boxes represent the spectral integral ranges for healthy and patient samples used in the system database. Inside the boxes, one blue dot (FMF−) and two red dots (FMF+) correspond to the clinical samples with successfully determined FMF status in single-blind tests. Welch’s t-test: p (Healthy vs. FMF+) = 5.12 × 10−14. D The two-dimensional spectral integral data determined before and after pyrin injection in the sensor region on the plasmonic chip, where an orthogonal LDA vector (black dashed line) separates the healthy (blue squares) and FMF+ subsets (red squares). E ROC analysis conducted between healthy and FMF+ samples, demonstrating and AUC of 1. As an additional note, both corrected and normalized spectral integral values were calculated via the division of two different spectral integral values, making them unitless parameters. F Comparison between normalized spectral integral values determined from the plasmonic pre-diagnostic technology and the optical density values determined from ELISA. In the figure, blue (healthy) and red lines (FMF+) account for the linear regressions fitted to the experimental data (black squares). Pearson’s correlation coefficient: r (healthy) = 0.9561 (blue line) and r(FMF+)  = 0.9593 (red line).
Fig. 6
Fig. 6. Graphical User Interface (GUI) of the plasmonic pre-diagnostic platform.
The figure represents a particular case where a patient with file number F15 is being tested for Familial Mediterranean Fever. The spectrometer settings show the device name, with adjustable parameters such as update rate, integration time, and boxcar width to ensure smooth data collection. The selected flow rate is set to slow, and the pump duration (in minutes) is controlled to manage the delivery of fluids during testing. The data acquisition panel displays the test date, patient information, and control/sensor status. Transmission spectra show the signal at different wavelengths (600–800 nm), with the shaded area indicating the spectral integral window. The bar charts show the spectral integral (SI) values for control and sensor regions, comparing initial, AG, IgG, and patient samples. The FMF test result indicates a positive diagnosis, confirmed by the “POSITIVE” status in red.
Fig. 7
Fig. 7. Schematic illustration of preliminary diagnosis of FMF and initiating drug treatment based on clinical findings.
Initiating drug treatment in a timely manner through early diagnosis, while awaiting definitive diagnosis from genetic tests, can alleviate disease symptoms and greatly improve the quality of life. Created with BioRender.com.

Similar articles

References

    1. Özen, S., Batu, E. D. & Demir, S. Familial Mediterranean Fever: recent developments in pathogenesis and new recommendations for management. Front. Immunol. 8, 253 (2017). - PMC - PubMed
    1. Portincasa, P., Scaccianoce, G. & Palasciano, G. Familial Mediterranean fever: a fascinating model of inherited autoinflammatory disorder. Eur. J. Clin. Invest.43, 1314–1327 (2013). - PubMed
    1. Ben-Chetrit, E. & Touitou, I. Familial Mediterranean fever in the world. Arthritis Rheum.61, 1447–1453 (2009). - PubMed
    1. The French FMF Consortium. et al. A candidate gene for familial Mediterranean fever. Nat. Genet.17, 25–31 (1997). - PubMed
    1. Sood, R. et al. Construction of a 1-Mb restriction-mapped cosmid contig containing the candidate region for the familial Mediterranean fever locus (MEFV) on chromosome 16p13.3. Genomics42, 83–95 (1997). - PubMed

LinkOut - more resources