. 2024 Sep 28;6(4):lqae130.
doi: 10.1093/nargab/lqae130. eCollection 2024 Sep.

StableMate: a statistical method to select stable predictors in omics data

Affiliations

StableMate: a statistical method to select stable predictors in omics data

Yidi Deng et al. NAR Genom Bioinform. .

Abstract

Identifying statistical associations between biological variables is crucial to understanding molecular mechanisms. Most association studies are based on correlation or linear regression analyses, but the identified associations often lack reproducibility and interpretability due to the complexity and variability of omics datasets, making it difficult to translate associations into meaningful biological hypotheses. We developed StableMate, a regression framework, to address these challenges through a process of variable selection across heterogeneous datasets. Given datasets from different environments, such as experimental batches, StableMate selects environment-agnostic (stable) and environment-specific predictors in predicting the response of interest. Stable predictors represent robust functional dependencies with the response, and can be used to build regression models that make generalizable predictions in unseen environments. We applied StableMate to (i) RNA sequencing data of breast cancer to discover genes that consistently predict estrogen receptor expression across disease status; (ii) metagenomics data to identify microbial signatures that show persistent association with colon cancer across study cohorts; and (iii) single-cell RNA sequencing data of glioblastoma to discern signature genes associated with the development of pro-tumour microglia regardless of cell location. Our case studies demonstrate that StableMate is adaptable to regression and classification analyses and achieves comprehensive characterization of biological systems for different omics data types.


Figures

Figure 1.
Figure 1.
Toy example for StableMate analysis. (A) Stable predictors. Consider a regression problem where the response Ye and predictors Xe were generated from three different environments (e.g. batches, cohorts) e = e1, e2, e3, as represented in panel (A1). Stable predictors are a subset of all predictors that are useful for predicting Ye and whose association with the response Ye does not change with e. If we fit a regression model in each environment to predict the response using only the stable predictors (A2), then the fitted models should be approximately the same across all environments (A3). Thus identifying stable predictors is useful for constructing regression models that are agnostic to environments and hence may be more generalizable to unseen environments. On the other hand, predictive but unstable (referred to as ‘environment-specific’) predictors may be useful for understanding environment-specific regulatory mechanisms of the response Ye. (B) Difference between stable and environment-specific predictors. We simulated 900 samples, each with response Ye and predictors formula image across environments e = e1, e2, e3. Left panel plots Ye against a stable predictor formula image; right panel plots Ye against an environment-specific predictor formula image. Linear regression lines were fitted per environment. Both formula image and formula image are useful for predicting Ye since they are both strongly negatively correlated with Ye in each environment. However, for the stable predictor formula image, the regression lines have the same slope and intercept in all three environments. For the environment-specific predictor formula image, the regression lines have the same slope but differ in their intercepts. (C) StableMate variable selection plot. StableMate takes as input the predictors formula image measured from the 900 samples across all environments, where the environment index e is known for each sample, and the response Ye for each sample. The variable selection plot shows the prediction score (x-axis) and the stability score (y-axis) assigned to each predictor. Vertical and horizontal dashed lines represent the significance thresholds for prediction and stability respectively based on bootstrap, as defined in the ‘Materials and methods’ section. The predictive variables are further labelled as stable (up triangles) or environment-specific (down triangles), where, in particular, formula image and formula image are both correctly labelled.
Figure 2.
Figure 2.
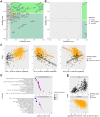
StableMate selects genes from the TCGA-BRCA dataset which predict ESR1 expression across normal and ER+ samples. We used (A) gene expression or (B) principal components (PCs) of gene expression as predictors. The stability score (y-axis) of a gene is a measure of how consistently this gene predicts ESR1 regardless of the disease status (normal or ER+). Stable and disease-specific genes/PCs are labelled as up and down triangles, respectively. (C) ESR1 expression (y-axis) against PC scores (x-axis). The correlation between ESR1 with the highly disease-specific PC3 changed from positive to negative between normal and ER+ samples, whereas the sign of the correlations between ESR1 and the stable PC1 and PC2 remained unchanged between normal and ER+ samples. We analysed PC1 (i.e. the most important stable PC) and PC3 (i.e. the most important disease-specific PC) as an example. (D) Gene ontology enrichment on the top 200 genes from PC1 (top) and PC3 (bottom) suggested biological activities related to hormonal regulation and epidermis development, respectively. The predictive ability and stability of PC1 suggest that ESR1 may directly participate in hormonal regulation, which is corroborated by the knowledge that ESR1 is a transcriptional factor activated by estrogen binding. (E) Reproducibility of StableMate results using external databases, GTEx for normal breast tissue and the METABRIC data from cBioPortal for ER+ BC: ESR1 expression against the expression of the metagene defined by the top 200 genes contributing to PC3 (i.e. linear combination of these 200 genes according to the loading vector of PC3) confirm the opposite trends we observed in (C) of ESR1 against PC3 in normal and ER+ samples.
Figure 3.
Figure 3.
StableMate meta-analysis of metagenomic data reveals key species predictive of CRC across eight independent study cohorts. (A) StableMate variable selection plot of the pooled analysis. The majority of highly predictive species were found stable, and none was identified as cohort-specific. (B) PCoA with samples coloured by either disease status (left column) or cohorts (right column). (B1) Using all 313 species shared by all cohorts, regardless of their stability; (B2) using only the 23 stable species selected by StableMate. PERMANOVA R2 statistic on the first two principal coordinates is shown in the top left corner of each panel. The coloured bar at the bottom shows the composition of the total variance. When considering all 313 species, the cohort effect is much larger than the disease effect (almost negligible); with 23 species identified as stable, the cohort effect is still present but smaller than the disease effect. (C) StableMate variable selection plot of the Austria cohort-specific analysis (one of the eight cohort-specific analyses). Prevotella copri was found to be an Austria-specific species for predicting CRC, since it has a high prediction score but a low stability score. Such species are interesting for studying cohort-specific effects that may confound the CRC diagnosis.
Figure 4.
Figure 4.
Characterizing transition of microglia cell identity from periphery to core in GBM tumour with scRNA-seq data. (A1) Sincast projection of the query single cells (crosses) onto a bulk RNA-seq reference atlas of myeloid cells (dots) to assign cell identity. The cells from the tumour periphery were located close to the reference foetal microglia, while the cells from the tumour core showed a transition towards the reference monocytes and macrophages. Panel (A2) is identical to panel (A1) except that cells are coloured according to DPT, representing a cell state transition. StableMate was applied to select genes predictive of DPT, where cell location (core and periphery) was set as the environmental variable. (B)–(F) The expression of the cytokines was imputed based in Sincast. We identified several cytokines that are typical microglia activation and polarization markers, including (B) CCL3 and CCL4, which are stable, and (C) TNF, IL1B, CCL2, and CSF1, which are periphery-specific. (D) A gene regulatory network was built by running StableMate on each of the seven response variables, namely DPT and six cytokines CCL3, CCL4, TNF, IL1B, CCL2, and CSF1 (represented as large nodes). The aim was to select stable and predictive genes associated with each of these response variables. The cell location was still set as the environment variable. An edge indicates that a gene is stable and predictive of a response variable. We found that CCL3 and CCL4 were stable and predictive of DPT as a separate graphical community from TNF, IL1B, CCL2, and CSF1, which were predictive but unstable of DPT. (E) The expression levels of MHC-II molecule HLA-DOA and the macrophage marker MARCO. (F) The expression levels of large extracellular matrix protein VCAN. MARCO, VCAN and HLA-DOA were all identified as core-specific. The upregulation of MARCO, VCAN, and the downregulation of HLA-DOA suggest a development of M2-like immunosuppressive macrophage.
Figure 5.
Figure 5.
StableMate outperforms commonly used regression methods in prediction and variable selection based on the colon cancer case study. (A) We used LODO cross-validation to calculate area under the curve (AUC, y-axis) and assess the generalizability of the classification when applied to an unseen cohort. Paired t-tests compare the AUC values and adjusted P-values (69) are shown. Each point presents the AUC value calculated on a left-out cohort. Methods include GLM (logistic regression), Lasso (Lasso logistic regression), RF, and two versions of StableMate (logistic regression): SM-Stab-based stable predictors only and SM-Pred using all predictive variables. Among all linear methods (all except RF), SM-Stab obtained the highest mean AUC (the difference is statistically significant). Compared to RF, SM-Stab had a slightly lower mean AUC, but this difference was not statistically significant. Note that RF is a more flexible non-linear classification method. (B) Venn diagram to compare the three lists of species (each containing 23 species) selected by StableMate, Lasso, and RF. StableMate and Lasso made similar selections, with 20 species selected by both. The RF selection was quite different from the other two methods. Nine species were selected by all three methods, all of which are known to be associated with CRC (70). In addition, two species, also known to be associated with CRC, were selected by both Lasso and RF but not by StableMate. This is because these two species were not significantly stable as suggested by StableMate selection. (C) Generalizability of six sets of species: top 23 species selected by StableMate (‘SM’), Lasso and RF, the 9 species selected by all the methods (‘RF & Lasso & SM’), the 20 species selected by both Lasso and StableMate (‘Lasso & SM’) and the 26 species selected by either Lasso or StableMate (‘Lasso | SM’). We built six RF classifiers using these six sets of species and reported their AUC values (mean AUC on the x-axis). The stable species selected by StableMate led to the best RF model, with a higher AUC than RF trained with all 313 species in (A).

Similar articles

References

    1. Langfelder P., Horvath S. WGCNA: an R package for weighted correlation network analysis. BMC Bioinformatics. 2008; 9:559. - PMC - PubMed
    1. Huynh-Thu V.A., Irrthum A., Wehenkel L., Geurts P. Inferring regulatory networks from expression data using tree-based methods. PLoS One. 2010; 5:e12776. - PMC - PubMed
    1. Moerman T., Aibar Santos S., Bravo González-Blas C., Simm J., Moreau Y., Aerts J., Aerts S. GRNBoost2 and Arboreto: efficient and scalable inference of gene regulatory networks. Bioinformatics. 2019; 35:2159–2161. - PubMed
    1. Aibar S., González-Blas C.B., Moerman T., Huynh-Thu V.A., Imrichova H., Hulselmans G., Rambow F., Marine J.-C., Geurts P., Aerts J. et al. . SCENIC: single-cell regulatory network inference and clustering. Nat. Methods. 2017; 14:1083–1086. - PMC - PubMed
    1. Faith J.J., Hayete B., Thaden J.T., Mogno I., Wierzbowski J., Cottarel G., Kasif S., Collins J.J., Gardner T.S. Large-scale mapping and validation of Escherichia coli transcriptional regulation from a compendium of expression profiles. PLoS Biol. 2007; 5:e8. - PMC - PubMed

LinkOut - more resources