[Preprint]. 2024 Sep 16:2024.09.16.613305.
doi: 10.1101/2024.09.16.613305.

Interphase chromosome conformation is specified by distinct folding programs inherited via mitotic chromosomes or through the cytoplasm

Affiliations

Interphase chromosome conformation is specified by distinct folding programs inherited via mitotic chromosomes or through the cytoplasm

Allana Schooley et al. bioRxiv. .

Abstract

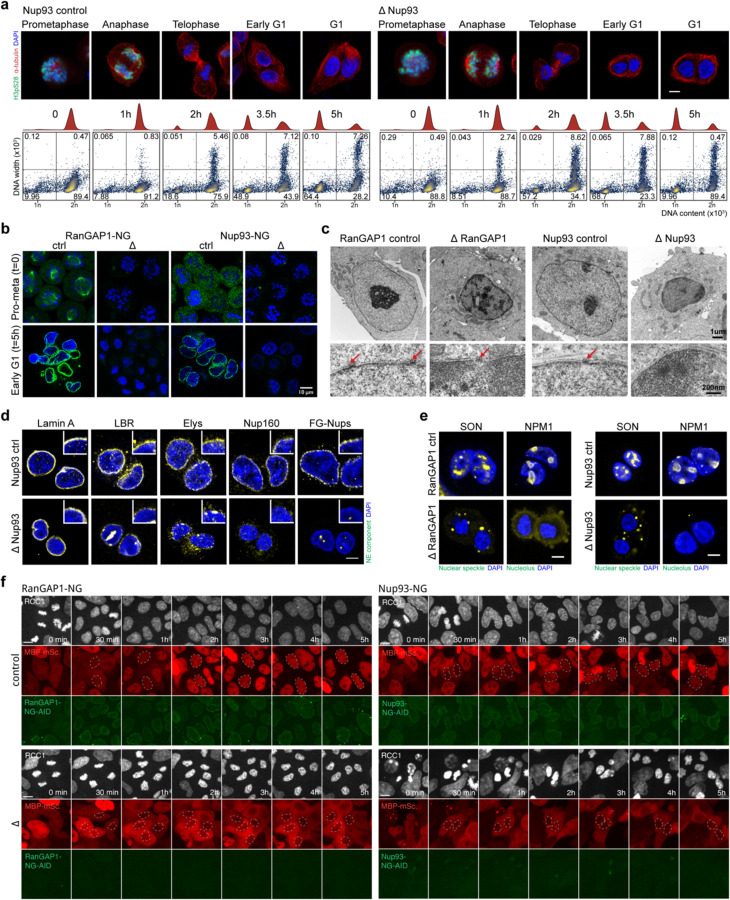
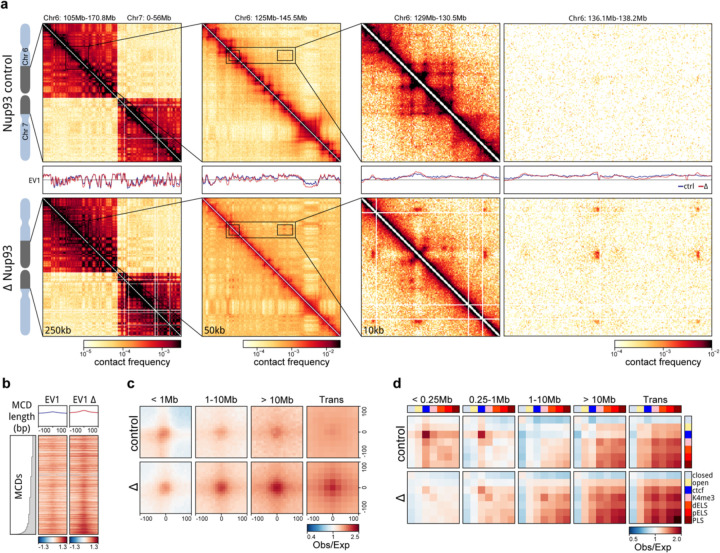
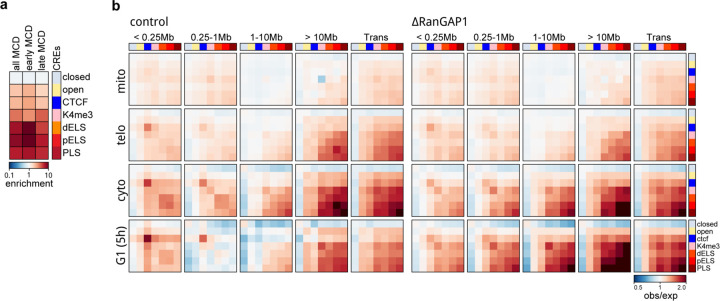
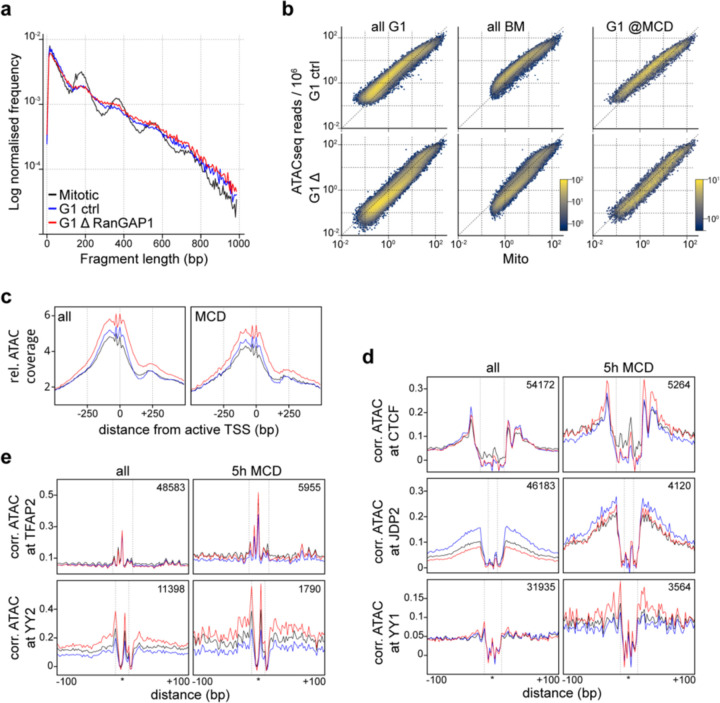
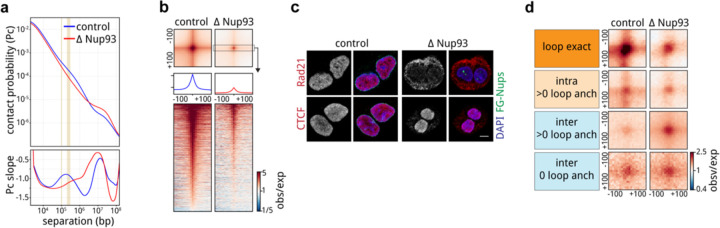
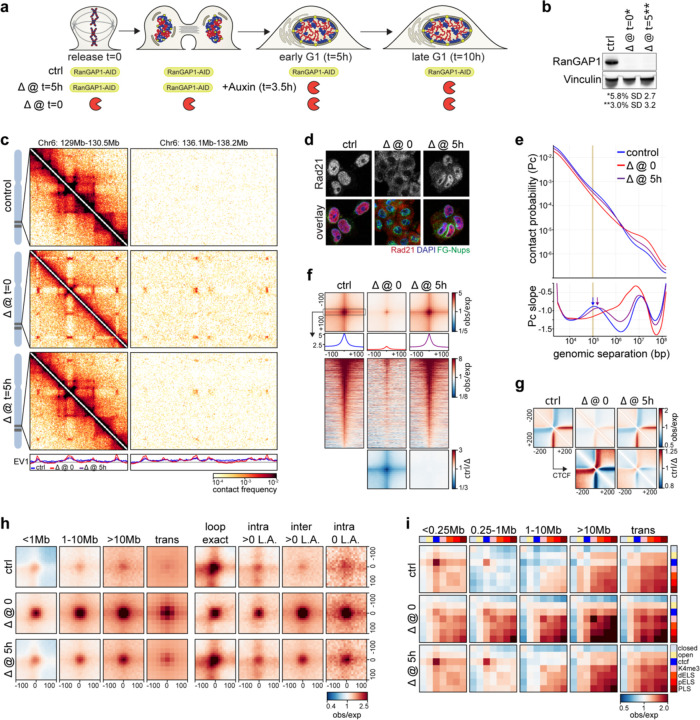
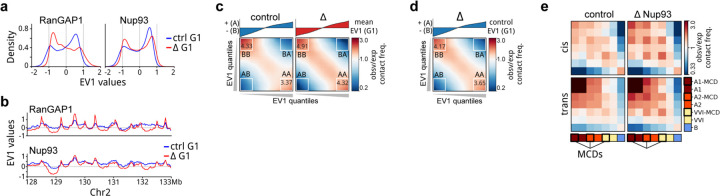
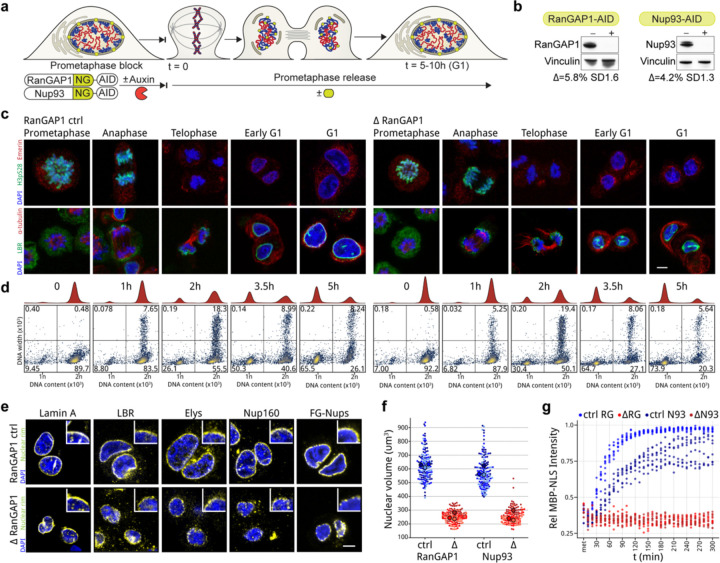
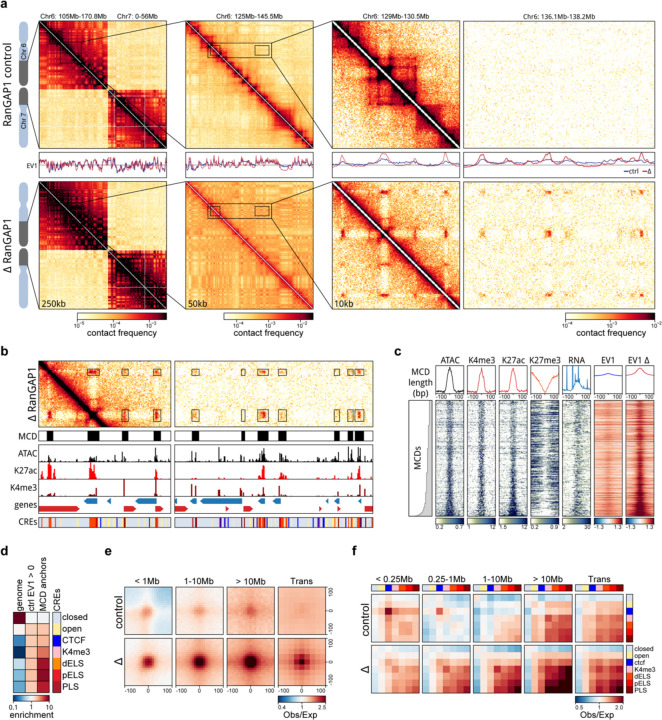
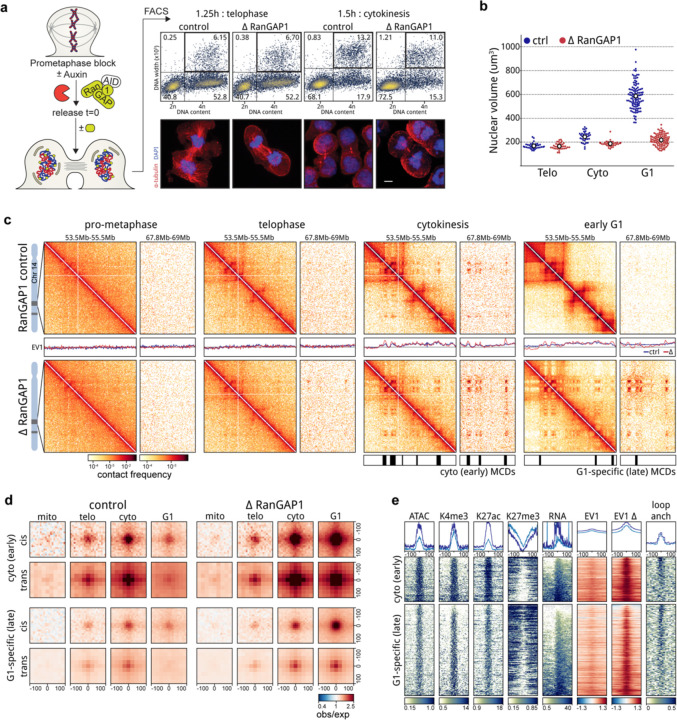
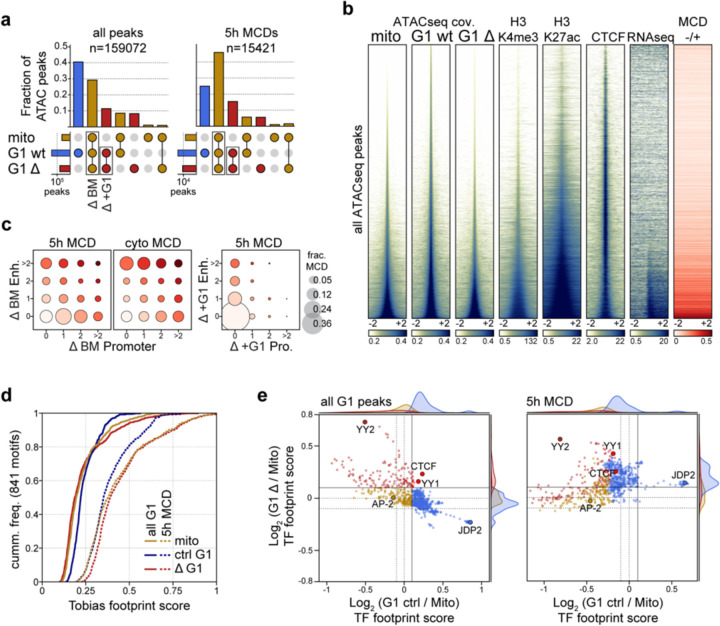
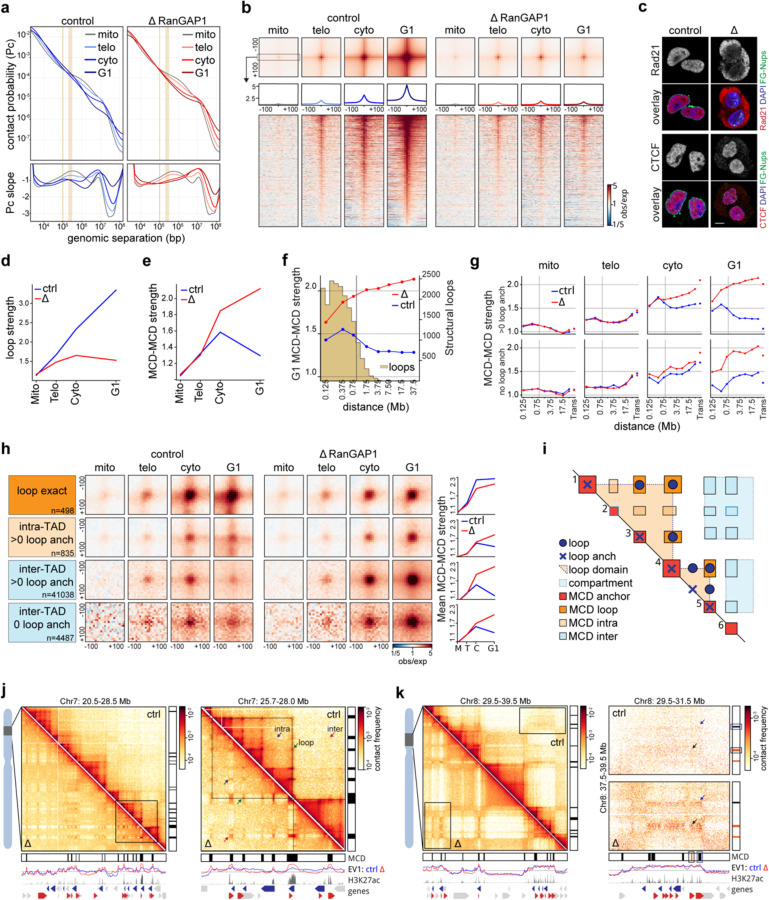
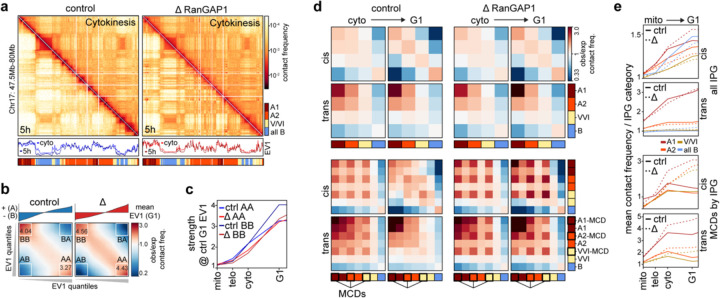
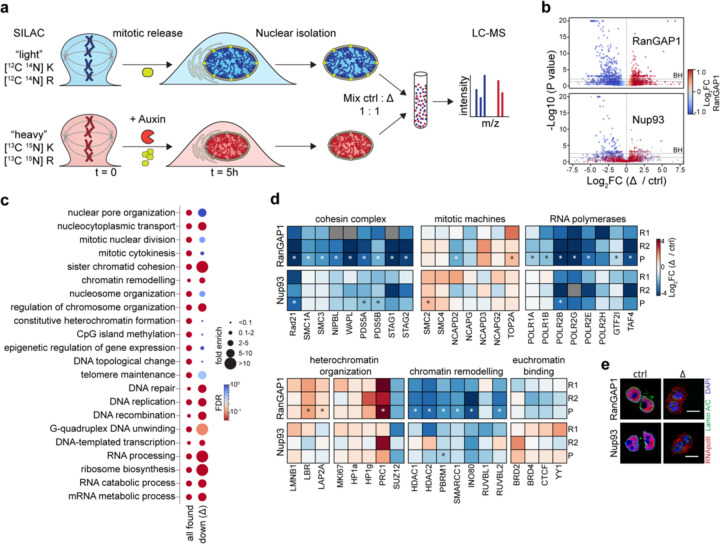
Identity-specific interphase chromosome conformation must be re-established each time a cell divides. To understand how interphase folding is inherited, we developed an experimental approach that physically segregates mediators of G1 folding that are intrinsic to mitotic chromosomes from cytoplasmic factors. Proteins essential for nuclear transport, RanGAP1 and Nup93, were degraded in pro-metaphase arrested DLD-1 cells to prevent the establishment of nucleo-cytoplasmic transport during mitotic exit and isolate the decondensing mitotic chromatin of G1 daughter cells from the cytoplasm. Using this approach, we discover a transient folding intermediate entirely driven by chromosome-intrinsic factors. In addition to conventional compartmental segregation, this chromosome-intrinsic folding program leads to prominent genome-scale microcompartmentalization of mitotically bookmarked and cell type-specific cis-regulatory elements. This microcompartment conformation is formed during telophase and subsequently modulated by a second folding program driven by factors inherited through the cytoplasm in G1. This nuclear import-dependent folding program includes cohesin and factors involved in transcription and RNA processing. The combined and inter-dependent action of chromosome-intrinsic and cytoplasmic inherited folding programs determines the interphase chromatin conformation as cells exit mitosis.


Conflict of interest statement

Conflicts of interest Job Dekker is a member of the scientific advisory board of Arima Genomics, San Diego, CA, USA and Omega Therapeutic, Cambridge, MA, USA.

Figures

Extended Data Fig. 1:
Extended Data Fig. 1:. Acute depletion of RanGAP1-AID or Nup93-AID during mitotic exit enables the assembly of daughter nuclei isolated from the G1 cytoplasm.
a. Representative immunofluorescence images for Nup93 control and depleted cells. Loss of Histone H3 serine 10 phosphorylation (H3pS10P) and DNA content at indicated time points indicates similar mitotic exit kinetics in the presence or absence of Nup93. Scale bar represents 5 um. Lower row of panels: DNA-content flow cytometry measurements for Nup93 control and depleted cells indicating similar mitotic exit kinetics in the presence or absence of Nup93. b. Fluorescent images of endogenous Neon Green-tagged RanGAP1-AID or Nup93-AID demonstrate efficient degradation of both proteins by 2 hours auxin treatment prior to mitotic release that is sustained into G1 in the presence of auxin. Scale bar represents 5 um. c. Transmission electron micrographs of RanGAP1-AID and Nup93-AID cells fixed at 5 hours reveal relatively small nuclei with hyper-condensed chromatin characteristic of post-mitotic depletion of either nuclear import factor. Arrows indicate nuclear pores embedded in the double lipid bilayers of the nuclear envelope and are not found in Nup93-depleted nuclei. d. Immunofluorescence images of Nup93 control and depleted cells 5 hours after mitotic release demonstrating presence of nuclear lamina (lamin A) and nuclear envelope (LBR) proteins as well as the DNA-binding nuclear pore complex protein, Elys, in the absence of Nup93. Structural (Nup160) and late associating (FG-Nups) nucleoporins are not found in Nup93-depleted nuclei. Scale bar represents 5 um and inset indicates a 5x magnification of the nuclear rim. e. Nuclear speckle (SON) and nucleolar (NPM1) resident proteins are mis-localized to the cytoplasm in RanGAP1-AID and Nup93-AID-depleted nuclei. Representative immunofluorescence images of cells fixed 5 hours after mitotic exit are shown. Scale bar represents 5 um. f. Representative time-lapse fluorescent images of RanGAP1-NG-AID or Nup93-NG-AID control and depleted cells blocked in G2 (Ro-3306) and released for 5h. Endogenously tagged RCC1-miRFP670 demarcating chromatin and the MBP-mScarlet-NLS import substrate are shown.
Extended Data Fig. 2:
Extended Data Fig. 2:. A chromosome-intrinsic capacity to form a kilobase scale cCRE compartment emerges upon depletion of Nup93 during mitotic exit.
a. Representative Hi-C interaction frequency maps at 250kb (Chr 6: 105–170.8 Mb - Chr 7: 0–56 Mb), 50kb (Chr 6: 125 – 145.5 Mb), and 10kb (Chr 6: 129 – 130.5 v. 136.1 – 138.2 Mb) resolution showing genome compartmentalisation in control and auxin-treated DLD-1 Nup93-AID cells released from prometaphase arrest for 5h. Matched first eigenvector (EV1) values for cis interactions are phased by gene density (A > 0). b. Heatmaps for all RanGAP1 MCDs centred on contact frequency summits and sorted by anchor length demonstrate differences in intra-chromosomal EV1 values derived from 10kb matrices in control and Nup93-depleted cells. c. Pairwise mean observed/expected contact frequency between all RanGAP1 MCDs projected in cis and trans showing enhanced interactions at all length scales and between chromosomes in Nup93-depleted G1 cells. d. Pairwise aggregate observed/expected contact frequency between cCREs assigned in control cells and subjected to hierarchical binning at 10kb resolution showing enhanced homo- and hetero-typic interactions between active promoters and enhancers in Nup93-depleted cells compared to controls at multiple genomic distances in cis and in trans.
Extended Data Fig. 3:
Extended Data Fig. 3:. Cis-regulatory elements form a transient microcompartment during mitotic exit.
a. Relative fold enrichment of control cCREs at early (cytokinesis) or late (G1-specific) MCD anchors demonstrating the predominance of active promoters and enhancers at microcompartment domains. b. Pairwise aggregate observed/expected contact frequency between cCREs assigned in control cells and subjected to hierarchical binning at 10kb resolution showing transient enhanced homo- and hetero-typic interactions between active promoters and enhancers at multiple genomic distances in cis and in trans during mitotic exit.
Extended Data Fig. 4:
Extended Data Fig. 4:. Chromatin accessibility at microcompartment domains during mitosis and G1.
a. Relative fragment length distributions of ATACseq reads indicating regular nucleosome positioning in mitotically arrested cells and more dynamic G1 architecture in both control and RanGAP1-depleted cells released for 5h. b. Comparison of G1 and prometaphase ATACseq read coverage at all control G1, bookmarked, or MCD-overlapped G1 peaks demonstrating a common shift towards higher coverage peaks in all conditions at the MCDs. c. Aggregation plots of prometaphase, G1 control, or RanGAP1-depleted G1 ATACseq signal centred at active promoters (TSS) (FPKM >1) displaying genome-wide (left) and MCD-overlapped (right) averages. TSS are oriented in the same forward direction and ATACseq signal is binned to 5bp resolution and normalised to the mean frequency of the 1 kb upstream window. d. Aggregation plots of Tn5 bias-corrected (Tobias) prometaphase, G1 control, or RanGAP1-depleted ATACseq signal centred at bookmarked (TFAP2) or G1 control-specific (JDP2) example TF motifs (d) or motifs with high RanGAP1 depletion footprints (CTCF, YY1 and YY2) (e) indicating relative differences in footprint protection at genome-wide G1 or MCD-overlapped peaks. Motifs are oriented in the same forward direction and ATACseq signal is binned to 2bp resolution.
Extended Data Fig. 5:
Extended Data Fig. 5:. Microcompartment pruning generally requires nuclear transport in G1
a. P(s) and derivative P(s) plots for Hi-C data from FACS-sorted early G1 (t = 5h) control and Nup93-depleted cells. b. Pairwise mean observed/expected Hi-C contact frequency between convergent CTCF loops identified in pooled interphase RanGAP1-AID control Hi-C data demonstrating Nup93-dependent looping interactions in early G1 (t = 5h). Average signal for three central 10kb bins across the 200kb CTCF motif-centred window and stack-ups sorted by G1 loop strength are shown. c. Representative immunofluorescence images of Nup93-AID control and depleted cells fixed 5h after mitotic release demonstrating the nucleo-cytoplasmic localisation of the cohesin complex subunit, Rad21, and boundary transcription factor, CTCF. Scale bar represents 5 um. d. Pairwise mean observed/expected contact frequency between MCDs in early G1 (t = 5h) in control and RanGAP1-depleted cells. MCD-MCD contacts are categorised by the presence of a convergent CTCF loop or loop anchor (> 0) and the looping domain status of the constituent MCDs, as indicated.
Extended Data Fig 6:
Extended Data Fig 6:. The capacity for genome-scale microcompartment formation is retained in G1 cells
a. Experimental workflow for the depletion of RanGAP1-AID in early G1. Auxin-induced degradation is initiated 3.5h following nocodazole release to ensure the absence of RanGAP1 protein by t = 5h. Control, Mitotic degraded (t = 0), and early G1-degraded (t = 5h) RanGAP1-AID cells are fixed for Hi-C 10h after prometaphase release in late G1. b. Representative western blot images of whole cell lysates derived from control and mitotic (t = 0) or G1 (t = 5h) auxin-treated DLD-1 cells 10h after mitotic release showing efficient depletion of RanGAP1. Mean protein levels normalised to vinculin for depleted lysates relative to untreated controls are shown for 3 replicates with standard deviation (SD). c. Hi-C interaction frequency maps at 10kb (Chr 6: 129 – 130.5 & 136.1 – 138.2 Mb) resolution showing genome compartmentalisation in RanGAP1-AID control and mitotic (t = 0) or G1 (t = 5h) depleted cells released from prometaphase arrest for 10h. Matched first eigenvector (EV1) values for cis interactions are phased by gene density (A > 0). d. Representative immunofluorescence images of RanGAP1-AID control and mitotic (t = 0) or early G1-depleted (t = 5h) cells fixed 10h after mitotic release demonstrating the nucleo-cytoplasmic localisation of the cohesin complex subunit, Rad21. Scale bar represents 5 um. e. P(s) and derivative P(s) plots for Hi-C data from synchronised RanGAP1-AID control and mitotic (t = 0) or early G1-depleted (t = 5h) cells fixed 10h after mitotic release. Vertical goldenrod line indicate the average loop size in control cells. Arrows highlight that in RanGAP1-AID-depleted cells the average loop size increases. f. Pairwise mean observed/expected Hi-C contact frequency in late G1 (t = 10h) between convergent CTCF loops, demonstrating retained looping interactions when RanGAP1-AID is degraded in early G1 (t = 5h). Average signal for three central 10kb bins across the 200kb CTCF motif-centred window and stack-ups sorted by G1 loop strength are shown. The ratio of observed/expected interaction frequency for depleted vs control cells is shown. g. Observed/expected Hi-C interaction pile-ups centred on forward-oriented CTCF motifs that overlap loop anchors are plotted in a 400kb window at 10kb resolution. The ratio of observed/expected interaction frequency for depleted vs control cells is shown. h. Pairwise mean observed/expected contact frequency between MCDs 10h after prometaphase release, in control and mitotic (t = 0) or early G1-depleted (t = 5h) RanGAP1-AID cells. MCD-MCD contacts are categorised by distance or the presence of a convergent CTCF loop or loop anchor (“> 0”) and the looping domain status of the constituent MCDs, as indicated. i. Pairwise aggregate observed/expected contact frequency between cCREs assigned in control cells and subjected to hierarchical binning at 10kb resolution showing enhanced homo- and hetero-typic interactions between active promoters and enhancers at multiple genomic distances in cis and in trans in late G1 (t = 10h) for G1-depleted (t = 5h) RanGAP1-AID cells.
Extended Data Fig. 7:
Extended Data Fig. 7:. A distinct microcompartment is formed in the absence of RanGAP1 or Nup93
a. Distributions of EV1 values from Eigenvector decomposition of 25kb binned Hi-C data from control and auxin-treated RanGAP1-AID and Nup93-AID cells in G1. b. Representative examples of 25kb EV1 tracks from the Hi-C data of control and RanGAP1-AID- or Nup93-AID-depleted cells in early G1. c. Saddle plots representing the segregation of active (A) and inactive (B) chromatin compartments in cis for control and Nup93-AID-depleted cells 5h after mitotic release (G1). The first eigenvector from each condition was used to rank 25 kb genomic bins and quantification of the average preferential A-A and B-B interactions for the top 20% strongest A and B loci are indicated. d. Saddle plots representing the segregation of active (A) and inactive (B) chromatin compartments defined in control cells at 25kb resolution and plotted for Nup93-AID-depleted cells 5h after mitotic release (G1). Quantification of the average preferential A-A and B-B interactions for the top 20% strongest A and B loci are indicated. e. Pairwise aggregate observed/expected contact frequency between IPGs derived from DLD-1 cells and further categorized by the presence or absence of MCDs showing enhanced homo-typic interactions between MCDs in Nup93-AID-depleted cells in early G1.
Fig. 1:
Fig. 1:. Acute depletion of essential nuclear import machinery during mitotic exit enables the assembly of daughter nuclei isolated from the G1 cytoplasm.
a. Experimental workflow for depletion of either RanGAP1 or Nup93 AID-tagged proteins from the onset of mitotic exit into G1. Auxin-induced degradation is initiated 2h prior to nocodazole/mitotic release (t=0). b. Representative western blot images of whole cell lysates derived from control and auxin-treated DLD-1 cell lines 5 hours after mitotic release showing efficient depletion of RanGAP1-AID or Nup93-AID. Mean protein levels normalized to vinculin for depleted lysates relative to untreated controls are shown for 3 replicates with standard deviation (SD). c. Representative immunofluorescence images for RanGAP1 control and depleted cells demonstrate congruous kinetics of mitotic release. Loss of Histone H3 serine 10 phosphorylation (H3pS10) and recruitment of nuclear envelope proteins emerin and lamin B receptor (LBR) are shown for control and RanGAP1-AID-depleted cells. Scale bar represents 5 um. d. Representative DNA-content flow cytometry measurements for RanGAP1 control and depleted cells demonstrate congruous kinetics of mitotic release. e. Immunofluorescence images of RanGAP1-AID control and depleted cells 5 hours after mitotic release demonstrating presence of nuclear lamina (lamin A), nuclear envelope (LBR), and nuclear pore complex (Elys, Nup160, and FG-rich nucleoporins) resident proteins in the absence of RanGAP1-AID. Scale bar represents 5 um and inset indicates a 5x magnification of the nuclear rim. f. Nuclear volume measurements in control and RanGAP1 or Nup93-depleted G1 cells 5h after mitotic exit indicate the consistently smaller size of import-incompetent nuclei. Volume was calculated for 50 DAPI-stained nuclei per condition in three independent experiments. Individual data points and mean values for each replicate are indicated. g. Import competence is not re-established after mitosis in RanGAP1-AID or Nup93-AID-depleted cells indicated by the absence of nuclear import substrate accumulation. Relative nuclear to cytoplasm intensity of MBP-mScarlet-NLS is shown for eight cells in three independent fields taken every 10 minutes from the onset of mitotic release from Ro-3306 for one representative experiment. Data are plotted starting from metaphase, which is the first point on the graph, before cells proceeded to anaphase.
Fig. 2:
Fig. 2:. Depletion of RanGAP1 during mitotic exit reveals a chromosome-intrinsic capacity to form a kilobase scale cCRE compartment.
a. Hi-C interaction frequency maps at 250kb (Chr 6: 105–170.8 Mb - Chr 7: 0–56 Mb), 50kb (Chr 6: 125 – 145.5 Mb), and 10kb (Chr 6: 129 – 130.5 & 136.1 – 138.2 Mb) resolution showing genome compartmentalisation in control and auxin-treated DLD-1 RanGAP1-AID cells released from prometaphase arrest for 5h. Matched first eigenvector (EV1) values for cis interactions are phased by gene density (A > 0). b. Representative Hi-C contact matrix at 10kb resolution highlighting microcompartments in RanGAP1 depleted cells. Gene annotations, ATACseq, and histone H3 modification Cut&Run from control DLD-1 cells were used to define cis-regulatory elements (CREs), which coincide with microcompartment domains (MCDs). c. Heatmaps for all 2,105 MCDs centred on contact frequency summits and sorted by anchor length demonstrating the prevalence of control cell ATACseq, H3K27ac, H3K4me3 and H3K27ac coverage. Intra-chromosomal EV1 values from 10kb matrices indicate differences in compartmentalisation at MCDs in control and RanGAP1-depleted cells. d. Relative fold enrichment of control candidate cis-regulatory elements genome-wide, at 10kb control A-compartment bins (EV1 > 0), and at MCDs demonstrating the predominance of active promoters and enhancers at microcompartments. e. Pairwise mean observed/expected contact frequency between all MCDs projected in cis and trans showing dramatically enhanced interactions at all length scales and between chromosomes in RanGAP1-depleted G1 cells. f. Pairwise aggregate observed/expected contact frequency between cCREs assigned in control cells and subjected to hierarchical binning at 10kb resolution showing enhanced homo- and hetero-typic interactions between active promoters and enhancers in RanGAP1-depleted cells compared to controls at multiple genomic distances in cis and in trans.
Fig. 3:
Fig. 3:. A transient microcompartment of chromosome-intrinsic affinities is first formed during telophase.
a. Isolation of highly synchronous telophase and cytokinesis cell populations by FACS for Hi-C analysis. Fixed cells are collected 1.25–1.5h following prometaphase release and sorted based on DNA (PI) content and width. Auxin-induced degradation of RanGAP1 is initiated 2h prior to nocodazole release (t=0). Representative immunofluorescence images show the enrichment of cells in telophase or cytokinesis based on the morphology of chromatin (DAPI) and microtubules (alpha-tubulin). Scale bar represents 5 um b. Nuclear volume measurements in control and RanGAP1-depleted cell populations enriched in telophase, cytokinesis, or early G1 indicate a lack of nuclear growth after telophase in import-incompetent nuclei. Volume was calculated for 25 DAPI-stained nuclei per condition. c. Representative Hi-C interaction frequency maps at 10kb (Chr 14: 53.5 – 55.5 v. 67.8 – 69 Mb) resolution showing genome organisation in control and auxin-treated DLD-1 RanGAP1-AID cells enriched in prometaphase, telophase, cytokinesis, or early G1 (5h after release). Matched first eigenvector (EV1) values for cis interactions are phased by gene density (A > 0). d. Pairwise mean observed/expected contact frequency between MCD anchors showing enhanced interactions in telophase that peak around cytokinesis of mitotic exit in control cells. All 2,105 G1 MCD anchors are categorized by whether they are detected early (cytokinesis) or late (G1-specific) in RanGAP1-depleted cells and projected in cis and trans. e. Heatmaps for MCD anchors, divided by whether they are detected early (cytokinesis) or late (G1) in RanGAP1-depleted cells. Stacks centred on contact frequency summits and sorted by MCD anchor length demonstrate the prevalence of control cell ATACseq, H3K27ac, H3K4me3 and H3K27me3 coverage and differences in intra-chromosomal in 10kb EV1 values for control and RanGAP1-depleted G1 cells at early and late MCD anchors. Plots on top of the heatmaps represent average profiles of the corresponding features, with the dark blue line representing the MCDs detected in cytokinesis and the light blue lines representing the G1 MCDs.
Fig. 4:
Fig. 4:. Microcompartment domains are bookmarked during mitosis
a. Intersections of all (left) or MCD-overlapped (right) ATACseq peaks detected in prometaphase, G1 control, or RanGAP1-depleted G1 cells are plotted as a fraction of the total. The number of called peaks are indicated. Bookmarked (BM) and G1-specific peaks present in RanGAP1-depleted cells are highlighted. b. Heat Maps centred on the union set of ATACseq peaks detected in prometaphase-arrested or G1 cells released for 5h −/+ RanGAP1. Stacks sorted by prometaphase ATACseq signal demonstrates co-occurence of G1 signals at mitotic peaks and prevalence of H3K27ac, H3K4me3, RNAseq, and MCD anchors. c. The proportion of all G1 MCD anchors or the cytokinesis subset at the indicated numbers promoters and enhancers demonstrates the valency of bookmarked (BM) and G1-specific CREs. Bubble size indicates the relative frequency. d. Empirical cumulative density plot of TOBIAS TF footprinting scores for 841 non-redundant vertebrate Jaspar motifs calculated for prometaphase or G1 −/+ RanGAP1 ATACseq signal at all control G1, or MCD-overlapped peaks. e. Comparison of differential TOBIAS footprint scores for either control or RanGAP1-depleted G1 vs prometaphase ATACseq at all G1 or MCD-overlapped G1 peaks. Each dot represents one of 841 non-redundant vertebrate Jaspar motifs, coloured by the distribution of scores at all G1 peaks. Bookmarked (gold) and G1-specific (blue) motifs are further classified by higher footprinting scores in the RanGAP1 depletion (dark and bright red, respectively) and relative density is plotted for each category for the control (x-axis) and depletion (y-axis) Log2-fold change over prometaphase.
Fig. 5:
Fig. 5:. Microcompartment interactions are pruned in nuclear transport-competent cells by early G1.
a. P(s) and derivative P(s) plots for Hi-C data from synchronised control and RanGAP1-depleted FACS-sorted prometaphase, telophase, cytokinesis, and early G1 (t = 5h) cells. b. Mean observed/expected Hi-C contact frequency at 18,613 convergent CTCF loops identified in pooled interphase G1 control Hi-C data demonstrating the RanGAP1-dependent increase in looping interactions as cells progress from prometaphase to G1. Average signal for three central 10kb bins across the 200kb CTCF motif-centered window and stack-ups sorted by G1 loop strength are shown. c. Representative immunofluorescence images of RanGAP1-AID control and depleted cells fixed 5h after mitotic release demonstrating the nucleo-cytoplasmic localisation of the cohesin complex subunit, Rad21, and boundary transcription factor, CTCF. Scale bar represents 5 um. d. Mean convergent CTCF loop strength quantified for RanGAP1-AID control and depleted cells (panel e) at discrete points of mitotic exit, as indicated. f. Mean strength of all pairwise MCD-MCD contacts projected in cis and quantified for RanGAP1-AID control and depleted cells in early G1 (t = 5h) at different distances of separation demonstrating the distance-dependent reduction in interaction strength beyond the range of structural CTCF loops. g. Mean strength of MCD-MCD contacts projected in cis and quantified for RanGAP1-AID control and depleted cells at discrete points of mitotic exit and across separation distances. Pairwise MCD interactions are classified based on the presence (l.a. > 0) or absence (l.a. = 0) of at least one CTCF loop anchor. h. Pairwise mean observed/expected contact frequency between MCDs at discrete points of mitotic exit, as indicated, in control and RanGAP1-depleted cells. MCD-MCD contacts are categorised by the presence of a convergent CTCF loop or loop anchor (> 0) and the looping domain status of the constituent MCDs, as indicated. i. Schematic summary of microcompartment fates in G1 cells based on the spatial relationships of constituent MCDs to extrusion-dependent features. j. Representative Hi-C interaction frequency maps at 25kb (Chr7: 20.5–28.5 Mb) resolution and a 10kb zoom-in (Chr7: 25.7–28.0 Mb),showing differences in genome organisation between two looping domains in control (upper triangle) and RanGAP1-AID-depleted G1 cells (t = 5h, lower triangle). Matched MCD position tracks, as well as control cell EV1 values, H3K27ac Cut&Run signal, and gene annotations are shown. k. Representative Hi-C interaction frequency maps at 50kb (Chr8: 29.5–39.5 Mb) and 10kb (Chr8: 29.5–31.5 Mb v. 37.3–39.5 Mb) resolution showing differences in genome organization at loop anchored and extrusion-free MCDs in control and RanGAP1-AID-depleted G1 cells (t = 5h). Matched MCD position tracks, as well as control cell EV1 values, H3K27ac Cut&Run signal, and gene annotations are shown.
Fig. 6:
Fig. 6:. The post-mitotic microcompartment is resorbed by multiple distinct G1 compartments
a. Representative Hi-C interaction frequency maps at 50kb resolution (Chr7: 47.5–80 Mb) showing changes in genome organisation from cytokinesis (upper triangle) to G1 (t = 5h, lower triangle). Matched EV1 values and Interaction Profile Groups (IPGs) are shown. b. Saddle plots representing the segregation of active (A) and inactive (B) chromatin compartments in cis for control and RanGAP1-depleted cells 5h after mitotic release (early G1). The first eigenvector from each condition was used to rank 25 kb genomic bins into equal quantiles and the average interaction frequency between these ranked bins was normalized to the expected interactions to build the heatmap. Quantification of the average preferential A-A and B-B interactions for the top 20% strongest A and B loci are indicated. c. Quantification of average preferential A-A and B-B interaction strength in control and RanGAP1-AID-depleted cells demonstrating increased A/B segregation over the course of mitotic exit. Ranked bins designating A and B compartments were derived from the first eigenvector of the 5h control G1 cells at 25 kb resolution for comparison. d. Pairwise aggregate observed/expected contact frequency between DLD-1 IPGs showing enhanced homo-typic interactions in control and RanGAP1-AID-depleted cells from cytokinesis to early G1 (top). Aggregate observed/expected interactions between MCDs as a subset of each IPG demonstrate the cell cycle dynamics of a distinct micro-compartment in the presence or absence of RanGAP1 (bottom). e. Quantification of aggregate saddle plots in (d). Mean observed/ expected homo-typic interaction frequency is shown for all IPGs (top) or IPGs divided by the presence or absence of an MCD. Line colors are following the subcompartments shown in panel d.
Fig. 7:
Fig. 7:. The nuclear proteome of transport deficient G1 cells
a. Experimental workflow for SILAC-based LC-MS quantification of nuclear proteome alterations found in cells entering G1 (t=5h) in the absence of either RanGAP1 or Nup93. Auxin-induced degradation is initiated 2h prior to nocodazole/mitotic release (t=0). b. Volcano plots for the consensus list of proteins identified in early G1 nuclear isolates from RanGAP1- and Nup93-AID cells. For each protein, the enrichment in auxin-treated vs. control cells (Log2-FC) is plotted against the BH-adjusted p value (p=0.05 and p=BH threshold are indicated). Two pooled replicates for heavy and light reversed experiments are shown and each protein is colored by the delta/ctrl ratio in the RanGAP1-AID. c. Gene ontology over-representation analysis for selected biological processes among all proteins identified in RanGAP1-AID and Nup93-AID control G1 nuclei (“all found”), or proteins reduced by at least 2-fold in the nuclei of both RanGAP-AID- and Nup93-AID-depleted cells (“down delta”). Dots are colored by the False Discovery Rate (FDR) and dot size indicates fold enrichment. d. Heatmaps representing the changes in the abundance of selected proteins involved in genome folding and function in RanGAP1-AID- or Nup93-AID-depleted G1 nuclei. The Log2-fold enrichment in auxin-treated vs. control nuclei was calculated separately for each individual replicate and for the pooled (reversed) LC-MS spectra. e. Representative immunofluorescence images of RanGAP1-AID or Nup93-AID control and depleted cells fixed 5h after mitotic release demonstrating the nucleo-cytoplasmic localisation of RNApolII (coloured red). Lamin A/C indicates the nuclear periphery. Scale bar represents 10 um.

Similar articles

References

    1. Abramo K, Valton A-L, Venev SV, Ozadam H, Fox AN, Dekker J. 2019. A chromosome folding intermediate at the condensin-to-cohesin transition during telophase. Nat Cell Biol 21: 1393–1402. - PMC - PubMed
    1. Akgol Oksuz B, Yang L, Abraham S, Venev SV, Krietenstein N, Parsi KM, Ozadam H, Oomen ME, Nand A, Mao H, et al. 2021. Systematic evaluation of chromosome conformation capture assays. Nat Methods 18: 1046–1055. - PMC - PubMed
    1. Ashburner M, Ball CA, Blake JA, Botstein D, Butler H, Cherry JM, Davis AP, Dolinski K, Dwight SS, Eppig JT, et al. 2000. Gene ontology: tool for the unification of biology. The Gene Ontology Consortium. Nat Genet 25: 25–29. - PMC - PubMed
    1. Banigan EJ, Tang W, van den Berg AA, Stocsits RR, Wutz G, Brandão HB, Busslinger GA, Peters J-M, Mirny LA. 2023. Transcription shapes 3D chromatin organization by interacting with loop extrusion. Proc Natl Acad Sci U S A 120: e2210480120. - PMC - PubMed
    1. Bannister AJ, Zegerman P, Partridge JF, Miska EA, Thomas JO, Allshire RC, Kouzarides T. 2001. Selective recognition of methylated lysine 9 on histone H3 by the HP1 chromo domain. Nature 410: 120–124. - PubMed

Publication types

LinkOut - more resources