Loading [MathJax]/jax/output/PreviewHTML/jax.js
Skip to main page content
U.S. flag

An official website of the United States government

Access keys NCBI Homepage MyNCBI Homepage Main Content Main Navigation
. 2024 Sep 28;43(1):265.
doi: 10.1186/s13046-024-03189-3.

Inactivation of HIPK2 attenuates KRASG12D activity and prevents pancreatic tumorigenesis

Affiliations

Inactivation of HIPK2 attenuates KRASG12D activity and prevents pancreatic tumorigenesis

Silvia Sozzi et al. J Exp Clin Cancer Res. .

Abstract

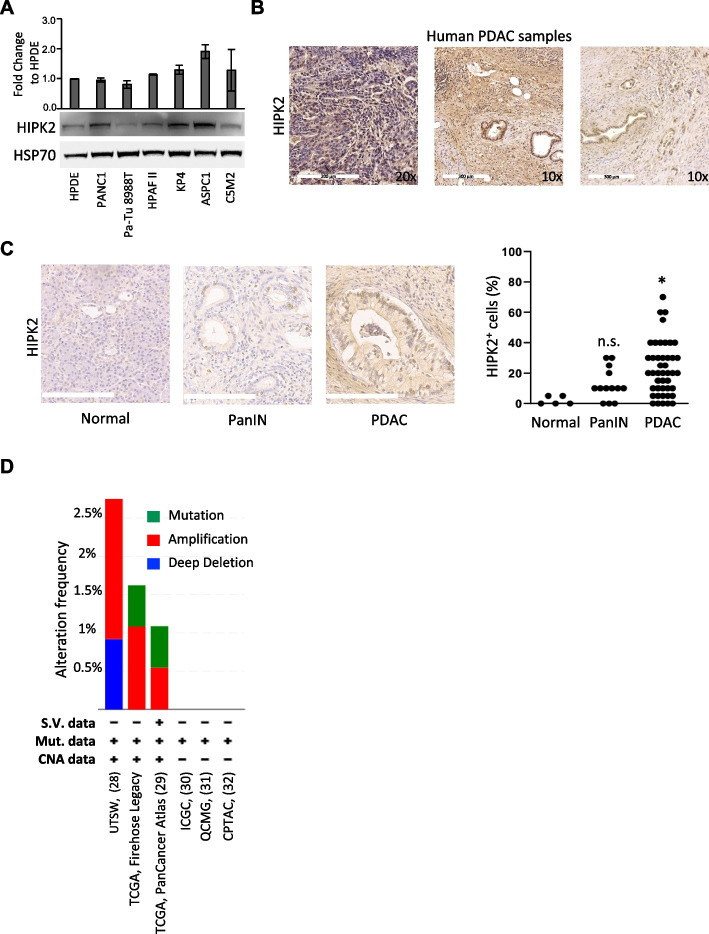
Background: Pancreatic ductal adenocarcinoma (PDAC) features KRAS mutations in approximately 90% of human cases and excessive stromal response, termed desmoplastic reaction. Oncogenic KRAS drives pancreatic carcinogenesis by acting on both epithelial cells and tumor microenvironment (TME). We have previously shown that Homeodomain-Interacting Protein Kinase 2 (HIPK2) cooperates with KRAS in sustaining ERK1/2 phosphorylation in human colorectal cancers. Here, we investigated whether HIPK2 contributes to oncogenic KRAS-driven tumorigenesis in vivo, in the onset of pancreatic cancer.

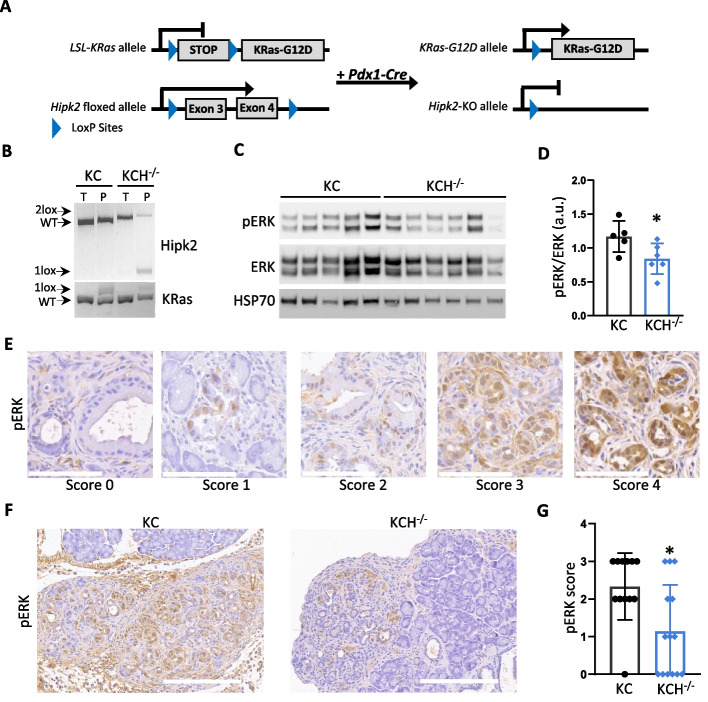
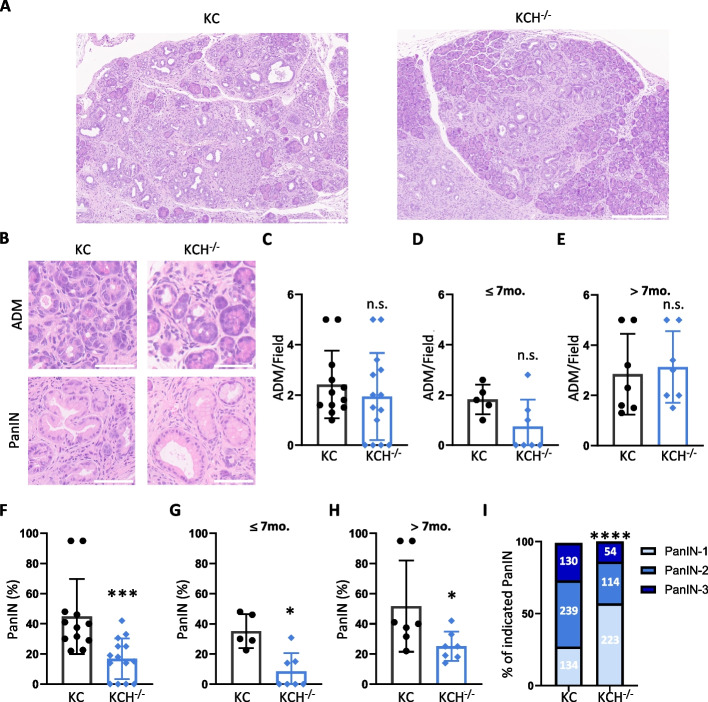
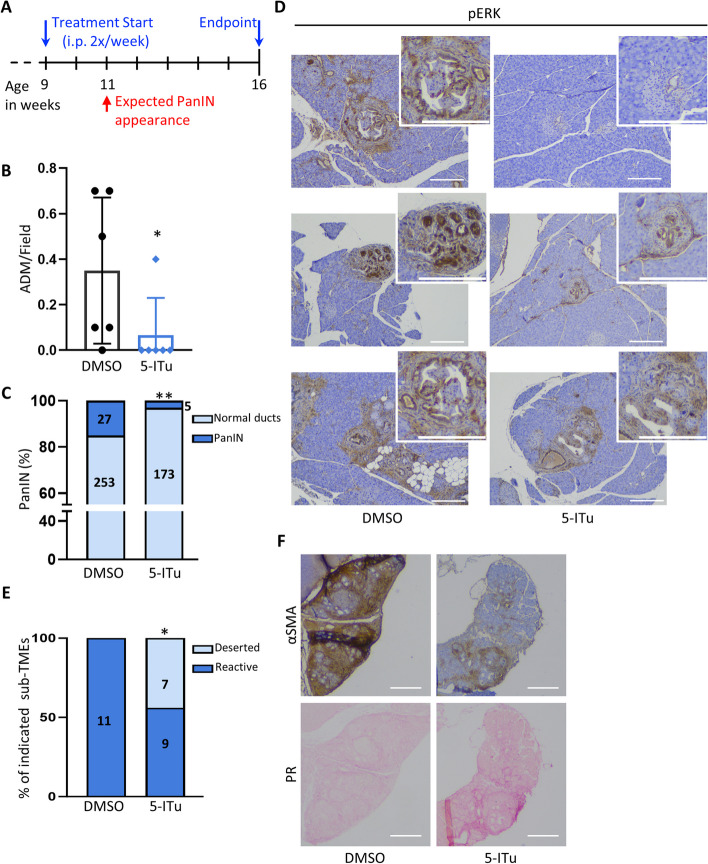
Methods: We employed an extensively characterized model of KRASG12D-dependent preinvasive PDAC, the Pdx1-Cre;LSL-KRasG12D/+ (KC) mice. In these mice, HIPK2 was inhibited by genetic knockout in the pancreatic epithelial cells (KCH-/-) or by pharmacologic inactivation with the small molecule 5-IodoTubercidin (5-ITu). The development of preneoplastic acinar-to-ductal metaplasia (ADM), intraepithelial neoplasia (PanIN), and their associated desmoplastic reaction were analyzed.

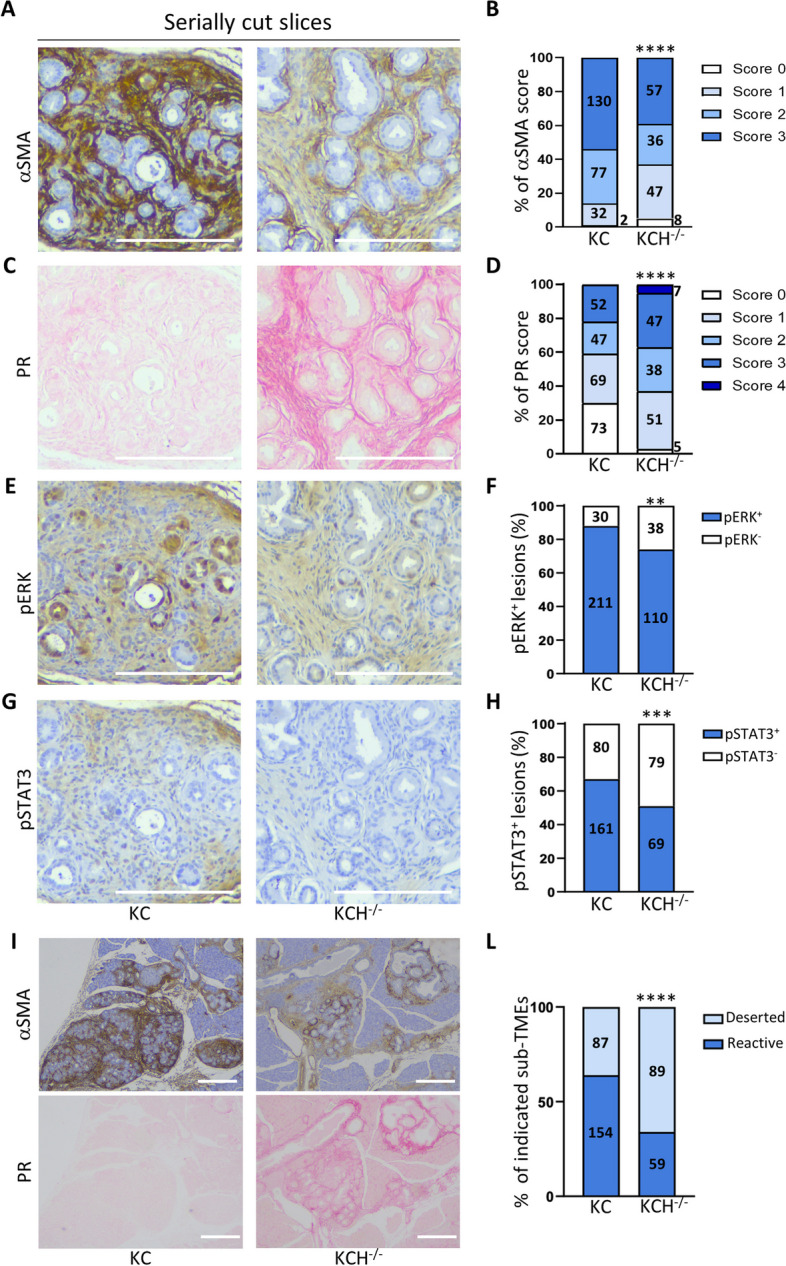
Results: In Hipk2-KO mice (KCH-/-), ERK phosphorylation was lowered, the appearance of ADM was slowed down, and both the number and pathologic grade of PanIN were reduced compared to Hipk2-WT KC mice. The pancreatic lesion phenotype in KCH-/- mice was characterized by abundant collagen fibers and reduced number of αSMA+ and pSTAT3+ desmoplastic cells. These features were reminiscent of the recently described human "deserted" sub-TME, poor in cells, rich in matrix, and associated with tumor differentiation. In contrast, the desmoplastic reaction of KC mice resembled the "reactive" sub-TME, rich in stromal cells and associated with tumor progression. These observations were confirmed by the pharmacologic inhibition of HIPK2 in KC mice.

Conclusion: This study demonstrates that HIPK2 inhibition weakens oncogenic KRAS activity and pancreatic tumorigenesis providing a rationale for testing HIPK2 inhibitors to mitigate the incidence of PDAC development in high-risk individuals.

Keywords: HIPK2; KRAS; Pancreatic tumorigenesis.


Conflict of interest statement

The authors declare that they have no competing interest.

Figures

Fig. 1
Fig. 1
HIPK2 is expressed in human PDACs. A WB analysis of HIPK2 in whole cell lysates of the indicated human pancreatic and PDAC-derived cell lines. HSP70 was used as loading control. The histogram indicates the mean ± standard error of HIPK2 fold change expression relative to HPDE in three independent experiments. B Representative images of IHC for HIPK2 in three different human PDAC samples. C Representative images for HIPK2 immunostaining in normal, PanIN and PDAC ducts are reported on the left. Scale bars are 200 µm. Quantification of the percentage of HIPK2+ cells in the indicated tissues is reported as dot plot on the right. ANOVA test with Tukey’s multiple comparison test, * P < 0.05, n.s.: not significant. D TCGA analysis of the HIPK2 gene alteration frequency as reported in cBioPortal (https://www.cbioportal.org/). S.V.: Structural variant; Mut.: Mutation. CNA: Copy Number Alteration. Each histogram shows the frequency of HIPK2 gene alteration in the indicated dataset
Fig. 2
Fig. 2
The levels of pERK are reduced in KCH−/− pancreata. A Schematic representation of LSL-KRasG12D/+ and Hipk2flox/flox recombinant alleles. B Representative genotyping analysis for Hipk2flox and LSL-KRasG12D alleles of tail (T) and pancreas (P) from Pdx1-Cre;LSL-KRasG12D/+ (KC) and Pdx1-Cre;LSL-KRasG12D/+;Hipk2flox/flox (KCH−/−) mice. Floxed (2lox) and recombined (1lox) alleles are indicated by arrows. C WB analysis of pERK levels in KC and KCH−/− pancreata. HSP70 was used as loading control. D Normalized levels of pERK represented as ratio of pERK and total ERK densitometry values. Mean ± Standard Deviation (SD) is reported. Student’s t-test, * P < 0.05. E Representative IHC images for each pERK score. Scale bars are 100 µm. F Representative IHC images of pERK in KC and KCH−/− pancreata. Scale bars are 200 µm. G Scatter plot bar of pERK score in all KC and KCH−/− mice. Mean ± SD is reported at the bottom. Mann–Whitney’s test, * P < 0.05
Fig. 3
Fig. 3
Depletion of HIPK2 reduces pancreatic tumorigenesis in KC mice. A Representative images of pancreas slices from KC and KCH−/− stained with H&E. PanIN and ADM lesions are visible. Scale bars are 300 µm. B Representative images of ADM and PanIN in KC and KCH−/− pancreata. Bar is 50 µm. C ADM in each visual field were counted in 12 KC and 14 KCH−/− pancreatic samples stained by H&E. Corresponding quantification for each mouse is reported in the scatter plot bar. Mean ± SD, Mann–Whitney’s test, n.s. not significant. D-E Data in B were divided into two subgroups based on the mouse age at the euthanization to obtain ADM histograms in mice younger or older than 7 months ( 7mo and > 7mo), respectively. Mean ± SD, Mann–Whitney’s test, n.s. not significant. F The percentage of PanINs relative to unaffected ducts was evaluated on the same samples described in B and shown as scatter plot bar. Mean ± SD, Mann–Whitney’s test, *** P < 0.001. G-H Data in E were divided in two subgroups ( 7mo and > 7mo) as described above. Mean ± SD, Mann–Whitney’s test, * P < 0.05. I, PanINs present in the H&E samples were counted based on their grade. The percentage of each PanIN grade is shown and the number of counted PanINs is indicated inside the histograms. Fisher’s exact test, **** P < 0.0001
Fig. 4
Fig. 4
Loss of HIPK2 determines different oncogenic KRAS sub-TMEs. Pancreatic lesions of all KC and KCH−/− mice were analyzed with the indicated staining by serially cut slices. Scale bars are 200 µm AB, Representative images of IHC for aSMA are shown in A; the percentages of the different score staining intensity (from 0 to 3) are reported in B and the number of lesions counted for each score is indicated inside the histograms; Fisher’s exact test, **** P < 0.0001. CD Representative images of PR staining are shown in C; the percentages of the different score staining intensity (from 0 to 4) are reported in D and the number of lesions counted for each score is indicated inside the histograms; Fisher’s exact test, **** P < 0.0001. EF Representative images of IHC for pERK are shown in E; the percentages of lesions positive for pERK (pERK+) are reported as histograms in F, Fisher’s exact test, ** P < 0.01. GH Representative images of IHC for pSTAT3 are shown in G; the percentages of lesions positive for pSTAT3 (pSTAT3.+) are reported as histograms in H, Fisher’s exact test, *** P < 0.001. I Representative images of αSMA (upper images) and Picrosirius Red (lower images) showing reactive and deserted sub-TMEs in the indicated mice. L The percentages of lesions with reactive and deserted sub-TME are reported and the number of lesions counted for each sub-TME is indicated inside the histograms. Fisher’s exact test, **** P < 0.0001
Fig. 5
Fig. 5
Inhibition of HIPK2 by 5-ITu prevents the onset of ADM and PanIN. A Schematic representation of the experimental design. B ADM in each visual field were counted in all DMSO and 5-ITu treated FVB-KC mice. The corresponding number of ADM per field for each mouse is reported in the scatter plot bar. Mean ± SD, Mann–Whitney’s test *P < 0.05. C Quantification of PanINs in the same DMSO and 5-ITu treated FVB-KC mice analyzed in B. The corresponding percentages are reported and the total number of normal ducts and PanINs counted is indicated inside the histograms. Fisher’s exact test, ** P < 0.01 D Representative images of pERK staining in DMSO and 5-ITu treated FVB-KC mice. For each image a 2x-magnified detail is shown in the upper-right corner. E The percentages of lesions with reactive and deserted sub-TMEs in DMSO and 5-ITu treated samples are reported. The total number of reactive and deserted subTMEs counted is indicated inside the histograms. Fisher’s Exact test, * P < 0.05. F Representative images of reactive and deserted sub-TMEs stained with αSMA (upper images) and Picrosirius Red (lower images). Scale bars are 200 µm

Similar articles

References

    1. Bray F, Colombet M, Aitken JF, Bardot A, Eser S, Galceran J, et al. Cancer Incidence in Five Continents, Vol. XII (IARC CancerBase No. 19). Lyon: International Agency for Research on Cancer; 2023. Available from: https://ci5.iarc.who.int.
    1. Canto MI, Hruban RH, Fishman EK, Kamel IR, Schulick R, Zhang Z, et al. Frequent detection of pancreatic lesions in asymptomatic high-risk individuals. Gastroenterology. 2012;142:796–804. - PMC - PubMed
    1. Al-Sukhni W, Joe S, Lionel AC, Zwingerman N, Zogopoulos G, Marshall CR, et al. Identification of germline genomic copy number variation in familial pancreatic cancer. Hum Genet. 2012;131:1481–94. - PMC - PubMed
    1. Asahina K, Balog S, Hwang E, Moon E, Wan E, Skrypek K, et al. Moderate alcohol intake promotes pancreatic ductal adenocarcinoma development in mice expressing oncogenic Kras. Am J Physiol Gastrointest Liver Physiol. 2020;318:G265–76. - PMC - PubMed
    1. Alonso-Curbelo D, Ho YJ, Burdziak C, Maag JLV, Morris JP 4th, Chandwani R, et al. A gene-environment-induced epigenetic program initiates tumorigenesis. Nature. 2021;590:642–8. - PMC - PubMed

MeSH terms