Determination of key hub genes in Leishmaniasis as potential factors in diagnosis and treatment based on a bioinformatics study
- PMID: 39342024
- PMCID: PMC11438978
- DOI: 10.1038/s41598-024-73779-w
Determination of key hub genes in Leishmaniasis as potential factors in diagnosis and treatment based on a bioinformatics study
Abstract
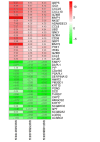
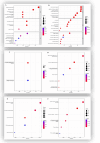
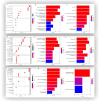
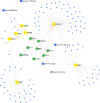
Leishmaniasis is an infectious disease caused by protozoan parasites from different species of leishmania. The disease is transmitted by female sandflies that carry these parasites. In this study, datasets on leishmaniasis published in the GEO database were analyzed and summarized. The analysis in all three datasets (GSE43880, GSE55664, and GSE63931) used in this study has been performed on the skin wounds of patients infected with a clinical form of leishmania (Leishmania braziliensis), and biopsies have been taken from them. To identify differentially expressed genes (DEGs) between leishmaniasis patients and controls, the robust rank aggregation (RRA) procedure was applied. We performed gene functional annotation and protein-protein interaction (PPI) network analysis to demonstrate the putative functionalities of the DEGs. The study utilized Molecular Complex Detection (MCODE), Gene Ontology (GO), and Kyoto Encyclopedia of Genes and Genomes (KEGG) to detect molecular complexes within the protein-protein interaction (PPI) network and conduct analyses on the identified functional modules. The CytoHubba plugin's results were paired with RRA analysis to determine the hub genes. Finally, the interaction between miRNAs and hub genes was predicted. Based on the RRA integrated analysis, 407 DEGs were identified (263 up-regulated genes and 144 down-regulated genes). The top three modules were listed after creating the PPI network via the MCODE plug. Seven hub genes were found using the CytoHubba app and RRA: CXCL10, GBP1, GNLY, GZMA, GZMB, NKG7, and UBD. According to our enrichment analysis, these functional modules were primarily associated with immune pathways, cytokine activity/signaling pathways, and inflammation pathways. However, a UBD hub gene is interestingly involved in the ubiquitination pathways of pathogenesis. The mirNet database predicted the hub gene's interaction with miRNAs, and results revealed that several miRNAs, including mir-146a-5p, crucial in fighting pathogenesis. The key hub genes discovered in this work may be considered as potential biomarkers in diagnosis, development of agonists/antagonist, novel vaccine design, and will greatly contribute to clinical studies in the future.
Keywords: Differentially expressed genes; GEO database; Leishmaniasis; Microarray; RRA method.
© 2024. The Author(s).
Conflict of interest statement
The authors declare no competing interests.
Figures


Similar articles
-
An integrated bioinformatic analysis of microarray datasets to identify biomarkers and miRNA-based regulatory networks in leishmaniasis.Sci Rep. 2024 Jun 5;14(1):12981. doi: 10.1038/s41598-024-63462-5. Sci Rep. 2024. PMID: 38839916 Free PMC article.
-
Integrated Analysis of Multiple Microarray Studies to Identify Novel Gene Signatures in Ulcerative Colitis.Front Genet. 2021 Jul 9;12:697514. doi: 10.3389/fgene.2021.697514. eCollection 2021. Front Genet. 2021. PMID: 34306038 Free PMC article.
-
Identification of key candidate genes and biological pathways in neuropathic pain.Comput Biol Med. 2022 Nov;150:106135. doi: 10.1016/j.compbiomed.2022.106135. Epub 2022 Sep 22. Comput Biol Med. 2022. PMID: 36166989
-
Identification of hub genes and key pathways in arsenic-treated rice (Oryza sativa L.) based on 9 topological analysis methods of CytoHubba.Environ Health Prev Med. 2024;29:41. doi: 10.1265/ehpm.24-00095. Environ Health Prev Med. 2024. PMID: 39111872 Free PMC article.
-
Effects of dietary curcumin on gene expression: An analysis of transcriptomic data in mice.Pathol Res Pract. 2024 Oct 11;263:155653. doi: 10.1016/j.prp.2024.155653. Online ahead of print. Pathol Res Pract. 2024. PMID: 39426142 Review.
References
-
- Abpeikar, Z., Safaei, M., Alizadeh, A. A., Goodarzi, A. & Hatam, G. The novel treatments based on tissue engineering, cell therapy and nanotechnology for cutaneous leishmaniasis. Int. J. Pharm. 2023, 122615 (2023). - PubMed
-
- Eshetu, E. & Bassa, A. A. T. The Public Health significance of Leishmaniasis: an overview. J. Nat. Sci. Res. 6, 48–57 (2016).
-
- Mukbel, R. M. et al. Human immune response to salivary proteins of wild-caught Phlebotomus papatasi. Parasitol. Res. 115, 3345–3355 (2016). - PubMed
MeSH terms
Substances
Grants and funding
LinkOut - more resources
Full Text Sources
Medical
Research Materials

