. 2024 Sep 18;16(9):1482.
doi: 10.3390/v16091482.

The Autonomous Fusion Activity of Human Cytomegalovirus Glycoprotein B Is Regulated by Its Carboxy-Terminal Domain

Affiliations

The Autonomous Fusion Activity of Human Cytomegalovirus Glycoprotein B Is Regulated by Its Carboxy-Terminal Domain

Nina Reuter et al. Viruses. .

Abstract

The human cytomegalovirus (HCMV) glycoprotein B (gB) is the viral fusogen required for entry into cells and for direct cell-to-cell spread of the virus. We have previously demonstrated that the exchange of the carboxy-terminal domain (CTD) of gB for the CTD of the structurally related fusion protein G of the vesicular stomatitis virus (VSV-G) resulted in an intrinsically fusion-active gB variant (gB/VSV-G). In this present study, we employed a dual split protein (DSP)-based cell fusion assay to further characterize the determinants of fusion activity in the CTD of gB. We generated a comprehensive library of gB CTD truncation mutants and identified two mutants, gB-787 and gB-807, which were fusion-competent and induced the formation of multinucleated cell syncytia in the absence of other HCMV proteins. Structural modeling coupled with site-directed mutagenesis revealed that gB fusion activity is primarily mediated by the CTD helix 2, and secondarily by the recruitment of cellular SH2/WW-domain-containing proteins. The fusion activity of gB-807 was inhibited by gB-specific monoclonal antibodies (MAbs) targeting the antigenic domains AD-1 to AD-5 within the ectodomain and not restricted to MAbs directed against AD-4 and AD-5 as observed for gB/VSV-G. This finding suggested a differential regulation of the fusion-active conformational state of both gB variants. Collectively, our findings underscore a pivotal role of the CTD in regulating the fusogenicity of HCMV gB, with important implications for understanding the conformations of gB that facilitate membrane fusion, including antigenic structures that could be targeted by antibodies to block this essential step in HCMV infection.

Keywords: blocking fusion; cell-cell fusion; gH/gL-independent fusion; glycoprotein B; herpesvirus; human cytomegalovirus; monoclonal antibodies.


Conflict of interest statement

The authors declare no commercial or financial conflicts of interest.

Figures

Figure 1
Figure 1
Schematic representation of human cytomegalovirus (HCMV) glycoprotein B (gB)and the gB carboxy-terminal domain (CTD) mutant constructs. (Top) Linear representation of full-length HCMV gB, strain AD169 (accession number P06473). The regions representing the structural domains I-V are displayed in different colors in analogy to the crystal structure [27]. Numbers indicate the borders of the individual domains, brackets in the top line indicate disulfide bonds and the arrowhead highlights the cleavage site of the cellular endopeptidase furin. The antigenic domains, named AD-1 through AD-6, are indicated. SP, signal peptide; MPR, membrane proximal region; TM, transmembrane domain; CTD, carboxy-terminal domain. (Bottom) Amino acid sequences of the AD169gB CTD (gB) and its truncated derivatives, which were generated and characterized in this study.
Figure 2
Figure 2
Cell–cell fusion activity of gB CTD-mutants. (ad) 293T-DSP-mix cells were transfected with vectors encoding either of the gB constructs shown in Figure 1 or an empty vector (mock), as indicated. The fusion-competent gB/VSV-G chimera served as an internal positive control. (a) Indirect immunofluorescence analyses of transfected 293T-DSP-mix cells. Cells were fixed and permeabilized and cell nuclei visualized by DAPI (top row). Expression and subcellular protein localization were analyzed via confocal laser scanning microscopy by using the anti-gB antibody 27–287 ((second row), gB). Cell–cell fusion was examined via the GFP-signal of the reconstituted DSP-reporter protein ((third row), GFP) as well as by the formation of multinucleated syncytia ((lowest row), merge). (bd) Automated quantification of cell–cell fusion (b) via GFP counts at the CTL-Fluorospot reader or (c,d) by bioluminescence given in relative light units (RLU) upon RLuc-mediated cleavage of EnduRen. Experiments were performed at least three times; one representative result is shown and depicts the mean values of biological triplicates ± standard deviations. Statistical analysis was performed by using one-way ANOVA using Bonferroni’s multiple comparison test, ***: p < 0.001, ****: p < 0.0001. p values refer to cells transfected with mock (b,c) or gB/VSV-G (d) and were not statistically significant if not indicated.
Figure 3
Figure 3
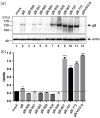
Expression and cell surface exposure of HCMV gB CTD-mutants. (a,b) 293T-DSP-mix cells were transfected with vectors encoding the indicated gB construct or an empty vector (mock). (a) Three days later, Western blot analyses were performed by using anti-gB C23 (upper blot) or β-actin (lower blot) for protein detection. (b) Cell surface exposure of gB constructs as evaluated by cELISA. Two days after transfection of triplicates per construct, cells were incubated with the mouse anti-gB antibody 27–287 for 30 min before fixation. Thereafter, cells were washed and incubated with biotinylated goat anti-mouse IgG conjugate followed by incubation with streptavidin–horseradish peroxidase conjugate. Next, TMB peroxidase substrate was added before the reaction was stopped by adding phosphoric acid, and the optical density at 450 nm (OD450) was determined. Experiments were performed at least three times; one representative result is shown. The values depict the mean of biological triplicates ± standard deviations. Statistical analysis was performed by using one-way ANOVA using Bonferroni’s multiple comparison test, **: p < 0.01, ****: p < 0.0001. p values refer to mock transfected cells (dashed line) and were not significantly increased if not indicated.
Figure 4
Figure 4
Non-neutralizing polyclonal anti-gB serum blocks gB-807-mediated fusion. (a,b) 293T-DSP-mix cells were transfected with vectors encoding gB-807 or an empty vector (mock). At 4 h posttransfection, the cultures were washed, and fresh medium was added without serum (w/o) or medium containing log2 dilutions of serum derived from mice immunized with soluble gB (left), or naïve serum (right), respectively. At 72 h after transfection, cell–cell fusion was quantified by a Fluorospot reader as specified in Materials and Methods. GFP counts were derived from biological triplicates and represent mean values ± standard deviations. Statistical analysis was performed by using one-way ANOVA using Bonferroni’s multiple comparison test, **: p < 0.01, ****: p < 0.0001. p values refer to the gB-807 transfected cells without treatment (w/o, dashed line) and were not statistically significant if not indicated. (b) These data from (a) were used to calculate the serum-mediated inhibition of fusion in percent based on the GFP counts in relation to the nontreated control (w/o). The half-maximal inhibitory concentration (IC50) is indicated by a dashed line.
Figure 5
Figure 5
Identification of anti-gB MAbs that potently block membrane fusion of gB/VSV-G or gB-807. (ad) 293T-DSP-mix cells were transfected with vectors encoding gB/VSV-G (a,c), gB-807 (b,d), or an empty vector (mock). At 4 h posttransfection, the cultures were washed, and fresh medium (no antibody) or medium containing 25 µg/mL (a,b) or 5 µg/mL (c,d) of the anti-gB (SDZ 89–104, 27–39, 27–287, C23, SM5–1, 1G2, SM10, or 2C2) and anti-gH (SA4) MAbs as well as 150 µg/mL of the HIG Cytotect was added. At 72 h after transfection, cell–cell fusion was quantified by a Fluorospot reader (a,b) or by bioluminescence (c,d) as specified in Materials and Methods. Values were derived from biological triplicates and represent mean values ± standard deviations. Statistical analysis was performed by using one-way ANOVA using Bonferroni’s multiple comparison test, **: p < 0.01, ****: p < 0.0001. p values refer to the transfected cells without treatment (no antibody) and were not statistically significant if not indicated.
Figure 6
Figure 6
Carboxy-terminal determinants of HCMV gB’s fusion activity. (a) The amino acid sequence of AD169-gB is given for its CTD residues 773–906. Vertical lines at the top indicate the truncation mutants used in this study (gB-772 through gB-899; compare Figure 1). The Eukaryotic Linear Motif server (ELM, [45]) was used for the annotation of candidate motifs for interaction with 14–3-3 proteins, Atg8/LC3 (LIR), SH2, SH3, PDZ, TRAF4, or WW domains, as boxed and indicated in purple. Potential sorting motifs are indicated in green (di-Arg-ER retention or Tyr-sorting) and above the sequence. The predicted secondary structures (α-helices h1, h2, and h3) determined by Jpred4 [46] or modeled based on the structure of HSV-1 gB CTD [47] are depicted schematically below the sequence in gray or black, respectively. (b) 293T-DSP-mix cells were transfected with the indicated wild-type constructs of gB, gB-869, gB-838, and gB-820 or their mutated derivatives containing the amino acid substitutions S812A+Y813A (SY/AA). Cells transfected with an empty vector (mock) or the fusion-competent gB-807 served as internal negative and positive controls, respectively. Cell–cell fusion was quantified by bioluminescence as described in Materials and Methods section at 72 h posttransfection. Statistical analysis was performed by using one-way ANOVA using Bonferroni’s multiple comparison test, ****: p < 0.0001. p values refer to cells transfected with mock and were not statistically significant if not indicated. (a,c) Residues 701–906 of AD169gB were modeled by AlphaFold2.0 [44]. The results for the CTD are indicated schematically in (a) and the obtained structure is highlighted in (c) for one of the trimeric gB as follows: MPR is in light blue, TM is in black, and the CTD is rainbow colored from the N-terminus (dark blue) to C-terminus (dark red). The two other monomers of the gB trimer are depicted in gray. The terminal residues of the different truncation variants are shown in space-filled presentation and are labeled. The termini of the intrinsically fusion-competent gB-787 or gB-807 are highlighted and circled in red.

Similar articles

References

    1. Manicklal S., Emery V.C., Lazzarotto T., Boppana S.B., Gupta R.K. The “Silent” Global Burden of Congenital Cytomegalovirus. Clin. Microbiol. Rev. 2013;26:86–102. doi: 10.1128/CMR.00062-12. - DOI - PMC - PubMed
    1. Dreher A.M., Arora N., Fowler K.B., Novak Z., Britt W.J., Boppana S.B., Ross S.A. Spectrum of Disease and Outcome in Children with Symptomatic Congenital Cytomegalovirus Infection. J. Pediatr. 2014;164:855–859. doi: 10.1016/j.jpeds.2013.12.007. - DOI - PMC - PubMed
    1. Teira P., Battiwalla M., Ramanathan M., Barrett A.J., Ahn K.W., Chen M., Green J.S., Saad A., Antin J.H., Savani B.N., et al. Early cytomegalovirus reactivation remains associated with increased transplant-related mortality in the current era: A CIBMTR analysis. Blood. 2016;127:2427–2438. doi: 10.1182/blood-2015-11-679639. - DOI - PMC - PubMed
    1. Ramanan P., Razonable R.R. Cytomegalovirus Infections in Solid Organ Transplantation: A Review. Infect. Chemother. 2013;45:260. doi: 10.3947/ic.2013.45.3.260. - DOI - PMC - PubMed
    1. Chou S. Approach to drug-resistant cytomegalovirus in transplant recipients. Curr. Opin. Infect. Dis. 2015;28:293–299. doi: 10.1097/QCO.0000000000000170. - DOI - PMC - PubMed

Substances

LinkOut - more resources