. 2024 Sep 18;14(9):1169.
doi: 10.3390/biom14091169.

Exploration into Galectin-3 Driven Endocytosis and Lattices

Affiliations

Exploration into Galectin-3 Driven Endocytosis and Lattices

Massiullah Shafaq-Zadah et al. Biomolecules. .

Abstract

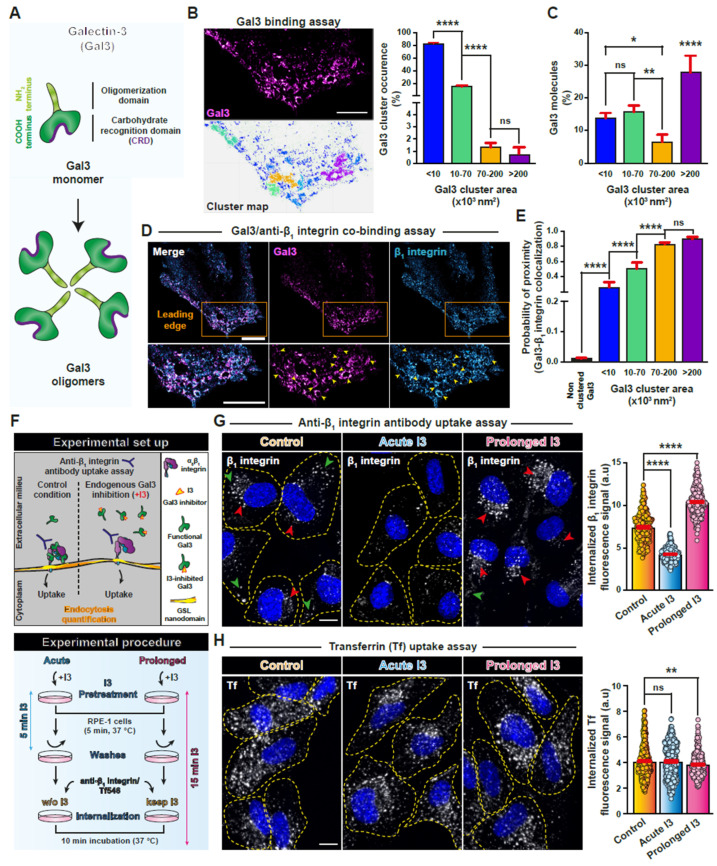
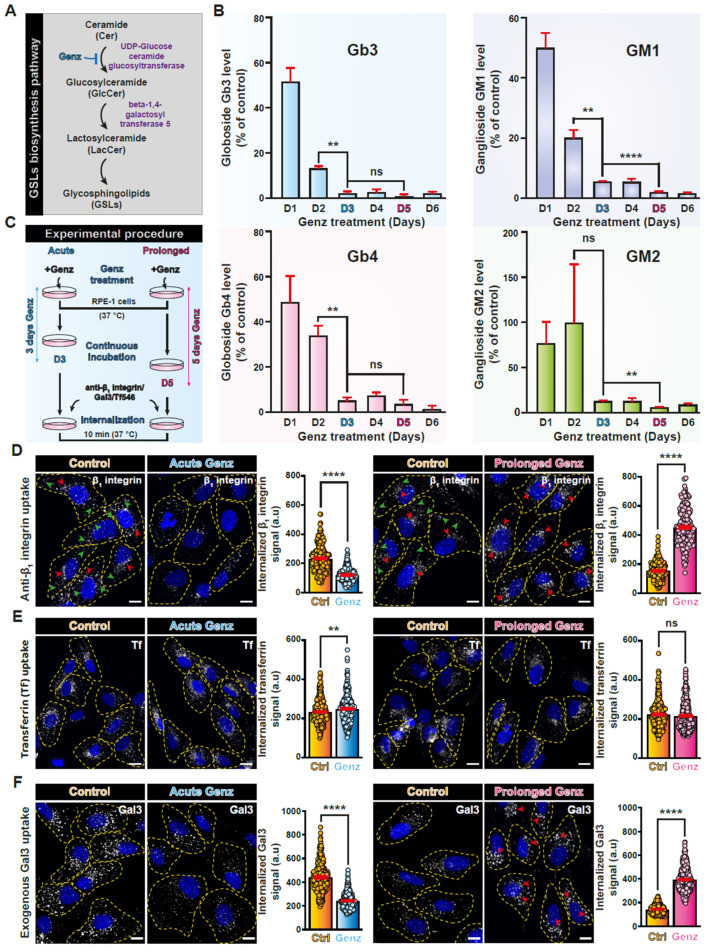
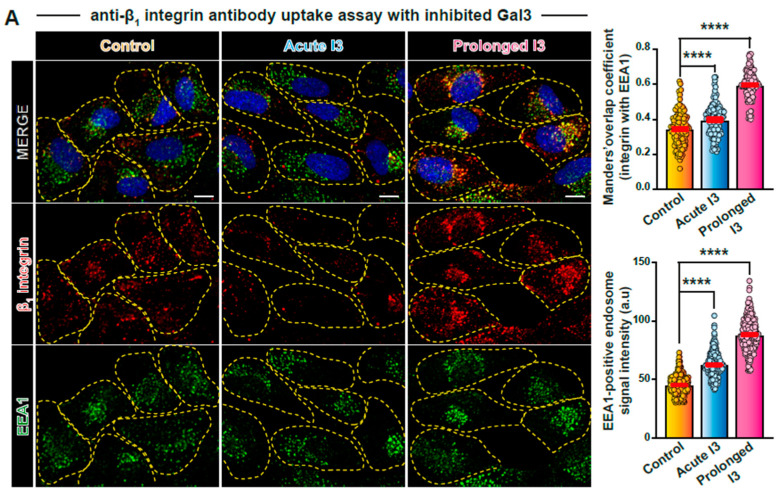
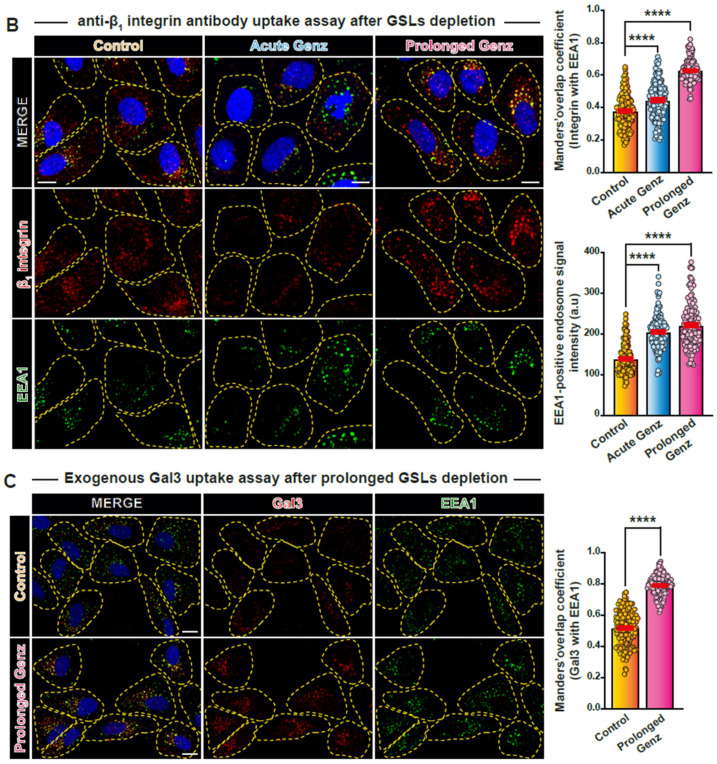
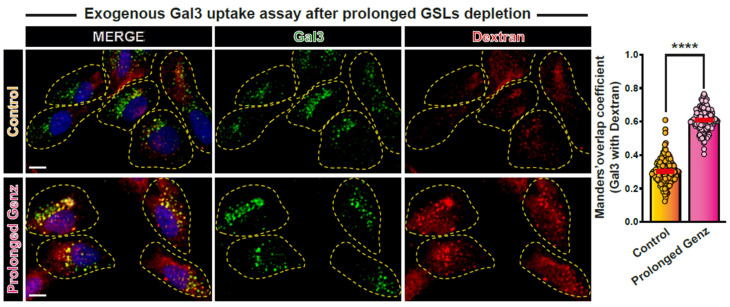
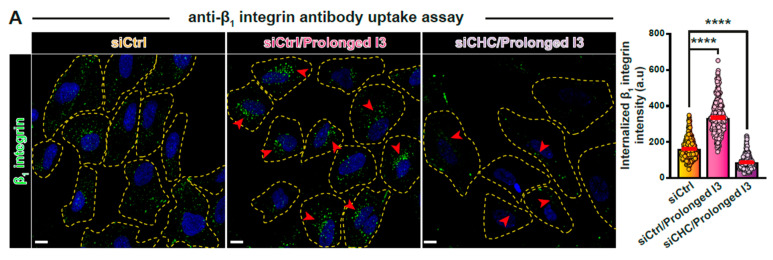
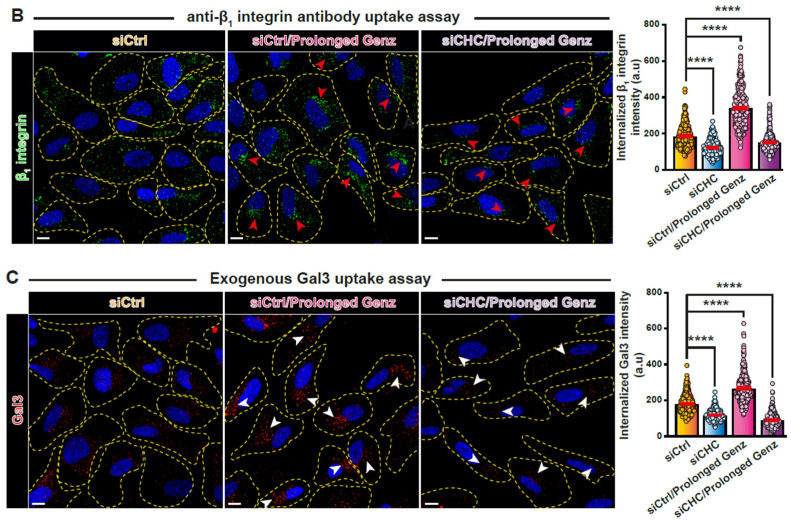
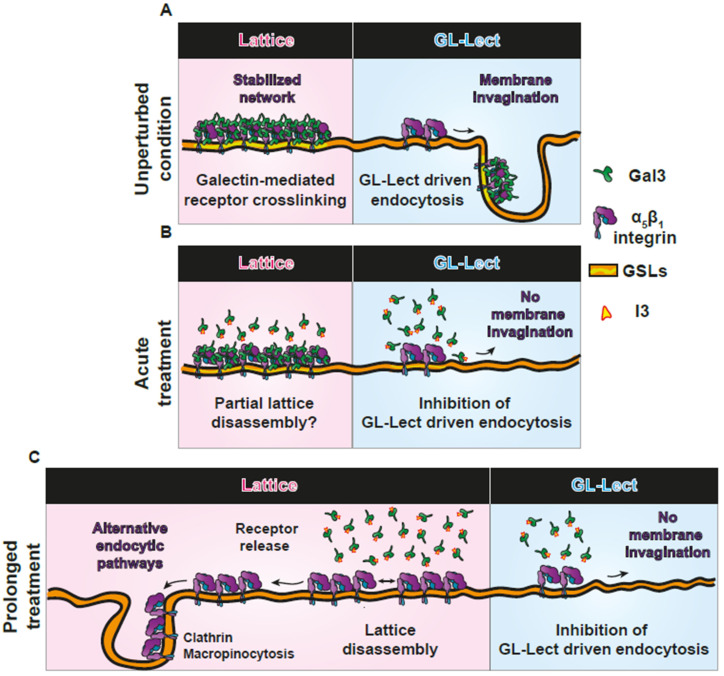
Essentially all plasma membrane proteins are glycosylated, and their activity is regulated by tuning their cell surface dynamics. This is achieved by glycan-binding proteins of the galectin family that either retain glycoproteins within lattices or drive their endocytic uptake via the clathrin-independent glycolipid-lectin (GL-Lect) mechanism. Here, we have used immunofluorescence-based assays to analyze how lattice and GL-Lect mechanisms affect the internalization of the cell adhesion and migration glycoprotein α5β1 integrin. In retinal pigment epithelial (RPE-1) cells, internalized α5β1 integrin is found in small peripheral endosomes under unperturbed conditions. Pharmacological compounds were used to competitively inhibit one of the galectin family members, galectin-3 (Gal3), or to inhibit the expression of glycosphingolipids, both of which are the fabric of the GL-Lect mechanism. We found that under acute inhibition conditions, endocytic uptake of α5β1 integrin was strongly reduced, in agreement with previous studies on the GL-Lect driven internalization of the protein. In contrast, upon prolonged inhibitor treatment, the uptake of α5β1 integrin was increased, and the protein was now internalized by alternative pathways into large perinuclear endosomes. Our findings suggest that under these prolonged inhibitor treatment conditions, α5β1 integrin containing galectin lattices are dissociated, leading to an altered endocytic compartmentalization.

Keywords: clathrin; endocytosis; galectin-3; gl-lect hypothesis; glycosphingolipids; lattices; α5β1 integrin.


Conflict of interest statement

Hakon Leffler and Ulf J. Nilsson are shareholders in Galecto Biotech Inc., a company that develops galectin inhibitors. The other authors declare that they have no conflicts of interest with the contents of this article.

Figures

Figure 1
Figure 1
Gal3-based duality in β1 integrin dynamics. (A) Schematic representation of the molecular organization of Gal3 where the C-terminal carbohydrate recognition domain (CRD) and the N-terminal oligomerization domain are indicated. (B) Left: Representative region of interest (leading edge) of a 2D STORM image of an RPE-1 cell showing surface-bound Gal3 (top) and the corresponding clusters obtained after segmentation (bottom). Right: The occurrence of each type of Gal3 cluster is shown in function of their surface area (×103 nm2). Means ± SEM, one-way ANOVA; ns = p > 0.05, **** p < 0.0001. Scale bar = 5 μm. (C) The percentage of Gal3 molecules is shown in function of the different Gal3 cluster populations. Means ± SEM, one-way ANOVA; ns = p > 0.05, * p < 0.05, ** p < 0.002, **** p < 0.0001. (D) 2D STORM image of Gal3 and anti-β1 integrin antibodies on RPE-1 cells (4 °C co-binding). A zoom of the leading edge is shown to illustrate the extensive level of colocalization between Gal3 and β1 integrin. Gal3 clusters with variable size and shape are detected (yellow arrowheads in the zoom). Scale bars = 5 μm. (E) Quantification of the probability of proximity (colocalization) between Gal3 and β1 integrin for each class of Gal3 clusters, compared to random non-clustered Gal3. Means ± SEM, one-way ANOVA; ns = p > 0.05, **** p < 0.0001. (F) Top: Anti-β1 integrin antibody uptake assay in RPE-1 cells. Internalized antibody is immunolabeled, imaged by confocal microscopy, and quantified. Bottom: Scheme of the protocol detailing the use of the Gal3 inhibitor I3 (10 μM) in acute versus prolonged incubation conditions. (G) Anti-β1 integrin antibody uptake assay as in (F). Note the shift from both peripheral (green arrowheads) and perinuclear (red arrowheads) distribution of internalized β1 integrin in control cells to exclusive perinuclear localization in the prolonged incubation condition. (H) Transferrin (Tf) internalization is very little affected by I3. In (G) and (H): Dashed lines indicate the contour of individual cells. Scale bars = 10 μm. Nuclei in blue (DAPI). Quantification of fluorescence intensities as means ± SEM, one-way ANOVA; ns = p > 0.05, ** p < 0.002, **** p < 0.0001.
Figure 2
Figure 2
GSL-based duality in β1 integrin dynamics. (A) Simplified schematic representation of the early steps of GSL synthesis. The reaction inhibited by Genz-123346 is indicated. (B) Analysis of cellular levels of the indicated GSL in function of incubation time with Genz-123346. Note that the most important drop occurs up to day 3. Means ± SEM, unpaired t-test; ns = p > 0.05, ** p < 0.002, **** p < 0.0001. (C) Scheme of experimental procedure detailing how GSL inhibition has been set up either in acute (3 days) or prolonged (5 days) incubation conditions, prior to cargo protein internalization for 10 min. (D) Anti-β1 integrin antibody uptake assay as in (C). Note that β1 integrin uptake is inhibited upon acute Genz-123346 treatment and increased upon prolonged treatment. In the latter condition, the intracellular accumulation of β1 integrin is massively perinuclear (red arrowheads), compared to control cells where peripheral localizations are also observed (green arrowheads). Means ± SEM, unpaired t-test; **** p < 0.0001. (E) Transferrin (Tf) internalization (10 min) is only mildly affected in all conditions. Means ± SEM, unpaired t-test; ns = p > 0.05, ** p < 0.002. (F) Internalization of exogenous Gal3 (10 min). Similar to β1 integrin, Gal3 endocytosis is significantly inhibited upon acute Genz-123346 treatment, and increased with perinuclear accumulation upon prolonged treatment (red arrowheads). Means ± SEM, unpaired t-test; **** p < 0.0001. In (DF): Yellow dashed lines indicate contours of cells; scale bars = 10 μm, nuclei in blue (DAPI).
Figure 3
Figure 3
Characterization of sites of perinuclear β1 integrin accumulation. (A,B) Anti-β1 integrin or (C) Gal3 uptake assay (10 min) under acute or prolonged I3 (A) or Genz-123346 (B,C) treatment followed by immunolabeling for EEA1. The colocalization of β1 integrin (A,B) or Gal3 (C) with EEA1 as well as the fluorescent intensity of EEA1 signal were quantified (right). Note the increased colocalization of internalized β1 integrin (A,B) or Gal3 (C) with EEA1 and increased EEA1 signal intensity, notably in the prolonged treatment conditions. Means ± SEM, one-way ANOVA (A,B), or unpaired t-test (C); **** p < 0.0001. Yellow dashed lines indicate contours of cells. Scale bars = 10 μm, nuclei in blue (DAPI).
Figure 3
Figure 3
Characterization of sites of perinuclear β1 integrin accumulation. (A,B) Anti-β1 integrin or (C) Gal3 uptake assay (10 min) under acute or prolonged I3 (A) or Genz-123346 (B,C) treatment followed by immunolabeling for EEA1. The colocalization of β1 integrin (A,B) or Gal3 (C) with EEA1 as well as the fluorescent intensity of EEA1 signal were quantified (right). Note the increased colocalization of internalized β1 integrin (A,B) or Gal3 (C) with EEA1 and increased EEA1 signal intensity, notably in the prolonged treatment conditions. Means ± SEM, one-way ANOVA (A,B), or unpaired t-test (C); **** p < 0.0001. Yellow dashed lines indicate contours of cells. Scale bars = 10 μm, nuclei in blue (DAPI).
Figure 4
Figure 4
Exogenous Gal3 and dextran 70K uptake upon prolonged GSL depletion. After prolonged (5 days) treatment with Genz-123346, RPE-1 cells were continuously co-incubated (10 min) with exogenous Gal3 and dextran 70K. Note the increased perinuclear accumulation of Gal3 and its increased overlap with dextran 70K under these conditions. Means ± SEM, unpaired t-test; **** p < 0.0001. Yellow dashed lines indicate contours of cells. Scale bars = 10 μm, nuclei in blue (DAPI).
Figure 5
Figure 5
Role of clathrin in endocytic uptake under prolonged treatment conditions. (AC) Uptake assays (10 min) of anti-β1 integrin antibodies (A,B) or Gal3 (C) upon prolonged I3 (A) or Genz-123346 (B,C) treatment. When indicated (siCHC), clathrin heavy chain was depleted (right images). The perinuclear accumulation of β1 integrin (A,B) or that of Gal3 (C) as observed in the prolonged treatment conditions (red or white arrowheads) is strongly inhibited upon clathrin depletion. Means ± SEM, one-way ANOVA; **** p < 0.0001. Yellow dashed lines indicate contours of cells. Scale bars = 10 μm, nuclei in blue (DAPI).
Figure 5
Figure 5
Role of clathrin in endocytic uptake under prolonged treatment conditions. (AC) Uptake assays (10 min) of anti-β1 integrin antibodies (A,B) or Gal3 (C) upon prolonged I3 (A) or Genz-123346 (B,C) treatment. When indicated (siCHC), clathrin heavy chain was depleted (right images). The perinuclear accumulation of β1 integrin (A,B) or that of Gal3 (C) as observed in the prolonged treatment conditions (red or white arrowheads) is strongly inhibited upon clathrin depletion. Means ± SEM, one-way ANOVA; **** p < 0.0001. Yellow dashed lines indicate contours of cells. Scale bars = 10 μm, nuclei in blue (DAPI).
Figure 6
Figure 6
Continuum model between lattices and GL-Lect driven endocytosis. (A) Unperturbed condition. A glycoprotein cargo, here α5β1 integrin, is either recruited into galectin lattices (left, underlined in red) or internalized by GL-Lect driven endocytosis (right, underlined in blue). (B) Acute treatment conditions. Since tubular endocytic pits for GL-Lect driven endocytosis are built de novo, acute interference with Gal3 activity or GSL expression prevents their formation. In contrast, preassembled galectin lattices resist under these conditions. (C) Prolonged treatment conditions. Even galectin lattices are disassembled. With GL-Lect driven endocytosis being inhibited, α5β1 integrin is now internalized by alternative endocytic pathways, i.e., clathrin-mediated endocytosis and macropinocytosis.

Similar articles

References

    1. Varki A., Cummings R.D., Esko J.D., Stanley P., Hart G.W., Aebi M., Mohnen D., Kinoshita T., Packer N.H., Prestegard J.H., et al. Essentials of Glycobiology. Cold Spring Harbor Laboratory Press; Cold Spring Harbor, NY, USA: 2022. Galectins; pp. 491–504. - PubMed
    1. Johannes L., Jacob R., Leffler H. Galectins at a glance. J. Cell Sci. 2018;131:jcs208884. doi: 10.1242/jcs.208884. - DOI - PubMed
    1. Banfer S., Schneider D., Dewes J., Strauss M.T., Freibert S.A., Heimerl T., Maier U.G., Elsasser H.P., Jungmann R., Jacob R. Molecular mechanism to recruit galectin-3 into multivesicular bodies for polarized exosomal secretion. Proc. Natl. Acad. Sci. USA. 2018;115:E4396–E4405. doi: 10.1073/pnas.1718921115. - DOI - PMC - PubMed
    1. Seelenmeyer C., Wegehingel S., Tews I., Kunzler M., Aebi M., Nickel W. Cell surface counter receptors are essential components of the unconventional export machinery of galectin-1. J. Cell Biol. 2005;171:373–381. doi: 10.1083/jcb.200506026. - DOI - PMC - PubMed
    1. Haudek K.C., Spronk K.J., Voss P.G., Patterson R.J., Wang J.L., Arnoys E.J. Dynamics of galectin-3 in the nucleus and cytoplasm. Biochim. Biophys. Acta. 2010;1800:181–189. doi: 10.1016/j.bbagen.2009.07.005. - DOI - PMC - PubMed

LinkOut - more resources