. 2024 Sep 14;13(9):1110.
doi: 10.3390/antiox13091110.

Senescence Rejuvenation through Reduction in Mitochondrial Reactive Oxygen Species Generation by Polygonum cuspidatum Extract: In Vitro Evidence

Affiliations

Senescence Rejuvenation through Reduction in Mitochondrial Reactive Oxygen Species Generation by Polygonum cuspidatum Extract: In Vitro Evidence

Jee Hee Yoon et al. Antioxidants (Basel). .

Abstract

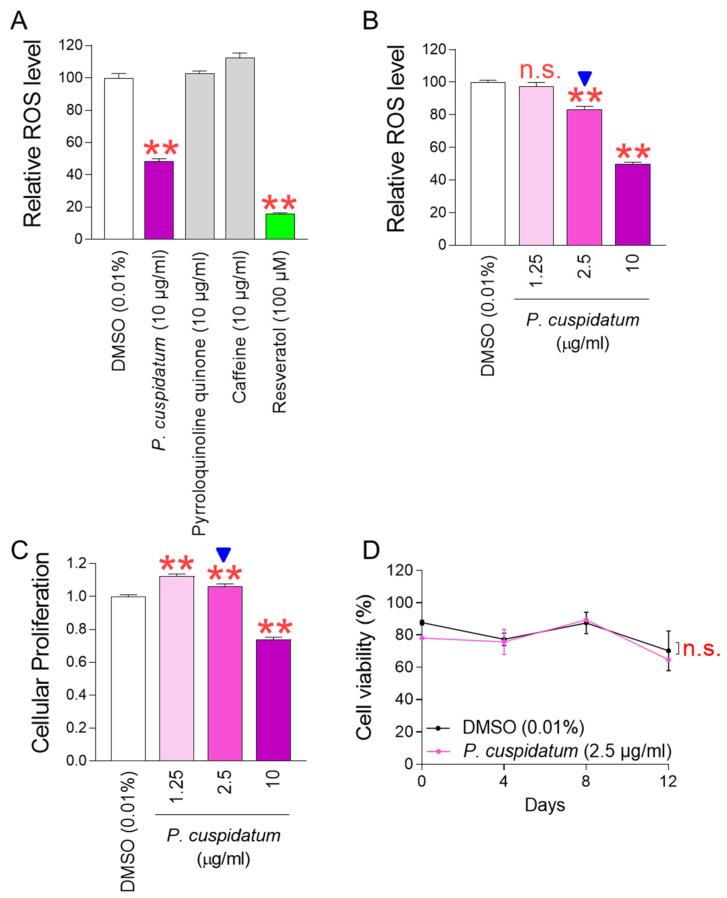
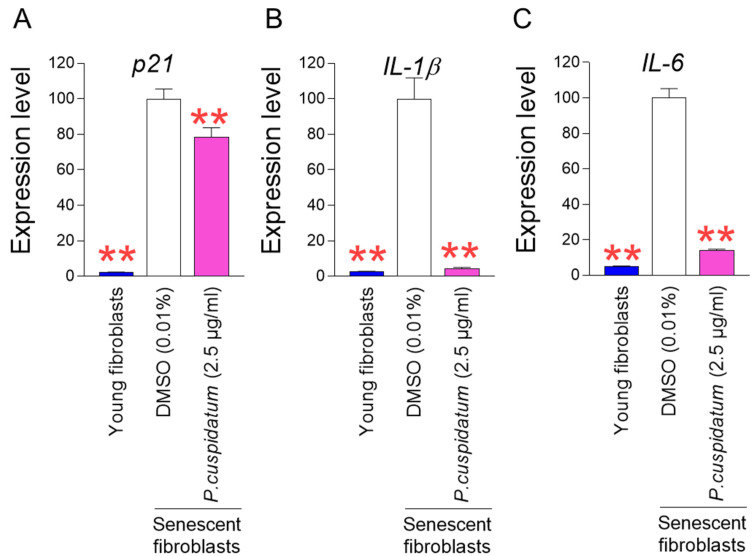
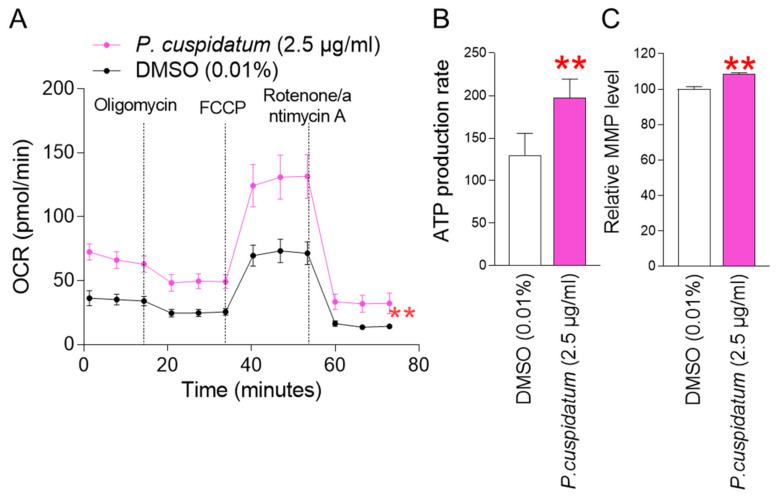
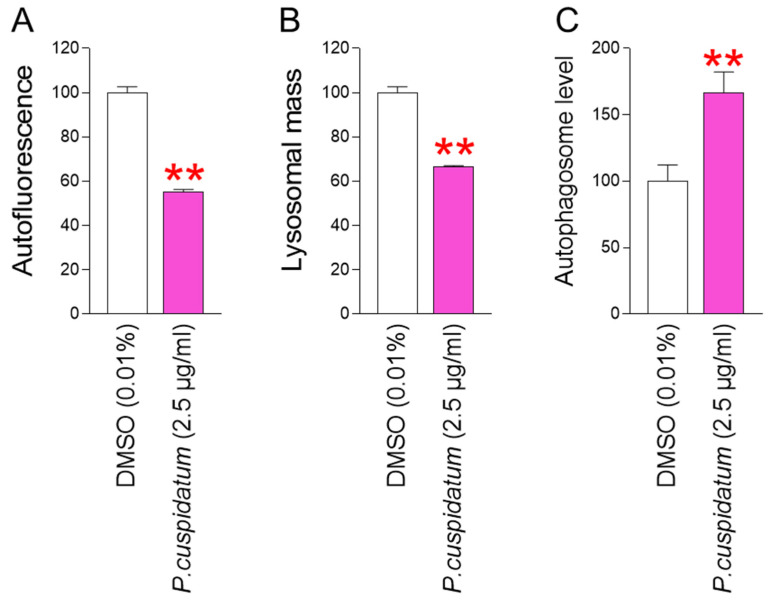
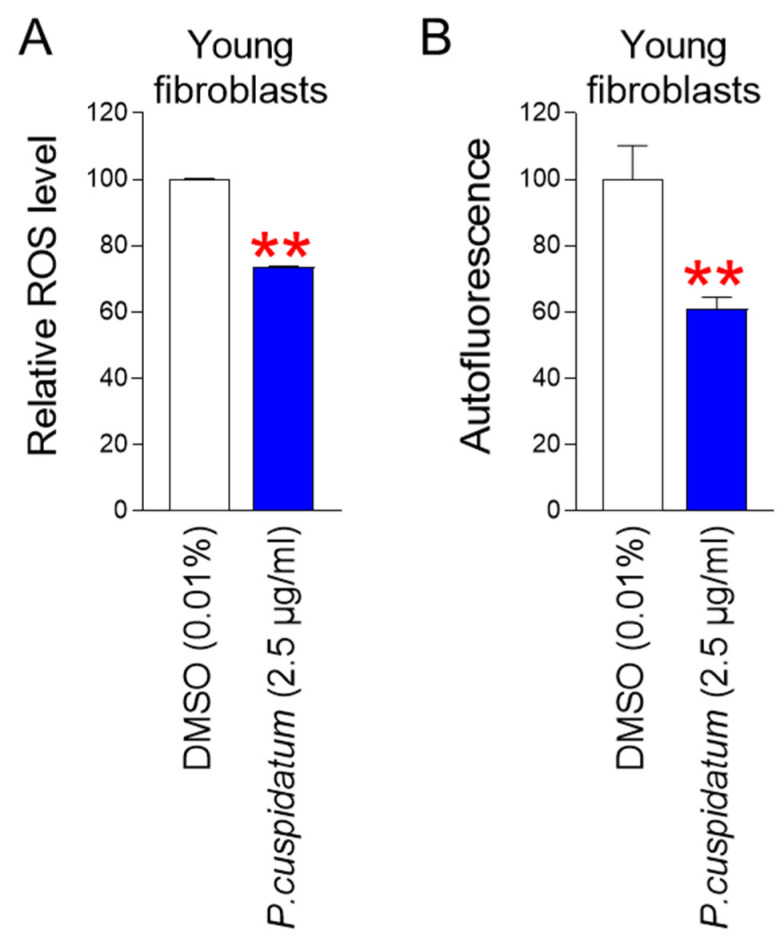
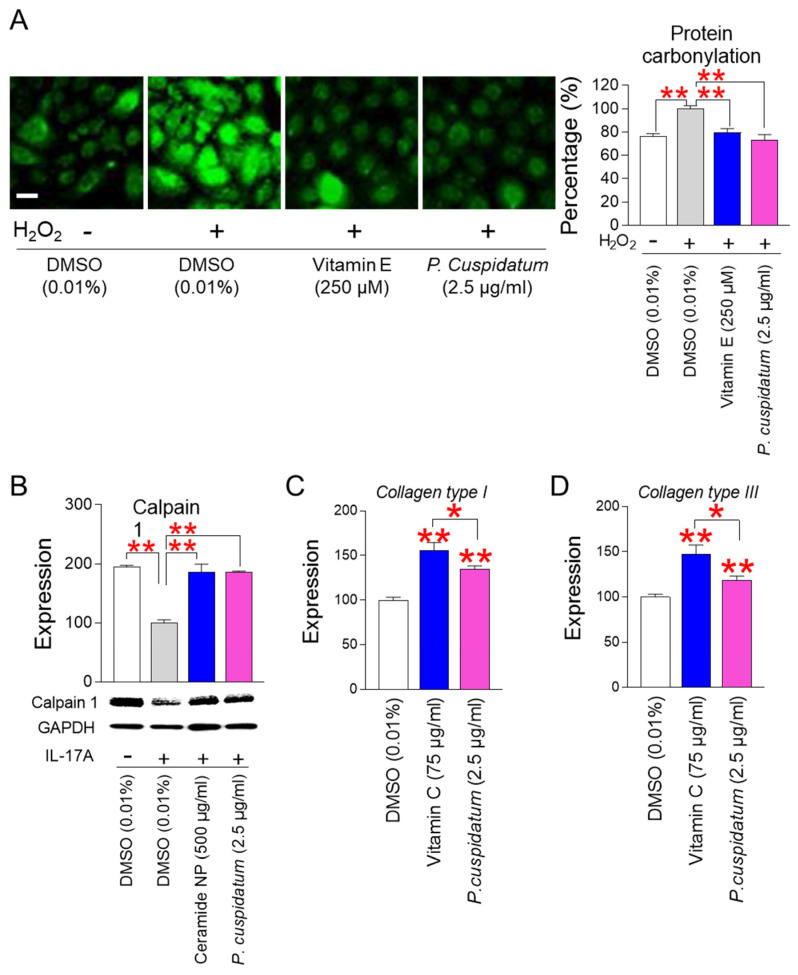
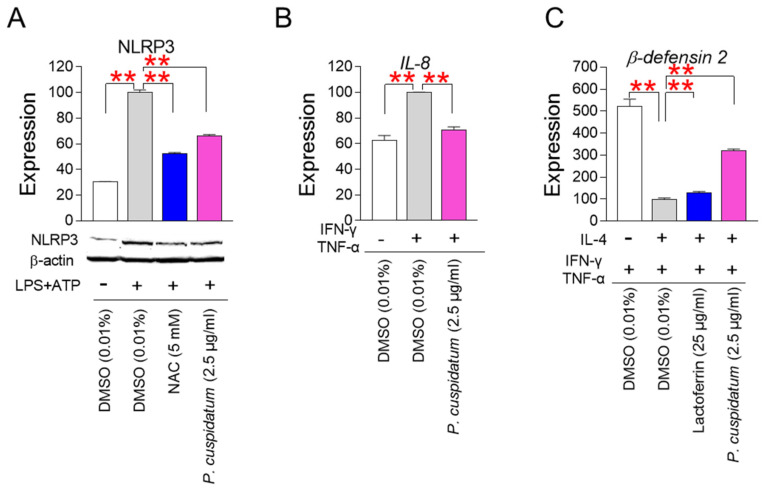
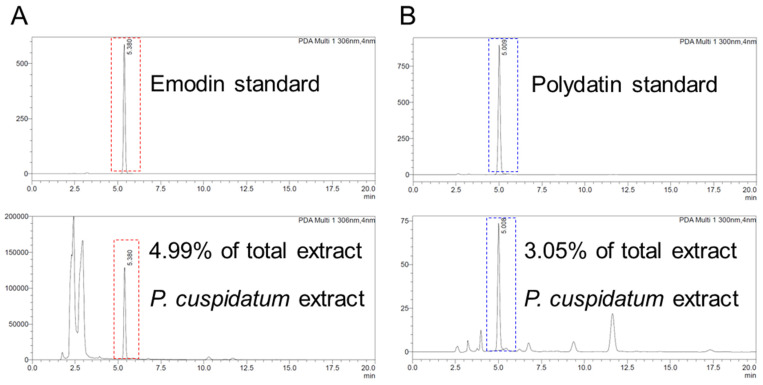
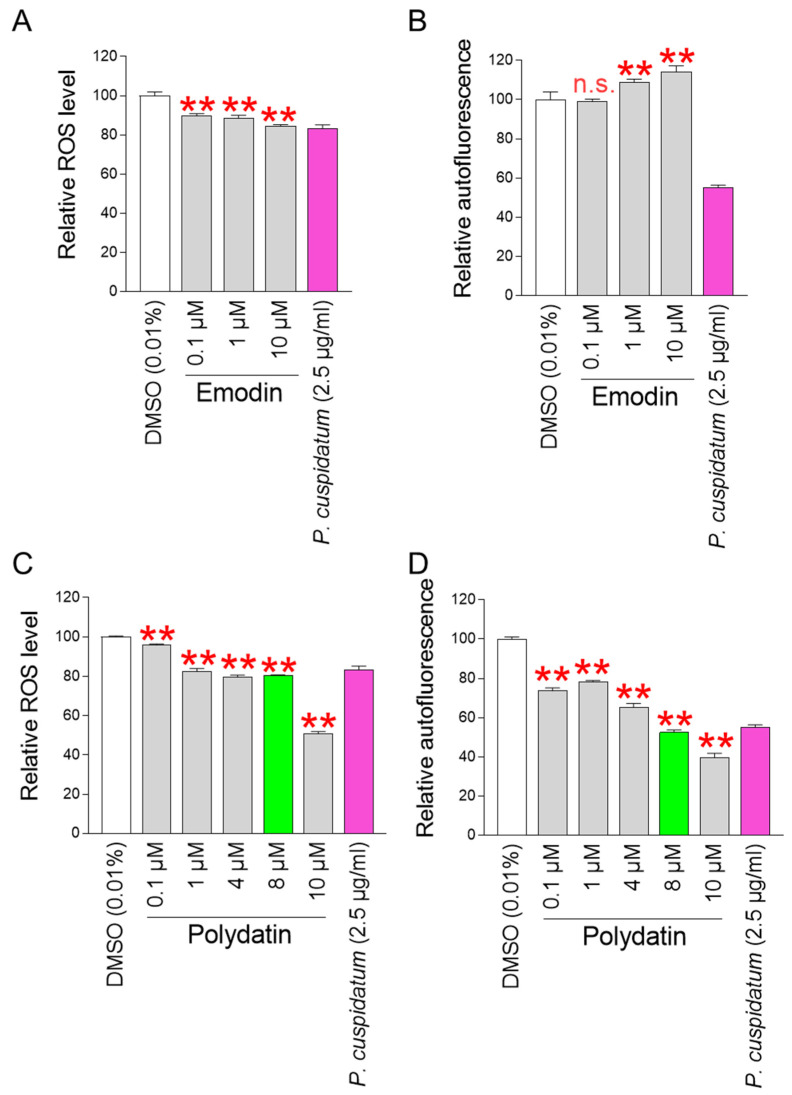
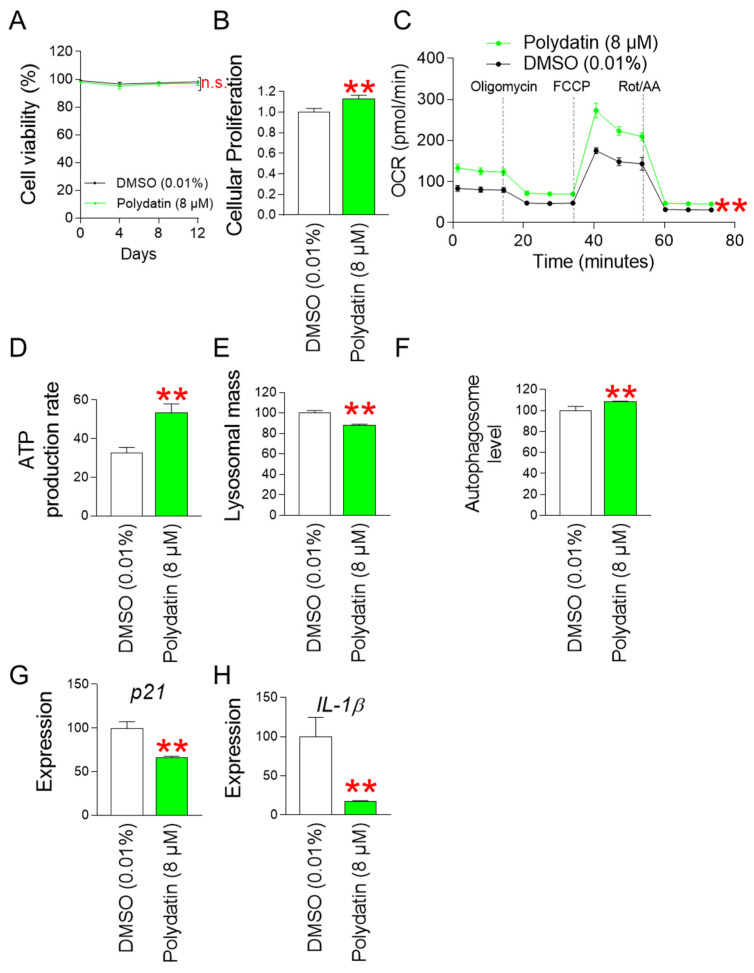
Oxidative stress caused by reactive oxygen species (ROS) is one of the major causes of senescence. Strategies to reduce ROS are known to be important factors in reversing senescence, but effective strategies have not been found. In this study, we screened substances commonly used as cosmetic additives to find substances with antioxidant effects. Polygonum cuspidatum (P. cuspidatum) extract significantly reduced ROS levels in senescent cells. A novel mechanism was discovered in which P. cuspidatum extract reduced ROS, a byproduct of inefficient oxidative phosphorylation (OXPHOS), by increasing OXPHOS efficiency. The reduction in ROS by P. cuspidatum extract restored senescence-associated phenotypes and enhanced skin protection. Then, we identified polydatin as the active ingredient of P. cuspidatum extract that exhibited antioxidant effects. Polydatin, which contains stilbenoid polyphenols that act as singlet oxygen scavengers through redox reactions, increased OXPHOS efficiency and subsequently restored senescence-associated phenotypes. In summary, our data confirmed the effects of P. cuspidatum extract on senescence rejuvenation and skin protection through ROS reduction. This novel finding may be used as a treatment in senescence rejuvenation in clinical and cosmetic fields.

Keywords: Polygonum cuspidatum; oxidative stress; reactive oxygen species (ROS); senescence rejuvenation; skin aging.


Conflict of interest statement

The authors affiliated with Incheon National University (J.H.Y., Y.H.L. and J.T.P.) and Korea University (Y.B.) did not receive any research funding from Hyundai Bioland Co., Ltd. Incheon National University (J.H.Y., Y.H.L. and J.T.P.), Korea University (Y.B.), and Hyundai Bioland Co., Ltd. (E.Y.J., Y.H.K. and S.S.S.) contributed equally to all experiments performed in this study. The authors declare no conflicts of interest. The funders had no role in the collection, analyses, or interpretation of data; in the writing of the manuscript; or in the decision to publish the paper.

Figures

Figure 1
Figure 1
P. cuspidatum extract significantly reduces ROS levels in senescent fibroblasts. (A) Senescent fibroblasts were treated with P. cuspidatum extract (10 μg/mL), pyrroloquinoline quinone (PQQ) (10 μg/mL), and caffeine (10 μg/mL). On day 12, their impact on ROS levels was examined. DMSO control was used by diluting DMSO in the medium to a concentration of 0.01%. Flow cytometric analysis of ROS using DHR123. ** p < 0.01, Student’s t-test. Mean ± S.D., N = 3. Resveratrol (100 μM) was used as a positive control. (B) ROS levels were assessed at different concentrations of P. cuspidatum extract (1.25, 2.5, and 10 µg/mL) on day 12 after treatment in senescent fibroblasts. DMSO control was used by diluting DMSO in the medium to a concentration of 0.01%. n.s. (not significant), ** p < 0.01, Student’s t-test. Mean ± S.D., N = 3. (C) Cellular proliferation was assessed at different concentrations of P. cuspidatum extract (1.25, 2.5, and 10 µg/mL) on day 12 after treatment in senescent fibroblasts. DMSO control was used by diluting DMSO in the medium to a concentration of 0.01%. ** p < 0.01, Student’s t-test. Mean ± S.D., N = 3. The arrow head indicates the optimal concentration of P. cuspidatum extract on decreasing ROS levels and increasing cellular proliferation. (D) Measurement of cell viability after 0, 4, 8, and 12 days of treatment with DMSO (0.01%) or P. cuspidatum extract (2.5 µg/mL) in senescent fibroblasts. n.s. (not significant), two-way ANOVA followed by Bonferroni’s post hoc test. Mean ± S.D., N = 3.
Figure 2
Figure 2
P. cuspidatum extract ameliorate senescence-associated phenotypes in senescent fibroblasts. (A) Expression levels of p21 gene after 12 days of treatment with DMSO (0.01%) or P. cuspidatum extract (2.5 µg/mL) in senescent fibroblasts. ** p < 0.01, Student’s t-test. Mean ± S.D., N = 3. (B) Expression levels of IL-1β gene after 12 days of treatment with DMSO (0.01%) or P. cuspidatum extract (2.5 µg/mL) in senescent fibroblasts. ** p < 0.01, Student’s t-test. Mean ± S.D., N = 3. (C) Expression levels of IL-6 after 12 days of treatment with DMSO (0.01%) or P. cuspidatum extract (2.5 µg/mL) in senescent fibroblasts. ** p < 0.01, Student’s t-test. Mean ± S.D., N = 3.
Figure 3
Figure 3
P. cuspidatum extract reduces mitochondrial ROS generation by increasing OXPHOS efficiency in senescent fibroblasts. (A) Measurement of oxygen consumption rate (OCR; pmole/min) after 12 days of treatment with DMSO (0.01%) or P. cuspidatum extract (2.5 µg/mL). (black line: DMSO-treated senescent fibroblasts, pink line: P. cuspidatum-extract-treated senescent fibroblasts). ** p < 0.01, two-way ANOVA followed by Bonferroni’s post hoc test. Means ± S.D., N = 3. (B) Measurement of ATP production rate after 12 days of treatment with DMSO (0.01%) or P. cuspidatum extract (2.5 µg/mL). ** p < 0.01, student t-test. Mean ± S.D., N = 3. (C) Measurement of mitochondrial membrane potential (MMP) after 12 days of treatment with DMSO (0.01%) or P. cuspidatum extract (2.5 µg/mL). ** p < 0.01, Student’s t-test. Means ± S.D., N = 3.
Figure 4
Figure 4
P. cuspidatum extract yields functional recovery of lysosome/autophagy system in senescent fibroblasts. (A) Autofluorescence was examined using flow cytometry after 12 days of treatment with DMSO (0.01%) or P. cuspidatum extract (2.5 µg/mL) in senescent fibroblasts. ** p < 0.01, Student’s t-test. Mean ± S.D., N = 3. (B) Measurement of lysosomal mass after 12 days of treatment with DMSO (0.01%) or P. cuspidatum extract (2.5 µg/mL) in senescent fibroblasts. ** p < 0.01, Student’s t-test. Mean ± S.D., N = 3. (C) Measurement of autophagosome level after 12 days of treatment with DMSO (0.01%) or P. cuspidatum extract (2.5 µg/mL) in senescent fibroblasts. ** p < 0.01, Student’s t-test. Mean ± S.D., N = 3.
Figure 5
Figure 5
P. cuspidatum extract reduces ROS and lipofuscin levels in young fibroblasts. (A) ROS levels after 12 days of treatment with DMSO (0.01%) or P. cuspidatum extract (2.5 µg/mL) in young fibroblasts. ** p < 0.01, Student’s t-test. Mean ± S.D., N = 3. (B) Autofluorescence was examined using flow cytometry after 12 days of treatment with DMSO (0.01%) or P. cuspidatum extract (2.5 µg/mL) in young fibroblasts. ** p < 0.01, Student’s t-test. Mean ± S.D., N = 3.
Figure 6
Figure 6
P. cuspidatum extract enhances skin protection by restoring skin barrier formation. (A) Measurement of protein carbonylation. Normal human epidermal keratinocytes, HEKn cells, were treated with 500 μM H2O2 for 4 h. Then, HEKn cells were treated with DMSO (0.01%) or P. cuspidatum extract (2.5 µg/mL) for 12 days. As a positive control, vitamin E (250 µM; T1539; Sigma) was used. ** p < 0.01, Student’s t-test. Mean ± S.D., N = 3. Scale bar: 10 μm. Full-size images of immunofluorescence are shown in Supplementary Information S1. (B) Expression levels of calpain 1 protein after activation with IL-17A. To inhibit the expression of calpain 1, HEKn cells were treated with 200 ng/mL IL-17A. Then, HEKn cells were treated with DMSO (0.01%) or P. cuspidatum extract (2.5 µg/mL) for 12 days. As a positive control, ceramide NP (500 μg/mL) was used. ** p < 0.01, Student’s t-test. Mean ± S.D., N = 3. Full-size images of western blot are shown in Supplementary Information S2. (C) Expression levels of collagen type I after 12 days of treatment with DMSO (0.01%) or P. cuspidatum extract (2.5 µg/mL). Senescent fibroblasts were treated with DMSO (0.01%) or P. cuspidatum extract (2.5 µg/mL) for 12 days. As a positive control, vitamin C (75 µg/mL) was used. * p < 0.05, ** p < 0.01, Student’s t-test. Mean ± S.D., N = 3. (D) Expression level of collagen type III after 12 days of treatment with DMSO (0.01%) or P. cuspidatum extract (2.5 µg/mL). Senescent fibroblasts were treated with DMSO (0.01%) or P. cuspidatum extract (2.5 µg/mL) for 12 days. As a positive control, vitamin C (75 µg/mL) was used. * p < 0.05, ** p < 0.01, Student’s t-test. Mean ± S.D., N = 3.
Figure 7
Figure 7
P. cuspidatum extract enhances skin protection by inhibiting skin inflammation. (A) Expression of NLRP3 protein after activation with lipopolysaccharide (LPS)/adenosine triphosphate (ATP). HaCaT cells were treated with 5 μg/mL LPS and then with 5 mM ATP. Then, HaCaT cells were treated with DMSO (0.01%) or P. cuspidatum extract (2.5 µg/mL) for 12 days. As a ROS scavenger, 5 mM N-acetylcysteine (NAC) was treated on HaCaT cells. ** p < 0.01, Student’s t-test. Mean ± S.D., N = 3. Full-size images of western blot are shown in Supplementary Information S2. (B) Expression levels of IL-8 after activation with interferon gamma (IFN-γ)/tumor necrosis factor alpha (TNF-α). HaCaT cells were treated with 10 ng/mL IFN-γ and 20 ng/mL TNF-α. Then, HaCaT cells were treated with DMSO (0.01%) or P. cuspidatum extract (2.5 µg/mL) for 12 days. ** p < 0.01, Student’s t-test. Mean ± S.D., N = 3. (C) Expression levels of β-defensin 2 after activation with IFN-γ/TNF-α followed by IL-4. HaCaT cells were treated with 10 ng/mL IFN-γ and 20 ng/mL TNF-α. Then, HaCaT cells were treated with 50 ng/mL IL-4. HaCaT cells were treated with DMSO (0.01%) or P. cuspidatum extract (2.5 µg/mL) for 12 days. As a positive control, 25 μg/mL lactoferrin was used. ** p < 0.01, Student’s t-test. Mean ± S.D., N = 3.
Figure 8
Figure 8
Identification of emodin and polydatin from P. cuspidatum extracts. High-performance liquid chromatography (HPLC) was performed to determine how much polydatin and emodin were present in P. cuspidatum extract. (A) The HPLC peak of the P. cuspidatum extract matched the emodin standard, and the amount of emodin present in the P. cuspidatum extract was 4.99%. (B) The HPLC peak of the P. cuspidatum extract matched the polydatin standard, and its amount was 3.05% of the total extract.
Figure 9
Figure 9
Identification of polydatin as an active ingredient showing antioxidant effects. (A) ROS-reducing effect of emodin was observed at concentrations of 0.1, 1, and 10 μM. As a positive control, senescent fibroblasts were treated with P. cuspidatum extract (2.5 µg/mL) for 12 days. ** p < 0.01, Student’s t-test. Mean ± S.D., N = 3. (B) The ROS-reducing effect of emodin were not sufficient to reduce the level of autofluorescence. As a positive control, senescent fibroblasts were treated with P. cuspidatum extract (2.5 µg/mL) for 12 days. n.s. (not significant), ** p < 0.01, Student’s t-test. Mean ± S.D., N = 3. (C) Polydatin was effective in reducing ROS levels at concentrations of 0.1, 1, 4, 8, and 10 μM. As a positive control, senescent fibroblasts were treated with P. cuspidatum extract (2.5 µg/mL) for 12 days. ** p < 0.01, Student’s t-test. Mean ± S.D., N = 3. (D) Polydatin was effective in reducing autofluorescence levels at concentrations of 0.1, 1, 4, 8, and 10 μM. As a positive control, senescent fibroblasts were treated with P. cuspidatum extract (2.5 µg/mL) for 12 days. A total of 8 μM polydatin was chosen as the optimal concentration because it is the minimum concentration more effective than P. cuspidatum extract. ** p < 0.01, Student’s t-test. Mean ± S.D., N = 3.
Figure 10
Figure 10
Polydatin reduces mitochondrial ROS generation through increasing OXPHOS efficiency. (A) Measurement of cell viability after 0, 4, 8, and 12 days of treatment with DMSO (0.01%) or polydatin (8 µM). n.s. (not significant), two-way ANOVA followed by Bonferroni’s post hoc test. Mean ± S.D., N = 3. (B) Measurement of cellular proliferation after 12 days of treatment with DMSO (0.01%) or polydatin (8 µM). ** p < 0.01, Student’s t-test. Mean ± S.D., N = 3. (C) Measurement of oxygen consumption rate (OCR; pmole/min) after 12 days of treatment with DMSO (0.01%) or polydatin (8 µM) (black line: DMSO-treated senescent fibroblasts, pink line: polydatin-treated senescent fibroblasts). ** p < 0.01, two-way ANOVA followed by Bonferroni’s post hoc test. Means ± S.D., N = 3. (D) Measurement of ATP production rate after 12 days of treatment with DMSO (0.01%) or polydatin (8 µM). ** p < 0.01, student t-test. Mean ± S.D., N = 3. (E) Measurement of lysosomal mass after 12 days of treatment with DMSO (0.01%) or polydatin (8 µM). ** p < 0.01, Student’s t-test. Mean ± S.D., N = 3. (F) Measurement of autophagosome level after 12 days of treatment with DMSO (0.01%) or polydatin (8 µM). ** p < 0.01, Student’s t-test. Mean ± S.D., N = 3. (G) Expression levels of p21 after 12 days of treatment with DMSO (0.01%) or polydatin (8 µM). ** p < 0.01, Student’s t-test. Mean ± S.D., N = 3. (H) Expression levels of IL-1β after 12 days of treatment with DMSO (0.01%) or polydatin (8 µM). ** p < 0.01, Student’s t-test. Mean ± S.D., N = 3.

Similar articles

References

    1. Boismal F., Serror K., Dobos G., Zuelgaray E., Bensussan A., Michel L. Skin aging: Pathophysiology and innovative therapies. Med. Sci. M/S. 2020;36:1163–1172. doi: 10.1051/medsci/2020232. - DOI - PubMed
    1. Chaudhary M., Khan A., Gupta M. Skin Ageing: Pathophysiology and Current Market Treatment Approaches. Curr. Aging Sci. 2020;13:22–30. doi: 10.2174/1567205016666190809161115. - DOI - PMC - PubMed
    1. Martic I., Papaccio F., Bellei B., Cavinato M. Mitochondrial dynamics and metabolism across skin cells: Implications for skin homeostasis and aging. Front. Physiol. 2023;14:1284410. doi: 10.3389/fphys.2023.1284410. - DOI - PMC - PubMed
    1. Boffoli D., Scacco S.C., Vergari R., Solarino G., Santacroce G., Papa S. Decline with age of the respiratory chain activity in human skeletal muscle. Biochim. Et Biophys. Acta (BBA)—Mol. Basis Dis. 1994;1226:73–82. doi: 10.1016/0925-4439(94)90061-2. - DOI - PubMed
    1. Hwang E., Yoon G., Kang H. A comparative analysis of the cell biology of senescence and aging. Cell. Mol. Life Sci. 2009;66:2503–2524. doi: 10.1007/s00018-009-0034-2. - DOI - PMC - PubMed

LinkOut - more resources