. 2024 Sep 27;10(39):eado1458.
doi: 10.1126/sciadv.ado1458. Epub 2024 Sep 27.

Disruption of the intestinal clock drives dysbiosis and impaired barrier function in colorectal cancer

Affiliations

Disruption of the intestinal clock drives dysbiosis and impaired barrier function in colorectal cancer

Rachel C Fellows et al. Sci Adv. .

Abstract

Diet is a robust entrainment cue that regulates diurnal rhythms of the gut microbiome. We and others have shown that disruption of the circadian clock drives the progression of colorectal cancer (CRC). While certain bacterial species have been suggested to play driver roles in CRC, it is unknown whether the intestinal clock impinges on the microbiome to accelerate CRC pathogenesis. To address this, genetic disruption of the circadian clock, in an Apc-driven mouse model of CRC, was used to define the impact on the gut microbiome. When clock disruption is combined with CRC, metagenomic sequencing identified dysregulation of many bacterial genera including Bacteroides, Helicobacter, and Megasphaera. We identify functional changes to microbial pathways including dysregulated nucleic acid, amino acid, and carbohydrate metabolism, as well as disruption of intestinal barrier function. Our findings suggest that clock disruption impinges on microbiota composition and intestinal permeability that may contribute to CRC pathogenesis.


Figures
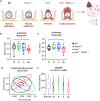
Fig. 1.
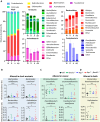
Fig. 1.. Clock disruption and cancer alter microbial structure.
(A) Experimental design of shotgun microbiome sequencing performed on feces from WT, Bmal1−/−, Apc+/−, and Apc+/−;Bmal1−/− mice (n = 9 for WT, n = 8 for Bmal1−/− and Apc+/−, and n = 10 for Apc+/−;Bmal1−/− mice). Comparisons of α-diversity in microbiome sequencing at the genus level using Shannon (B) and Chao (C) indices. Data are expressed as a box plot including the means ± the minimum and maximum values. Statistical significance was determined by the Wilcoxon signed-rank test, and P values from significant multiple comparisons are shown on the graph with * < 0.05. (D) β-Diversity as determined by principle covariant analysis (PCoA) using Bray-Curtis distances. Ellipsoids show the 95% confidence region. (E) Analysis of similarities (ANOSIM) among genotypes expressed as a box plot. Effect size (R) value indicates the degree of difference between groups (0, no difference; 1, greatest difference), and P value indicates the significance. Genotypes are indicated as follows: WT (W), Bmal1−/− (B), Apc+/− (A), and Apc+/−;Bmal1−/− (AB).
Fig. 2.
Fig. 2.. Clock disruption and CRC alter microbiome composition.
(A) Relative abundance of microbial phyla and genera between WT, Bmal1−/−, Apc+/−, and Apc+/−;Bmal1−/− mice (n = 9 for WT, n = 8 for Bmal1−/− and Apc+/−, and n = 10 for Apc+/−;Bmal1−/− mice). Genotypes are indicated as follows: WT (W), Bmal1−/− (B), Apc+/− (A), and Apc+/−;Bmal1−/− (AB). Relative abundance of bacteria altered in fecal samples from clock mutants (B), cancer mutants (C), and in both clock and cancer mutants (D). Error bars represent SEM, significance was determined using MaAsLin2, and P values of pathways with significant q values (q > 0.25) are shown on the graph with * < 0.05, ** < 0.01, and *** < 0.001.
Fig. 3.
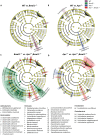
Fig. 3.. Clock disruption and CRC alter microbiome biomarker species.
Linear discriminant analysis effect size (LEfSe) of microbiome sequencing data from all four genotypes (n = 9 for WT, n = 8 for Bmal1−/− and Apc+/−, and n = 10 for Apc+/−;Bmal1−/− mice). Cladograms show comparisons between WT and Bmal1−/− (A), WT and Apc+/− (B), Bmal1−/− and Apc+/−;Bmal1−/− (C), and Apc+/− and Apc+/−;Bmal1−/− (D). Bacterial species corresponding to each letter are shown in the key below, grouped by phylum. Blocks of purple (WT), green (Bmal1−/−), blue (Apc+/−), or red (Apc+/−;Bmal1−/−) in the figure show a significant enrichment in the microbiota of that genotype has been identified at the order, family, genus, or species level. Circles in the same colors reflect where there is a significant difference at the genus or species level. Species are indicated by an alphanumeric key with full species names below the diagrams, grouped by phylum.
Fig. 4.
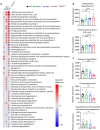
Fig. 4.. Microbial pathway analysis in clock disrupted and tumor-bearing mice.
Microbial functional pathways were profiled with HUMAnN using microbiome sequencing data from all four genotypes (n = 9 for WT, n = 8 for Bmal1−/− and Apc+/−, and n = 10 for Apc+/−;Bmal1−/− mice). (A) Significant changes as determined by MaAsLin2 of microbial pathways altered in Bmal1−/−, Apc+/−, and Apc+/−;Bmal1−/− mice relative to WT. Pathways are colored by effect size adjusted by q value, with signs indicating the direction of change. Relative abundance in all genotypes of the top pathways most increased (B) or decreased (C) in Apc+/−;Bmal1−/− relative to WT. Additional pathways are shown in fig. S4 (A and B). Error bars represent SEM, significance was determined using MaAsLin2, and P values of pathways with significant q values (q > 0.25) are shown on the graph with ** < 0.01, *** < 0.001, and **** < 0.0001.
Fig. 5.
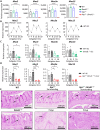
Fig. 5.. Mucin gene expression and mucus levels are reduced in CRC.
(A) Expression of the top four most highly expressed mucin genes as determined by RNA sequencing (RNA-seq) of small intestinal organoids from all four genotypes (n = 3 organoid lines derived from independent mice). (B) Expression of mucin genes in IECs from WT mice relative to zeitgeber time, as determined by quantitative polymerase chain reaction (qPCR; n = 5 independent mice per time point). Average circadian period is shown when the rhythmicity P value was less than 0.01. All values are shown in table S2. (C) Expression of mucin genes in WT and Bmal1−/− IECs collected from n = 3 independent mice at ZT4 and ZT16. (D) Expression of mucin genes in WT IECs and Apc+/−;Bmal1−/− tumors collected from n = 3 independent mice at ZT4 and ZT16. (E) Periodic acid–Schiff (PAS) staining on formalin-fixed paraffin-embedded small intestinal sections from WT, Bmal1−/−, Apc+/−, and Apc+/−;Bmal1−/− mice. Tumor-bearing genotypes are divided into predominantly normal (surrounding) or predominantly tumor containing (polyp) areas. Scale bars, 200 μm. Error bars represent SEM, and statistical significance was determined by DEseq2 for (A) and by one-way analysis of variance (ANOVA) with Tukey’s multiple comparisons for (C) and (D). Asterisks represent false discovery rate (FDR) or P values from multiple comparisons with * < 0.05, ** < 0.01, and **** < 0.0001. Comparisons without labels are not significant.
Fig. 6.
Fig. 6.. Tight junction gene expression is clock dependent and disrupted in CRC.
(A) Expression of five key tight junction genes as determined by RNA-seq of small intestinal organoids from all four genotypes (n = 3 organoid lines derived from independent mice). (B) Expression of tight junction genes in IECs from WT mice relative to zeitgeber time, as determined by qPCR (n = 5 independent mice per time point). Average circadian period is shown when the rhythmicity P value was less than 0.01. All values are shown in table S2. (C) Expression of tight junction genes in WT and Bmal1−/− IECs collected from n = 3 independent mice at ZT4 and ZT16. (D) Expression of tight junction genes in WT IECs and Apc+/−;Bmal1−/− tumors collected from n = 3 independent mice at ZT4 and ZT16. Error bars represent SEM, and statistical significance was determined by DEseq2 for (A) and by one-way ANOVA with Tukey’s multiple comparisons for (C) and (D). Asterisks represent FDR or P values from multiple comparisons with * < 0.05, ** < 0.01, and **** < 0.0001. Comparisons without labels are not significant.
Fig. 7.
Fig. 7.. Cell monolayer permeability is clock dependent, and intestinal barrier function is reduced when clock dysregulation and CRC are combined.
Expression of core clock (A), mucin (B), and tight junction (C) genes in DEX synchronized Caco-2 cells (n = 3 independent experiments). (D) Monolayer permeability of DEX synchronized Caco-2 cells as determined by 4-kDa FITC-dextran transfer in a transwell assay (n = 3 independent experiments). (E) Intestinal permeability from WT, Bmal1, Apc+/−, and Apc+/−;Bmal1−/− mice as determined by gavage of 4-kDa FITC-dextran (600 mg/kg) at ZT23 and serum collection at ZT0 (n = 3 to 8 independent mice). Statistical significance was determined by Student’s unpaired t test for (A) to (D) and by one-way ANOVA with Tukey’s multiple comparisons for (E). Asterisks represent P values from unpaired t-test or multiple comparisons with * < 0.05, ** < 0.01, and *** < 0.001. Comparisons without labels are not significant.

Similar articles

References

    1. Verlande A., Masri S., Circadian clocks and cancer: Timekeeping governs cellular metabolism. Trends Endocrinol. Metab. 30, 445–458 (2019). - PMC - PubMed
    1. Bass J., Lazar M. A., Circadian time signatures of fitness and disease. Science 354, 994–999 (2016). - PubMed
    1. Chaix A., Zarrinpar A., Panda S., The circadian coordination of cell biology. J. Cell Biol. 215, 15–25 (2016). - PMC - PubMed
    1. Cox K. H., Takahashi J. S., Circadian clock genes and the transcriptional architecture of the clock mechanism. J. Mol. Endocrinol. 63, R93–R102 (2019). - PMC - PubMed
    1. Altman B. J., Hsieh A. L., Sengupta A., Krishnanaiah S. Y., Stine Z. E., Walton Z. E., Gouw A. M., Venkataraman A., Li B., Goraksha-Hicks P., Diskin S. J., Bellovin D. I., Simon M. C., Rathmell J. C., Lazar M. A., Maris J. M., Felsher D. W., Hogenesch J. B., Weljie A. M., Dang C. V., MYC disrupts the circadian clock and metabolism in cancer cells. Cell Metab. 22, 1009–1019 (2015). - PMC - PubMed