. 2024 Sep 27;10(39):eadq7006.
doi: 10.1126/sciadv.adq7006. Epub 2024 Sep 27.

Systemic dysregulation and molecular insights into poor influenza vaccine response in the aging population

Affiliations

Systemic dysregulation and molecular insights into poor influenza vaccine response in the aging population

Saumya Kumar et al. Sci Adv. .

Abstract

Vaccination-induced protection against influenza is greatly diminished and increasingly heterogeneous with age. We investigated longitudinally (up to five time points) a cohort of 234 vaccinated >65-year-old vaccinees with adjuvanted vaccine FluAd across two independent seasons. System-level analyses of multiomics datasets measuring six modalities and serological data revealed that poor responders lacked time-dependent changes in response to vaccination as observed in responders, suggestive of systemic dysregulation in poor responders. Multiomics integration revealed key molecules and their likely role in vaccination response. High prevaccination plasma interleukin-15 (IL-15) concentrations negatively associated with antibody production, further supported by experimental validation in mice revealing an IL-15-driven natural killer cell axis explaining the suppressive role in vaccine-induced antibody production as observed in poor responders. We propose a subset of long-chain fatty acids as modulators of persistent inflammation in poor responders. Our findings provide a potential link between low-grade chronic inflammation and poor vaccination response and open avenues for possible pharmacological interventions to enhance vaccine responses.


Figures
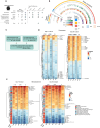
Fig. 1.
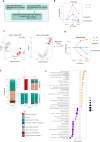
Fig. 1.. Influenza vaccination cohort overview and vaccine response changes in HRs and LRs of each strain.
(A) Overview of the different omics datasets generated in this study. We generated multimodal datasets covering the transcriptome, proteome, and metabolome response to influenza vaccination from up to 234 individuals for different time points spanning both before and after vaccination, covering two independent seasons of influenza vaccination. The serological data are adapted from earlier publications on the same cohort. (B) Circos plot showing the serological response to TIV. Each heatmap depicts antibody fold change (HAI titers) against the three strains included in the vaccine (H3N2, H1N1, and B). Donors were classified as HR for each strain (gray tiles), LRs (lack of gray tiles), TR, NR, or Other on the basis of their serological response (outer-colored tiles). (C) Schematic overview of the analysis. Schematics created using Biorender.com. (D) Heatmap showing longitudinal differential protein abundance (left, day 7 versus day 0; right, day 35 versus day 0) in HRs and LRs of each strain. HRs for H1N1 (N = 102), LRs for H1N1 (N = 98); HRs for H3N2 (N = 173), LRs for H3N2 (N = 27); HRs for B strain (N = 126), LRs for B strain (N = 74). Proteins labeled are significantly differentially abundant in either HRs or both (HRs and LRs) of each strain in each longitudinal comparison and common across all three strains. (E) Heatmap showing longitudinal differential metabolite abundance, same as (D) with superclass annotations per metabolite as annotated by the Human Metabolome Database (HMDB). (*Padj < 0.05, **Padj < 0.01, and ***Padj < 0.001.)
Fig. 2.
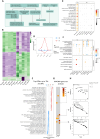
Fig. 2.. Plasma proteins and metabolite changes upon vaccination distinct in TRs and NRs.
(A) Schematic overview of the analysis. Schematic created using Biorender.com. (B) Line plot showing significant changes (Padj < 0.05) in protein abundance in TRs (N = 71) and NRs (N = 10) after vaccination. TRs show a higher percentage of significantly up-regulated proteins, while NRs show a comparably dampened response. (DAPs: Differentially Abundant Proteins). (C) Volcano plot of proteins up-regulated in TRs and NRs 7 days after vaccination with significant proteins colored in red and labeled. Proteins were considered significant at Padj < 0.05. (D) Line plot showing significant changes in metabolite abundance in TRs (N = 71) and NRs (N = 10) after vaccination. DAMs, differentially abundant metabolites. (E) Significantly differentially regulated metabolites categorized on the basis of their class as annotated by the HMDB. The “Measured” column represents the total universe of metabolites that were measured. The TR and NR columns indicate significantly up or down regulated metabolites at each time point compared to day 0. (F) Pathways enriched for metabolites with increased or decreased abundance 7 days after vaccination in TRs. Enrichment of pathways was calculated using IMPALA. Pathways with adjusted P values <0.05 are shown.
Fig. 3.
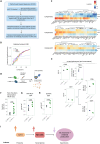
Fig. 3.. Pathway enrichment time and transcriptomics vaccine response differences in highest and lowest responders.
(A) Schematic overview of the analysis. Schematic created using Biorender.com. (B) Heatmap showing mean gene expression across 10 TRs and 10 NRs for each time point. Each row is a gene significantly differentially expressed between TRs and NRs, purple indicating higher gene expression, green indicating lower gene expression (Padj < 0.01). (C) Top 40 BTMs based on GSEA in TRs versus NRs. Positive (red) normalized enrichment scores (NES) correspond to BTMs up-regulated in TRs; negative NES corresponds to BTMs up-regulated in NRs. (D) Line plot summarizing changing gene expression in TRs (red) and NRs (blue) upon vaccination indicated by the percentage of significantly DEGs over time compared to prevaccination. (E) Association of deconvoluted cell proportions with cell cycle BTMs and (F) cell type signature BTMs at 7 days after vaccination. Size of the dots represent adjusted P values from linear mixed models, while color represents the estimate from the model. Associations with Padj < 0.05 plotted for TRs, while all associations for NRs with cell cycle BTMs in gray (not significant) in (E). (G) MAGMA gene-set level scoring of the BTMs listed in (C). The genetic basis of the serological response to vaccination was assessed. MAGMA was used to collapse variant-level P values to suggestive gene-set-level P values (nominal P < 0.1). Shown in colors are the log10(P) values of the suggestive pathways; gray colors represent nonsignificance. (H) Gene rankings based on MAGMA’s gene-level z-score (Materials and Methods) for three selected pathways that show suggestive genetic regulation. Genes were ranked (x axis) on their z-score (y axis) from MAGMA. The color is based on whether the gene is also significantly differentially expressed between TRs and NRs (black) or not (gray) (Padj < 0.05).
Fig. 4.
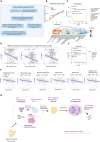
Fig. 4.. Multiomics integration of HRs and LRs.
(A) Schematic overview of multimodal integration analysis. Schematic created using Biorender.com. (B) Barplot showing the proportion of explained variance per factor resulting from unsupervised factor analysis method MOFA. Colors within each bar indicate the contribution of each modality. (C) MOFA factor 3 separates TRs from NRs irrespective of time and across modalities. Y axis represents the factor 3 variance value attributed to each donor. P values are generated using a Wilcoxon rank sum test. (D) Top most positive and negative molecules within the metabolome and proteome modalities as calculated by MOFA. Molecules are ranked on MOFA scaled weights for factor 3. Positive weights are for TRs, whereas negative weights correspond to NRs. (E) Abundance of CCL25 and l-arginine in all 81 TRs and NRs. P values are generated using a Wilcoxon rank sum test. (F) Correlation of arginine with cytokine response after influenza stimulation in 500 FG cohorts. P values are generated using t test. Partial correlation estimate was corrected for age and gender. (G) Integrative network of transcriptome, proteome and metabolome data. Nodes in the network correspond to molecules (proteome and metabolome) or BTMs (transcriptome). Only molecules and pathways identified by MOFA weights (fig. S7E) are plotted. Edges in the network (all adjusted P < 0.05) are statistical associations from linear mixed models (see Materials and Methods), where red edges represent positive associations, and blue edges represent negative associations.
Fig. 5.
Fig. 5.. Prevaccination plasma proteome correlates to the antibody response to vaccination.
(A) Schematic overview of analysis, created using BioRender.com. (B) Proportion of covariation in proteome and antibody fold change explained by each component for either each strain or the predictors examined through PLSR analysis with 10-fold cross validations (N = 200). The first three components using the predictors were able to explain ~40% covariation in the antibody response and prevaccination protein abundance. (C) Heatmap of t test statistics for top predictors with antibody fold change for top three components as calculated using rank product analysis for these components. IL-15 and TNFSF13 in component 1 both show negative association to all three antibody fold changes of all three strains. (D) IL15RA+/+ and IL15RA−/− mice were immunized with OVA-Alum or OVA-IFA in the footpad, followed by analysis of antibody titers, and lymphocyte populations from inguinal lymph nodes (LNs) 11 days after immunization. (E) Proportion of B (CD19+), T (CD3+), NK (NK1.1+) cells, as well as CD4+ and CD8+ T cell subsets, among splenocytes of unimmunized IL15RA+/+ and IL15RA−/− mice. (F) Ratio of TFH/Tfr cells, calculated from their frequency among total CD4+ cells, within LNs of immunized IL15RA+/+ and IL15RA−/− mice. (G) Serum concentration of OVA-specific IgG1 in mice immunized with OVA-alum or (H) immunized with OVA-IFA. Pooled data from two independent experiments; n = 8 to 10. (I) Schematic summarizing the mechanism of IL-15–mediated activation of NK cells leading to suppression of GC responses and low production of antibody fold change. Schematic created using Biorender.com.
Fig. 6.
Fig. 6.. Prevaccination plasma metabolites as modulators for vaccination response.
(A) Schematic overview of the analysis. (B) Proportion of covariation in endogenous metabolites and antibody fold change explained by each component for either each strain or the predictors examined through PLSR analysis with 10-fold cross validations (N = 200). The first eight components were able to explain ~40% covariation in the antibody response and prevaccination metabolite abundance. (C) Plot of metabolites from component 1 with their ranks and estimated percentage of false predictions (PFP) (top). Heatmap of t test statistic for the top predictors with antibody fold change for the top component as calculated using rank product analysis for these components (bottom). Malic acid and citric acid show negative correlation, while betaine shows positive correlation with antibody fold change against all three strains. (D) Association of malic acid to cytokine production upon influenza stimulation in an independent cohort of 500 younger healthy individuals, showing negative correlation. P values are generated using t test. Partial correlation estimate was corrected for age and gender. (E) Top metabolites for component 2 with their ranks and estimated percentage of false predictions show LCFAs as top candidates. (F) Negative correlation of these LCFAs identified in PLSR component 2 with IL-15. P values are generated using t test. Partial correlation estimate was calculated, corrected for age and gender. (G) Schematic describing the role of IL-15 in delayed neutrophil apoptosis, maturation and activation of NK cell populations, leading to suppression of GC responses and reduced antibody production and a chronic inflammatory status. Evidence for each observation is derived through different omics layers and experiments. Connections among different observations were also supported by published findings. Schematics created using Biorender.com.

Similar articles

References

    1. Osterholm M. T., Kelley N. S., Sommer A., Belongia E. A., Efficacy and effectiveness of influenza vaccines: A systematic review and meta-analysis. Lancet Infect. Dis. 12, 36–44 (2012). - PubMed
    1. Ferdinands J. M., Thompson M. G., Blanton L., Spencer S., Grant L., Fry A. M., Does influenza vaccination attenuate the severity of breakthrough infections? A narrative review and recommendations for further research. Vaccine 39, 3678–3695 (2021). - PubMed
    1. Lang P.-O., Mendes A., Socquet J., Assir N., Govind S., Aspinall R., Effectiveness of influenza vaccine in aging and older adults: Comprehensive analysis of the evidence. Clin. Interv. Aging 55, 55–64 (2012). - PMC - PubMed
    1. Jefferson T., Rivetti D., Rivetti A., Rudin M., Di Pietrantonj C., Demicheli V., Efficacy and effectiveness of influenza vaccines in elderly people: A systematic review. Lancet 366, 1165–1174 (2005). - PubMed
    1. Goronzy J. J., Weyand C. M., Understanding immunosenescence to improve responses to vaccines. Nat. Immunol. 14, 428–436 (2013). - PMC - PubMed