Combinatory Effects of Acrylamide and Deoxynivalenol on In Vitro Cell Viability and Cytochrome P450 Enzymes of Human HepaRG Cells
- PMID: 39330847
- PMCID: PMC11436166
- DOI: 10.3390/toxins16090389
Combinatory Effects of Acrylamide and Deoxynivalenol on In Vitro Cell Viability and Cytochrome P450 Enzymes of Human HepaRG Cells
Abstract
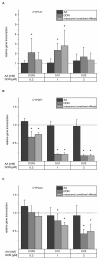
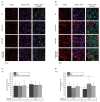
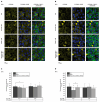
Acrylamide (AA) can be formed during the thermal processing of carbohydrate-rich foods. Deoxynivalenol (DON), a mycotoxin produced by Fusarium spp., contaminates many cereal-based products. In addition to potential co-exposure through a mixed diet, co-occurrence of AA and DON in thermally processed cereal-based products is also likely, posing the question of combinatory toxicological effects. In the present study, the effects of AA (0.001-3 mM) and DON (0.1-30 µM) on the cytotoxicity, gene transcription, and expression of major cytochrome P450 (CYP) enzymes were investigated in differentiated human hepatic HepaRG cells. In the chosen ratios of AA-DON (10:1; 100:1), cytotoxicity was clearly driven by DON and no overadditive effects were observed. Using quantitative real-time PCR, about twofold enhanced transcript levels of CYP1A1 were observed at low DON concentrations (0.3 and 1 µM), reflected by an increase in CYP1A activity in the EROD assay. In contrast, CYP2E1 and CYP3A4 gene transcription decreased in a concentration-dependent manner after incubation with DON (0.01-0.3 µM). Nevertheless, confocal microscopy showed comparably constant protein levels. The present study provided no indication of an induction of CYP2E1 as a critical step in AA bioactivation by co-occurrence with DON. Taken together, the combination of AA and DON showed no clear physiologically relevant interaction in HepaRG cells.
Keywords: acrylamide; deoxynivalenol; food processing; hepatocytes; metabolism; mixtures; process contaminants.
Conflict of interest statement
The authors declare no conflicts of interest. The funders had no role in the design of the study; in the collection, analyses, or interpretation of data; in the writing of the manuscript; or in the decision to publish the results.
Figures


Similar articles
-
Combinatory effects of cereulide and deoxynivalenol on in vitro cell viability and inflammation of human Caco-2 cells.Arch Toxicol. 2020 Mar;94(3):833-844. doi: 10.1007/s00204-020-02658-w. Epub 2020 Feb 17. Arch Toxicol. 2020. PMID: 32065293
-
DNA strand breaking capacity of acrylamide and glycidamide in mammalian cells.Mutat Res. 2005 Feb 7;580(1-2):71-80. doi: 10.1016/j.mrgentox.2004.11.009. Mutat Res. 2005. PMID: 15668109
-
Differential impacts of individual and combined exposures of deoxynivalenol and zearalenone on the HepaRG human hepatic cell proteome.J Proteomics. 2018 Feb 20;173:89-98. doi: 10.1016/j.jprot.2017.11.025. Epub 2017 Dec 5. J Proteomics. 2018. PMID: 29208510
-
Deoxynivalenol: mechanisms of action, human exposure, and toxicological relevance.Arch Toxicol. 2010 Sep;84(9):663-79. doi: 10.1007/s00204-010-0579-8. Epub 2010 Aug 27. Arch Toxicol. 2010. PMID: 20798930 Review.
-
Decontamination and detoxification strategies for the Fusarium mycotoxin deoxynivalenol in animal feed and the effectiveness of microbial biodegradation.Food Addit Contam Part A Chem Anal Control Expo Risk Assess. 2010 Apr;27(4):510-20. doi: 10.1080/19440040903571747. Food Addit Contam Part A Chem Anal Control Expo Risk Assess. 2010. PMID: 20234966 Review.
References
-
- Heys K.A., Shore R.F., Pereira M.G., Jones K.C., Martin F.L. Risk assessment of environmental mixture effects. RSC Adv. 2016;6:47844–47857. doi: 10.1039/C6RA05406D. - DOI
-
- WHO|JECFA Safety Evaluation of Certain Contaminants in Food—Acrylamide. WHO Food Additives Series 63, FAO JECFA Monographs 8. [(accessed on 17 July 2024)]. Available online: https://apps.who.int/food-additives-contaminants-jecfa-database/Home/Che....
-
- Scientific Opinion on acrylamide in food. EFSA J. 2015;13:4104. doi: 10.2903/j.efsa.2015.4104. - DOI
MeSH terms
Substances
Grants and funding
LinkOut - more resources
Full Text Sources
Miscellaneous

