. 2024 Sep 14;13(18):1546.
doi: 10.3390/cells13181546.

Targeting the p90RSK/MDM2/p53 Pathway Is Effective in Blocking Tumors with Oncogenic Up-Regulation of the MAPK Pathway Such as Melanoma and Lung Cancer

Affiliations

Targeting the p90RSK/MDM2/p53 Pathway Is Effective in Blocking Tumors with Oncogenic Up-Regulation of the MAPK Pathway Such as Melanoma and Lung Cancer

Immacolata Maietta et al. Cells. .

Abstract

In most human tumors, the MAPK pathway is constitutively activated. Since p90RSK is downstream of MAPK, it is often hyperactive and capable of phosphorylating oncogenic substrates. We have previously shown that p90RSK phosphorylates MDM2 at S166, promoting p53 degradation in follicular thyroid carcinomas. Thus, the inhibition of p90RSK restores p53 expression, which in turn inhibits cell proliferation and promotes apoptosis. In the present study, we demonstrated that the p90RSK/MDM2/p53 pathway proved to be an excellent target in the therapy of tumors with MAPK hyperactivation. For this purpose, we selected p53wt melanoma, lung and medullary thyroid carcinoma cell lines with high activation of p90RSK. In these cell lines, we demonstrated that the p90RSK/MDM2/p53 pathway is implicated in the regulation of the cell cycle and apoptosis through p53-dependent transcriptional control of p21 and Bcl-2. Furthermore, with an immunohistochemical evaluation of primary melanomas and lung tumors, which exhibit highly activated p90RSK compared to corresponding normal tissue, we demonstrated that MDM2 stabilization was associated with p90RSK phosphorylation. The results indicate that p90RSK is able to control the proliferative rate and induction of apoptosis through the regulation of p53wt levels by stabilizing MDM2 in selected tumors with constitutively activated MAPKs, making p90RSK a new attractive target for anticancer therapy.

Keywords: MDM2; apoptosis; cancer; cancer drug resistance; cell proliferation; p53; p90RSK; targeted therapy; tumorigenesis.


Conflict of interest statement

The authors declare no conflicts of interest. The funders had no role in the design of the study; in the collection, analyses or interpretation of data; in the writing of the manuscript; or in the decision to publish the results.

Figures
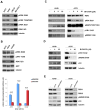
Figure 1
Figure 1
p90RSK induces p53 degradation by phosphorylating MDM2 at S166. (A) Several human tumor cell lines (A375, A549, LNCaP, MZ-CRC-1) were analyzed for the phosphorylation of p90RSK at different sites (pRSK S380, T359/S363, S221) and for the total level of p90RSK (RSK1/2/3). Tubulin was used to normalize. (B) The A375 the A549 cell lines, melanoma and lung cancer, respectively, were compared to the LNCaP prostate cancer cell line for the phosphorylation levels of p90RSK at S380 (pRSK S380) relative to total proteins (RSK1/2/3) and for the phosphorylation levels of AKT on T308 relative to total proteins (AKT). Tubulin was used for normalization (upper panel). The bar diagram below shows the ratio between the phosphorylated form and the total protein (pRSK/RSK and pAKT/AKT) obtained by quantifying each sample with the ImageJ program. Standard deviations were derived from three different quantifications (bottom panel). (C) A549 and A375 were incubated with the indicated doses of BI-D1870 for 1 h. The BI-D1870 inhibition efficacy was confirmed by the anti-phospho-S102 YB1 and anti-phospho-S221 RSK antibodies. Phosphorylated ERK1/2 antibody (pMAPK T202/Y204) was used to check the specificity of the inhibition. Phosphorylated MDM2 was visualized with anti-phospho-S166 MDM2 (pMDM2 S166) antibody. Anti-RSK1 antibody (RSK1) was used to normalize the immunoblot. (D) A549 and A375 cells were incubated with the indicated concentration of BI-D1870 inhibitor. The BI-D1870 effect was monitored by using the anti-phospho-S102 YB1 (pYB1 S102) antibody. Phosphorylated MDM2 was highlighted with anti-phospho-S166 MDM2 (pMDM2 S166) antibody. The p53 protein amount was determined using anti-p53 (p53) antibody. Anti-tubulin antibody was used to normalize the immunoblot. (E) A549 and A375 cells were transfected with a pool of specific RSK1/RSK2 siRNAs for interference against RSK1 and RSK2 or with control siCTR. To evaluate the efficiency of interference, we used anti-RSK1 and anti-RSK2 antibodies. The level of MDM2 phosphorylation was visualized with anti-phospho-S166 MDM2 antibody. The p53 level was determined by the use of anti-p53 antibody. Anti-MDM antibody was used for normalization. All experiments presented were repeated three times with consistent results. Furthermore, to also measure the relative contribution of AKT to MDM2 phosphorylation at S166, as described in literature [33], we analyzed the T308 phosphorylation of AKT in the A549 and A375 cells compared to that in the LNCaP cells (Figure 1B). It is immediately evident that in cells in which p90RSK is highly activated (A549 and A375 cell lines), AKT appears less phosphorylated than in the LNCaP cell line, which presents very active AKT, as expected due to PTEN mutation, but does not present strong phosphorylation of p90RSK.
Figure 2
Figure 2
In tumor cell lines with strongly active p90RSK, MDM2-mediated p53 degradation is controlled by p90RSK. (A) A549, A375 and LNCaP cells were incubated with 10 μM BI-D1870 for the indicated times. The efficiency of the inhibition was confirmed by anti-phospho-S102 YB1 antibody. The immunoblot was checked by anti-p53, anti-MDM2 and anti-phospho-S166 antibodies, and anti-tubulin antibody was used for normalization. (B) A549, A375 and LNCaP cells were seeded in culture medium with 2 μM wortmannin for the indicated times. The efficiency of wortmannin was confirmed by using anti-phospho-T308 AKT antibody. The immunoblot was checked using anti-p53, anti-MDM2 and anti-phospho-S166 MDM2 antibodies, and normalization was carried out by immunoblotting with anti-tubulin antibody. (C) A549, A375 and LNCaP cells were seeded in culture medium with BI-D1870 to a 4 µM final concentration for the indicated times (h). The efficiency of the BI-D1870 was confirmed with anti-phospho-S102 YB1 antibody. The immunoblot was checked using anti-p53, anti-MDM2 and anti-phospho-S166 MDM2 antibodies and then normalized using tubulin. All presented experiments were repeated three times with consistent results.
Figure 3
Figure 3
p90RSK is able to regulate rate of proliferation in A375 and A549 cell lines. (A) Growth curves of A375 and A549 cells seeded in culture medium with variable concentrations of BI-D1870. The experiments were repeated three times. The curves show the averages of three different measurements ± standard deviation. (B) A375, A549 and LNCaP cells, treated or not with 4 µM BI-D1870 or with 2 µM wortmannin for 72 h, were photographed in the optical field at 10× magnification. A representative area is shown. (C) Growth curves of A549 and A375 cells transfected with a combination of different RSK1/RSK2 specific siRNA or with non-targeting siRNA (siCTR). The efficiency of transfection was measured with anti-RSK1 and anti-RSK2 antibodies. Normalization was performed with an antibody against tubulin. The experiments were conducted three different times. The histograms show the average value of the obtained results at 0 and 48 h and the standard deviation.
Figure 4
Figure 4
p90RSK is capable of controlling DNA synthesis and apoptosis by regulating p53 levels. (A) A549 and A375 cells were incubated with 4 μM BI-D1870 for the indicated times (h). The immunoblot was checked using anti-p21, anti-Bcl2, anti-Bax and anti-p53 antibodies; the anti-tubulin antibody was used for normalization. (B) BrdU assay in A549 and A375 cells incubated or not with 4 μM BI-D1870 for 72 h. We used Hoechst solution to stain the nuclei blue, and anti-BrdU antibody was used to highlight apoptotic cells (green stain). In each sample, we counted at least 500 cells. The percentage of BrdU-positive cells was obtained from the ratio of BrdU-labeled nuclei to total nuclei. The histogram shows the average of the counts performed in different fields of BrdU-stained cells (more than 100 cells were counted in each field). The experiment was conducted in triplicate. The standard deviation of the acquired measurements was determined (left panel). The images in the figure represent photographs obtained with a fluorescence microscope at 10× magnification. A representative area for each sample is shown in the figure (right panel). (C) TUNEL assay in A549 and A375 cells treated or not with 4 μM BI-D1870 for 72 h. Hoechst solution was used to stain the nuclei blue, and apoptotic cells were stained using the TUNEL assay (red staining). The percentage of apoptotic cells was evaluated from the ratio of red-stained nuclei to blue-stained nuclei. The histogram shows the average of number of apoptotic cells counted in several fields (more than 500 cells were counted in total) and the standard deviation of the values obtained (left panel) in three different experiments. The images in the figure represent photographs obtained with a fluorescence microscope at 10× magnification. One representative field for is sample is displayed (right panel).
Figure 5
Figure 5
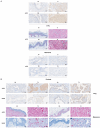
MDM2 stabilization is associated with p90RSK activation in primary melanomas and primary lung tumors. (A) Formalin-fixed, paraffin-embedded normal (N) and tumor (T) tissue samples were stained using an immunohistochemical technique for RSK phosphorylation. To this end, normal (N) or tumor (T) tissue samples were incubated with anti-pRSK antibodies. A diffuse cytoplasmic/nuclear positivity for pRSK characterized the T samples; in contrast, N samples present a reduction in the percentage of positive cells or only a weak positivity. For each tumor type (lung, melanoma and prostate), we show two representative images of different samples related to the samples (both T and N) shown in Supplementary Tables S1 and S2. 40× magnification. (B) Formalin-fixed, paraffin-embedded normal (N) and tumor (T) tissue samples were stained using an immunohistochemical technique for MDM2 and pRSK. Each tissue sample (both T and N) was stained with anti-MDM2 and anti-pRSK antibodies. Diffuse cytoplasmic/nuclear evident detection for pRSK is evident in tumor samples (T), while samples from normal lung and skin tissues (N) were less positive. Diffuse nuclear positivity to MDM2 staining, indicating its nuclear accumulation, characterizes the T samples, while the corresponding N samples are negative. Representative images of the samples indicated in Supplementary Tables S1 and S2 are shown. 40× magnification.
Figure 6
Figure 6
Final model: the inhibition of p90RSK induces the suppression of proliferation and survival. In tumor cells characterized by constitutive oncogenic activation of the ERK pathway, p90RSK inhibition destabilizes MDM2, inducing its proteasome degradation. The MDM2 reduction leads to an increase in p53 that, in turn, induces p21 transcription and reduces Bcl-2 transcription. The PI3K/AKT pathway is able to contribute to this mechanism in tumor cells where it is overactive.

Similar articles

References

    1. Yoon S., Seger R. The Extracellular Signal-Regulated Kinase: Multiple Substrates Regulate Diverse Cellular Functions. Growth Factors. 2006;24:21–44. doi: 10.1080/02699050500284218. - DOI - PubMed
    1. Hoshino R., Chatani Y., Yamori T., Tsuruo T., Oka H., Yoshida O., Shimada Y., Ari-I S., Wada H., Fujimoto J., et al. Constitutive Activation of the 41-/43-KDa Mitogen-Activated Protein Kinase Signaling Pathway in Human Tumors. Oncogene. 1999;18:813–822. doi: 10.1038/sj.onc.1202367. - DOI - PubMed
    1. Jun S., Lee S., Kim H.C., Ng C., Schneider A.M., Ji H., Ying H., Wang H., DePinho R.A., Park J. Il PAF-PAF-Mediated MAPK Signaling Hyperactivation via LAMTOR3 Induces Pancreatic Tumorigenesis. Cell Rep. 2013;5:314–322. doi: 10.1016/j.celrep.2013.09.026. - DOI - PMC - PubMed
    1. Drosten M., Sum E.Y.M., Lechuga C.G., Simón-Carrasco L., Jacob H.K.C., García-Medina R., Huang S., Beijersbergen R.L., Bernards R., Barbacid M. Loss of P53 Induces Cell Proliferation via Ras-Independent Activation of the Raf/Mek/Erk Signaling Pathway. Proc. Natl. Acad. Sci. USA. 2014;111:15155–15160. doi: 10.1073/pnas.1417549111. - DOI - PMC - PubMed
    1. Xu S., Khoo S., Dang A., Witt S., Do V., Zhen E., Schaefer E.M., Cobb M.H. Differential Regulation of Mitogen-Activated Protein/ERK Kinase (MEK)1 and MEK2 and Activation by a Ras-Independent Mechanism. Mol. Endocrinol. 1997;11:1618–1625. doi: 10.1210/mend.11.11.0010. - DOI - PubMed

Publication types

MeSH terms

Substances