. 2024 Sep 13;13(18):1533.
doi: 10.3390/cells13181533.

Lactate-Induced HBEGF Shedding and EGFR Activation: Paving the Way to a New Anticancer Therapeutic Opportunity

Affiliations

Lactate-Induced HBEGF Shedding and EGFR Activation: Paving the Way to a New Anticancer Therapeutic Opportunity

Valentina Rossi et al. Cells. .

Abstract

Cancer cells can release EGF-like peptides, acquiring the capacity of autocrine stimulation via EGFR-mediated signaling. One of these peptides (HBEGF) was found to be released from a membrane-bound precursor protein and is critically implicated in the proliferative potential of cancer cells. We observed that the increased lactate levels characterizing neoplastic tissues can induce the release of uPA, a protease promoting HBEGF shedding. This effect led to EGFR activation and increased ERK1/2 phosphorylation. Since EGFR-mediated signaling potentiates glycolytic metabolism, this phenomenon can induce a self-sustaining deleterious loop, favoring tumor growth. A well characterized HBEGF inhibitor is CRM197, a single-site variant of diphtheria toxin. We observed that, when administered individually, CRM197 did not trigger evident antineoplastic effects. However, its association with a uPA inhibitor caused dampening of EGFR-mediated signaling and apoptosis induction. Overall, our study highlights that the increased glycolytic metabolism and lactate production can foster the activated state of EGFR receptor and suggests that the inhibition of EGFR-mediated signaling can be attempted by means of CRM197 administered with an appropriate protease inhibitor. This attempt could help in overcoming the problem of the acquired resistance to the conventionally used EGFR inhibitors.

Keywords: EGFR; HBEGF; cancer cell metabolism; lactate.


Conflict of interest statement

The authors declare no conflicts of interest.

Figures

Figure 1
Figure 1
mRNA levels of EGFR and of proteins involved in its activation, assessed by RT–PCR. (A) A preliminary evaluation was carried out to verify whether the different DMEM formulations could affect the proliferation dynamics of cell cultures. *, a statistically significant difference with p < 0.05 was found in cultures maintained in High-Glc DMEM vs those maintained in the Low-Glc medium (ANOVA followed by Tukey’s post-test). (B) mRNA levels in MDA-MB-231 cells grown in Low-Glc DMEM were compared to those detected in High-Glc DMEM maintained cells and in cells exposed to Low-Glc DMEM + lactate. For genes’ selection, a threshold at ≥50% increase was set (dotted line). Furthermore, only genes showing no statistically significant difference between High-Glc DMEM grown cells and those exposed to Low-Glc DMEM + lactate were considered. These criteria were met by uPA, ERR-alpha, and GPER1 (@). The selected genes (@) were also studied in HT-29 cells, cultured in Low-Glc DMEM and exposed to lactate (C), together with MMP9 and MMP2 (two proteases involved in HBEGF shedding). In these cells, RT–PCR analysis substantially confirmed the data obtained in MDA-MB-231 cultures. The statistical evaluations applied to the data shown in (B,C) are detailed in the text. (D) Comparison of HBEGF mRNA levels between the two cell cultures.
Figure 2
Figure 2
The results of RT–PCR experiments (Figure 1) were validated by the immunoblotting detection of proteins. (A) Images of the protein bands and of the used internal standard (Actin). (B) The densitometric reading of bands, normalized on Actin levels, was used to calculate the % increase of protein levels in lactate-exposed cells vs. control cultures, maintained in Low-Glc DMEM. Because of their limited extent, the increases of ERR-alpha (in both cell lines) and GPER1 (in HT-29 cultures) were not further considered. The results concerning uPA (in both cell cultures) and GPER1 (only in MDA-MB-231 cells) were analyzed by one-sample t-tests; * and ** indicate a statistically significant increase compared to the control cultures, with p < 0.05 and 0.01, respectively.
Figure 3
Figure 3
(A) Effects caused by BC11 (a uPA inhibitor) on the proliferation of control (grown in Low-Glc DMEM) and lactate-exposed MDA-MB-231 and HT-29 cells, at 24 h. Lactate was found to drastically reduce the toxic effects of BC11 in MDA-MB-231 culture. No significant difference was observed between the two lactate-exposed cultures at all the tested doses of BC11. (B) Detection of released HBEGF (24 h) in control (Low-Glc DMEM) cultures and in cells exposed to lactate or lactate + BC11 (100 µM). In MDA-MB-231 cultures, lactate significantly increased HBEGF shedding (*, p < 0.05, assessed by ANOVA followed by Dunnett’s post-test). In control HT-29 cells, released HBEGF was undetectable (ND), but reached the limit of detectability in lactate-exposed cells. In both lactate-exposed cultures, BC11 supplementation reduced the level of released HBEGF and no statistically significant difference was observed between control cells and cells exposed to lactate/BC11.
Figure 4
Figure 4
(A) Immunoblotting detection of EGFR and ERK1/2 phosphorylation. The signal intensity ratios (phospho-protein/protein) were calculated and the obtained values were used to assess the % increase in phospho-EGFR and phospho-ERK1/2 observed in lactate-exposed cells (B). For both phospho-EGFR/EGFR and phospho-ERK1/2/ERK1/2 immunoblotting analyses, the same sample was used and was run in parallel experiments; gels and blots were processed in parallel. The data shown in (B) were statistically evaluated by one-sample t-tests. In both cell cultures the increased phosphorylation of EGFR reached the level of statistical significance; on the contrary, phospho-ERK1/2 was significantly increased only in MDA-MB-231 cells. **, p < 0.01.
Figure 5
Figure 5
Effect of cisplatin (CPL) in control and lactate-exposed cultures. (A) In MDA-MB-231 cells grown in Low-Glc DMEM, the antiproliferative effect of 50 µM CPL was increased by CRM197, given at 32 nM (* p < 0.05, as assessed by t-test). This effect was not observed in lactate-exposed cells. (B) Lactate-exposed cells were exposed to CPL to evaluate the effect of CRM197 and BC11 on the drug response. Data were analyzed by ANOVA, followed by Tukey’s post-test. @: a statistically significant difference was observed between cell samples treated with BC11 and those exposed to BC11+CRM197 (p < 0.05). *: BC11 significantly increased the effect of CPL (p < 0.001). (C) In HT-29 cells grown in Low-Glc DMEM, the antiproliferative effect of 50 µM CPL was not modified by CRM197. Lactate-exposed cells showed a reduced response to CPL and, again, this effect was not modified by CRM197. (D) The experiments shown in (B) were replicated in HT-29 cultures. #: no statistically significant difference was observed between cell samples treated with BC11 and those exposed to BC11 + CRM197. §: the increased antiproliferative effect observed in cell samples exposed to CPL/CRM197/BC11 did not reach the level of statistical significance, when compared to the single CPL treatment. In these experiments, no difference in the proliferation rate was observed between cells maintained in Low Glc DMEM and those cultured in Low Glc DMEM + lactate.
Figure 6
Figure 6
(A) Glycolysis inhibition, assessed by quantifying the released lactate. Data were analyzed by ANOVA followed by Dunnett’s post-test; a statistically significant reduction of lactate release was observed in cell samples exposed to the combined CRM197/BC11 treatment, with p < 0.01. (B) According to the method described in [51], the antiproliferative effect caused by CRM197/BC11 suggests synergism by the two compounds. (C) Immunoblotting evaluation of EGFR-mediated signaling shutdown and of apoptosis induction (PUMA). Phospho-EGFR band intensities were normalized on the corresponding EGFR signal; for this immunoblotting analysis the same sample was used and was run in parallel experiments; gels and blots were processed in parallel. PUMA band intensities were normalized on the corresponding Actin level. The bar graph shows the effects caused by the two compounds, given individually or in association. Data were analyzed by one-sample t-tests. The combination CRM197/BC11 significantly reduced phospho-EGFR, which became barely detectable, and markedly increased the level of PUMA. * and ** indicate a statistically significant difference compared to the control cultures, with p < 0.05 and 0.01, respectively.
Figure 7
Figure 7
(A) Representative pictures of MDA-MB-231 cultures. The limits of the wound area have been outlined in red; repopulation was evaluated with the aid of the ImageJ software, as described in Section 2.7, and the percentage of healed wound over time is reported in (B). Data were analyzed by ANOVA followed by Tukey’s post-test. *: a statistically significant difference was observed between control and lactate-exposed cultures at all the considered time intervals (p < 0.01). #: CRM197/BC11 significantly reduced the effects of lactate at 20 and 30 h (p < 0.01).
Figure 8
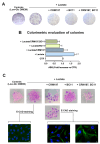
Figure 8
(A) Representative pictures of colonies formed by MDA-MB-231 cells, stained with CV. (B) Colorimetric evaluation of colonies. Data were evaluated by ANOVA, followed by Tukey’s post-test. *: a statistically significant difference was observed between lactate-exposed cells compared to controls and to all the applied treatments, with p values < 0.01–0.001. (C) High magnification pictures of colonies, showing the morphology changes induced by CRM197 (60×) and the immunostaining of E-cadherin (E-CAD) (600×). The green fluorescence indicative of E-CAD positive cells was clearly evident only in cells exposed to CRM197.

Similar articles

References

    1. Wang Z. ErbB Receptors and Cancer. Methods Mol. Biol. 2017;1652:3–35. doi: 10.1007/978-1-4939-7219-7_1. - DOI - PubMed
    1. Roskoski R., Jr. The ErbB/HER family of protein-tyrosine kinases and cancer. Pharmacol. Res. 2014;79:34–74. doi: 10.1016/j.phrs.2013.11.002. - DOI - PubMed
    1. Appert-Collin A., Hubert P., Crémel G., Bennasroune A. Role of ErbB receptors in cancer cell migration and invasion. Front. Pharmacol. 2015;6:283. doi: 10.3389/fphar.2015.00283. - DOI - PMC - PubMed
    1. Al Moustafa A.E., Achkhar A., Yasmeen A. EGF-receptor signaling and epithelial-mesenchymal transition in human carcinomas. Front. Biosci. 2012;4:71–84. doi: 10.2741/s292. - DOI - PubMed
    1. Lorch J.H., Klessner J., Park J.K., Getsios S., Wu Y.L., Stack M.S., Green K.J. Epidermal growth factor receptor inhibition promotes desmosome assembly and strengthens intercellular adhesion in squamous cell carcinoma cells. J. Biol. Chem. 2004;279:37191–37200. doi: 10.1074/jbc.M405123200. - DOI - PubMed

MeSH terms

LinkOut - more resources