. 2024 Oct:108:105363.
doi: 10.1016/j.ebiom.2024.105363. Epub 2024 Sep 25.

Chronic lung inflammation and CK14+ basal cell proliferation induce persistent alveolar-bronchiolization in SARS-CoV-2-infected hamsters

Affiliations

Chronic lung inflammation and CK14+ basal cell proliferation induce persistent alveolar-bronchiolization in SARS-CoV-2-infected hamsters

Can Li et al. EBioMedicine. 2024 Oct.

Abstract

Background: Post-acute sequalae of COVID-19 defines a wide range of ongoing symptoms and conditions long after SARS-CoV-2 infection including respiratory diseases. The histopathological changes in the lung and underlying mechanism remain elusive.

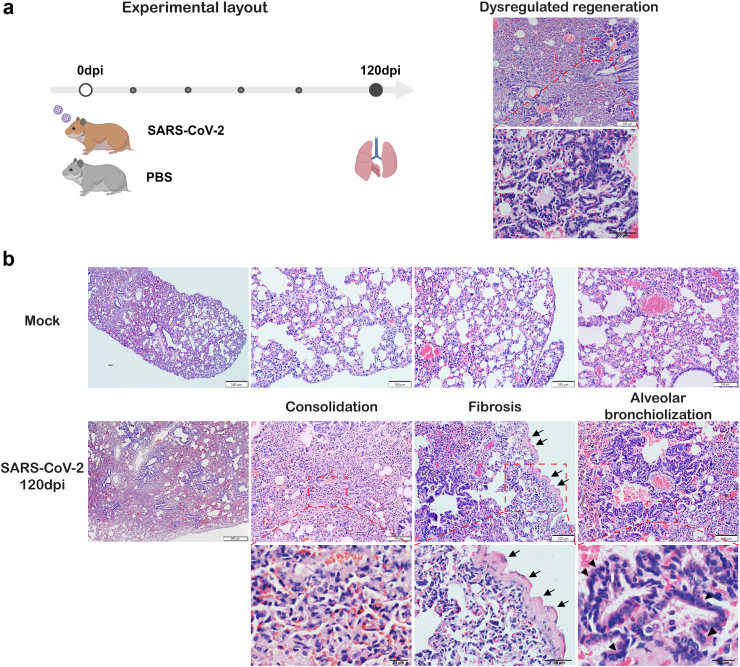
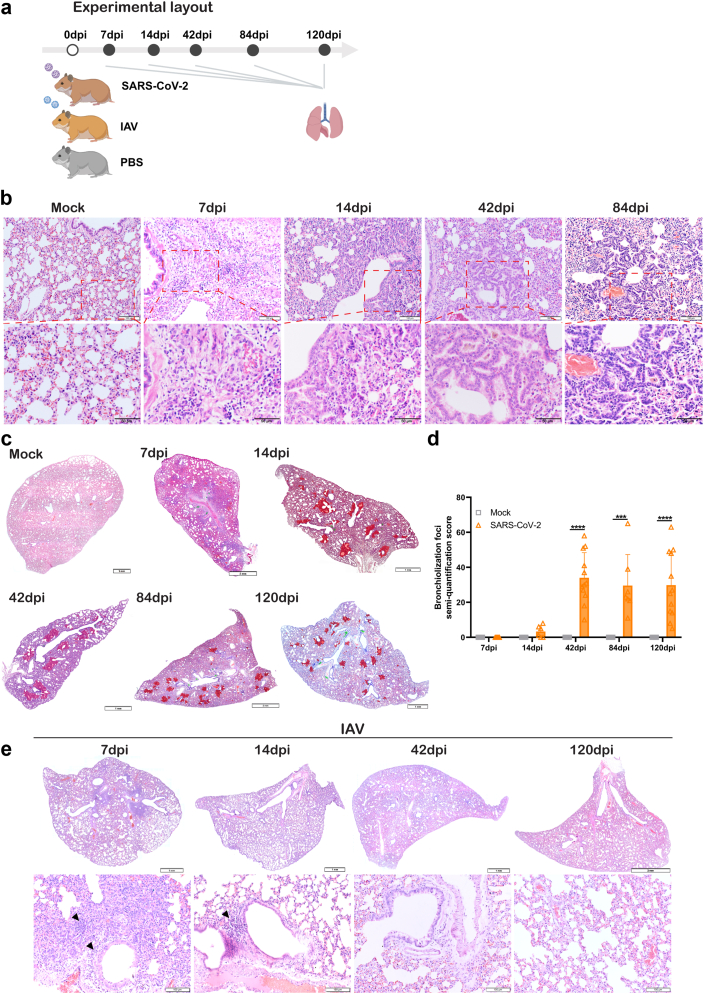
Methods: We investigated lung histopathological and transcriptional changes in SARS-CoV-2-infected male hamsters at 7, 14, 42, 84 and 120dpi, and compared with A (H1N1)pdm09 infection.

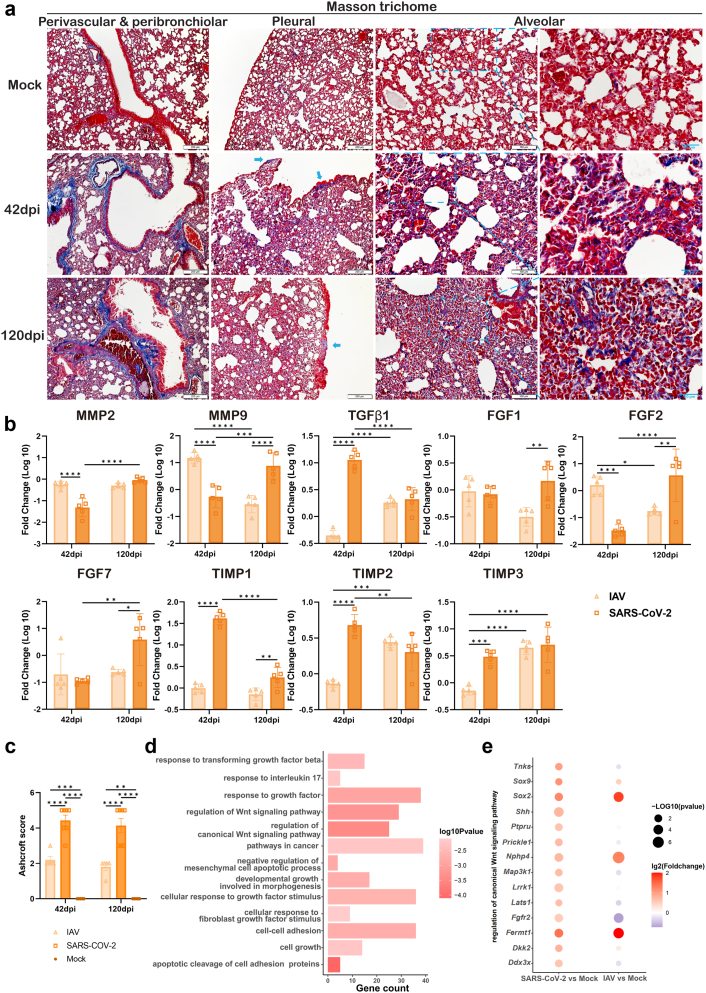
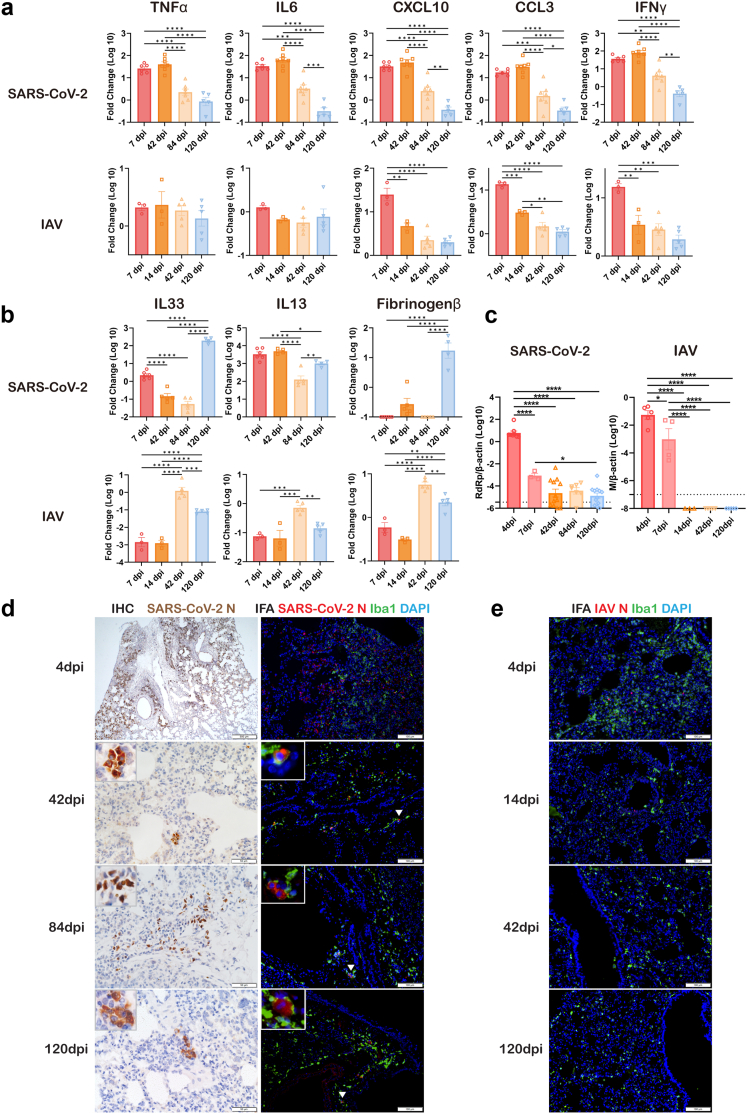
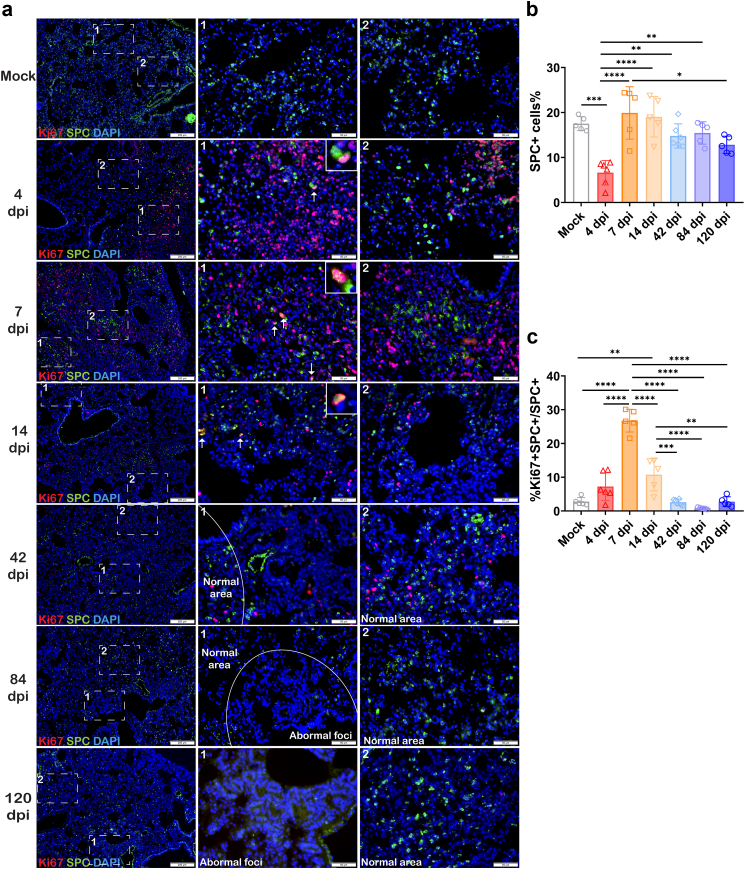
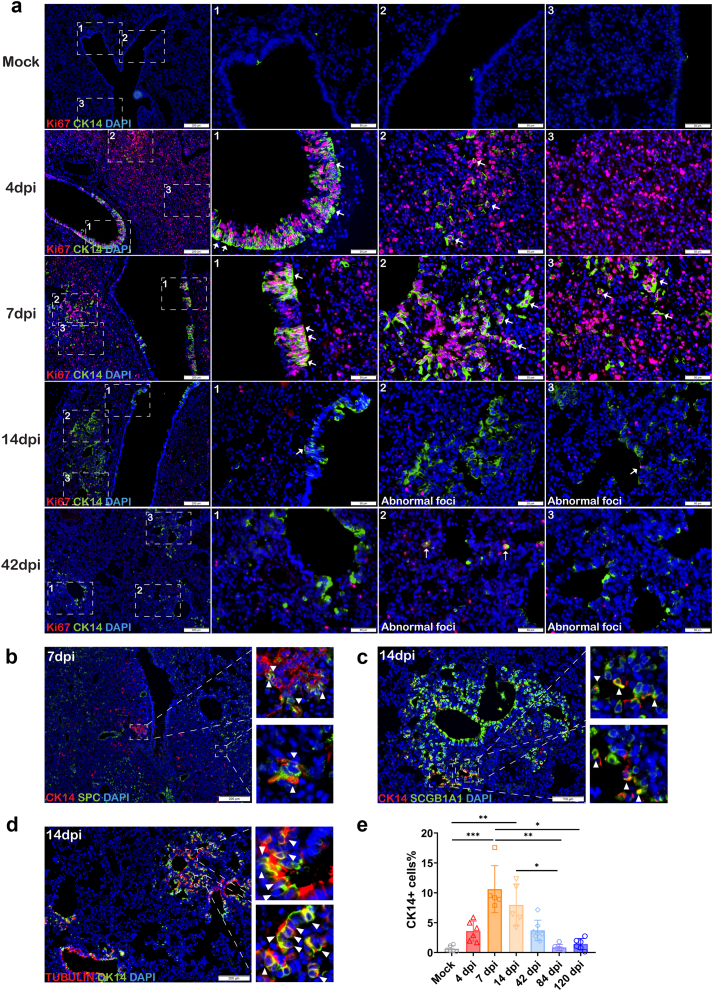
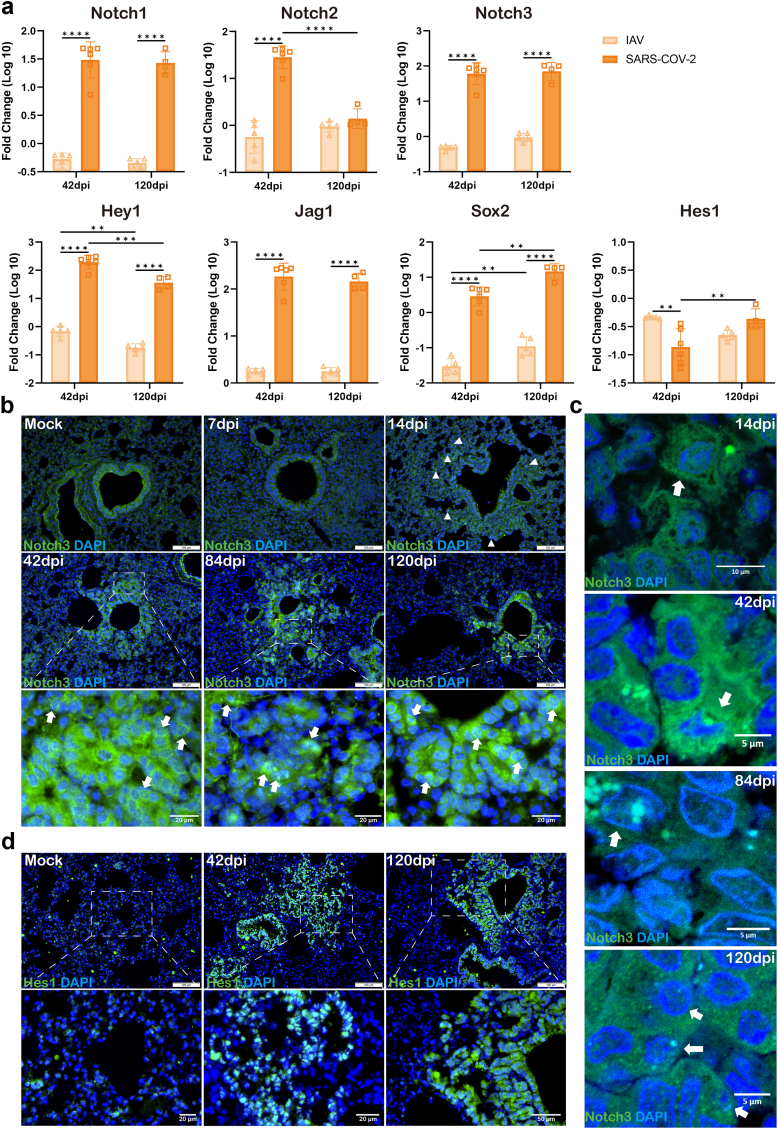
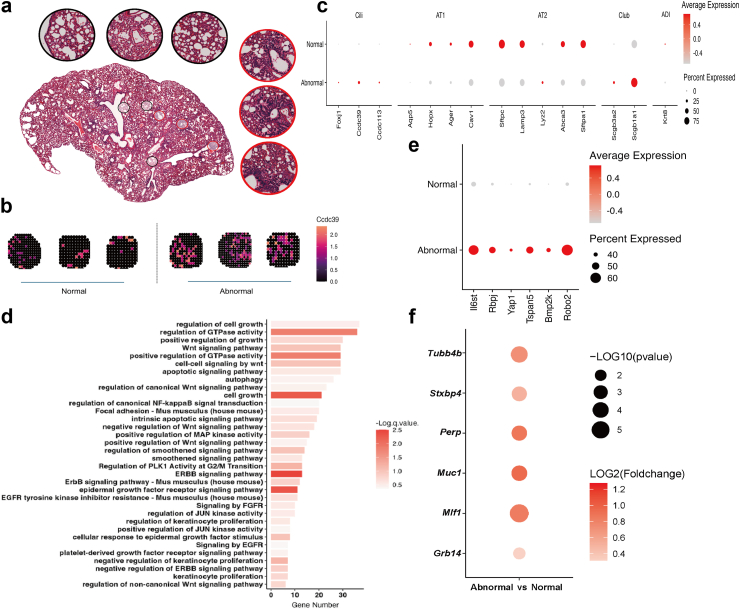
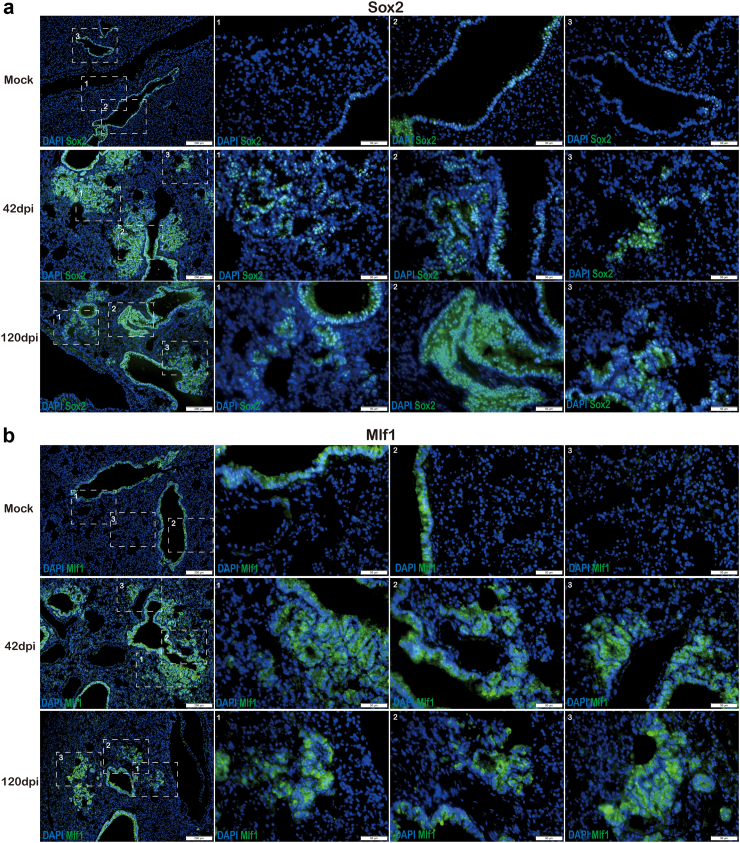
Findings: We demonstrated viral residue, inflammatory and fibrotic changes in lung after SARS-CoV-2 but not H1N1 infection. The most prominent histopathological lesion was multifocal alveolar-bronchiolization observed in every SARS-CoV-2 infected hamster (31/31), from 42dpi to 120dpi. Proliferating (Ki67+) CK14+ basal cells accumulated in alveoli adjacent to bronchioles at 7dpi, where they proliferated and differentiated into SCGB1A+ club cell or Tubulin+ ciliated cells forming alveolar-bronchiolization foci. Molecularly, Notch pathway significantly upregulated with intensive Notch3 and Hes1 protein expression in alveolar-bronchiolization foci at 42 and 120dpi, suggesting Notch signaling involving the persistence of alveolar-bronchiolization. This is further demonstrated by spatial transcriptomic analysis. Intriguingly, significant upregulation of some cell-growth promoting pathways and genes such as Tubb4b, Stxbp4, Grb14 and Mlf1 were spatially overlapping with bronchiolization lesion.

Interpretation: Incomplete resolution of SARS-CoV-2 infection in lung with viral residue, chronic inflammatory and fibrotic damage and alveolar-bronchiolization impaired respiratory function. Aberrant activation of CK14+ basal cells during tissue regeneration led to persistent alveolar-bronchiolization due to sustained Notch signaling. This study advances our understanding of respiratory PASC, sheds light on disease management and highlights the necessity for monitoring disease progression in people with respiratory PASC.

Funding: Funding is listed in the Acknowledgements section.

Keywords: Alveolar-bronchiolization; Basal cell; Hamster; Long COVID-19; PASC; SARS-CoV-2.


Conflict of interest statement

Declaration of interests We declare no competing interests.

Figures

Fig. 1
Fig. 1
SARS-CoV-2 infection causes persistent abnormal foci of alveolar bronchiolization and fibrosis in hamster lung. a. Experimental layout: 6–8 weeks old hamsters were intranasally inoculated with 103 PFU SARS-CoV-2 wild-type strain HK-13 or equal volume of PBS as mock controls. Lung tissues were collected at 120dpi. Dysregulated regeneration in SARS-CoV-2 infected hamster lungs was observed in all hamsters (12/12), and illustrated by H&E-stained sections. Upper image shows lung condensation with blood vessel congestion and multiple abnormal foci, lower image shows abnormal foci of alveolar bronchiolization. b. Representative H&E images showing pulmonary consolidation, fibrosis and alveolar bronchiolization in SARS-CoV-2 infected hamster lungs at 120dpi compared to mock control (upper panel). Middle panel: SARS-CoV-2 infected hamsters displayed whole lung condensation and multiple foci from proximal to distal lung regions. Bottom panel: Higher magnification images showing collapsed alveoli, pleurae thickening and alveolar bronchiolization. Black open arrows indicate pleurae thickening. Black triangles indicate alveolar epithelial cell hyperplasia. Scale bar = 500 μm, 200 μm, 100 μm, 50 μm, or 20 μm, respectively.
Fig. 2
Fig. 2
Progression dynamic of SARS-CoV-2 infection caused histopathological changes in hamster lung. a. Experimental layout: 6–8 weeks old hamsters were intranasally inoculated with 103 PFU SARS-CoV-2 wild-type strain HK-13, or 105 PFU mouse-adapted A (H1N1)pdm09 virus (IAV), or equal volume of PBS as mock controls. Lung tissues were collected at 7, 14, 42, 84 and 120dpi. b. Representative H&E images showing the prominent histological changes of SARS-CoV-2 infected hamster lungs at 7, 14, 42, 84dpi, and mock control lungs. c. Representative full scan H&E image of SARS-CoV-2 infected hamster lung lobe at 7, 14, 42, 84, 120dpi, and mock control. Red highlighted region indicate bronchiolization foci, which were observed in all the hamsters examined from 42dpi onward: 42dpi (12/12), 84dpi (7/7) and 120dpi (12/12). The green highlighted region indicate infiltration. d. Semi-quantification score of bronchiolization foci. n = 5 for mock control, 6 for 14dpi, 7 for 84dpi, 12 for 42&120dpi. e. Representative H&E images of IAV infected hamster lungs at 7, 14, 42 and 120dpi. Triangles indicate cell infiltration. Scale bar = 2 mm, 1 mm, 100 μm, or 50 μm, respectively. Data represented mean ± SD. ∗∗∗p < 0.001, ∗∗∗∗p < 0.0001 by Two-way ANOVA with Tukey's multiple comparisons test (d).
Fig. 3
Fig. 3
SARS-CoV-2 infection causes persistent fibrosis in hamster lung. a. Representative images of Masson trichrome stained lung of mock or SARS-CoV-2 infected hamsters at 42 and 120dpi. Left panel: Representative images showing dramatically increased collagen deposition in perivascular and peribronchiolar tissue in SARS-CoV-2 infected hamsters (blue color). Second left panel: Representative images showing pleural fibrosis in SARS-CoV-2 infected hamsters. Blue arrows indicate thickened visceral pleural membrane. Right two panels: Representative images and magnified images showing increased collagen deposition in alveolar wall in SARS-CoV-2 infected hamsters. Scale bar = 200 μm, 100 μm, or 20 μm, respectively. b. Relative mRNA expression levels of genes, MMPs, TIMPs, FGFs and TGF in the lung tissues of SARS-CoV-2 or IAV infected hamsters. n = 5. c. Semi-quantification of collagen deposition degree using Ashcroft score. n = 5 for IAV groups and 7 for other groups. d. Upregulated pathways in SARS-CoV-2 infected hamster lungs at 42dpi by RNAseq analysis. e. Differential expression of genes in regulation of canonical WNT signaling pathway in SARS-CoV-2 infected hamster lungs at 42dpi by RNAseq analysis. Data represents mean ± SD. ∗p < 0.05, ∗∗p < 0.01, ∗∗∗p < 0.001, ∗∗∗∗p < 0.0001 by Two-way ANOVA with Tukey's multiple comparisons test (b and c).
Fig. 4
Fig. 4
Sustained inflammatory responses and virus persistence in hamster lungafter SARS-CoV-2 infection. a. Relative mRNA expression levels of proinflammatory cytokines/chemokines in the lung tissues of SARS-CoV-2 and IAV infected hamsters from 7dpi to 120dpi. n = 3 for IAV 7&14dpi, 5 for IAV 42&120dpi and SARS2 120dpi, 6 for SARS2 7dpi, 7 for SARS2 42&84dpi. b. Relative mRNA expression levels of chronic inflammatory mediators in the lung tissues of SARS-CoV-2 and IAV infected hamsters. n = 3 for IAV 7&14dpi, 5 for IAV 42&120dpi and SARS2 42&84dpi, 6 for SARS2 7dpi, 4 for SARS2 120dpi. c. Viral load of SARS-CoV-2 RdRp (left) and influenza M (right) in the lung tissues at different time points after infection. n = 3 for SARS2 7dpi and IAV 14dpi; 4 for IAV 7dpi; 5 for IAV 4, 42&120dpi; 7 for SARS2 84dpi; 8 for SARS2 4dpi; 12 for SARS2 42&120dpi. Dashed lines indicate as cut-off line determined by mock controls. d. Representative immunohistochemistry stained SARS2-CoV-2 N protein (left panel) and double immunofluorescence-stained N protein (red) and macrophage marker Iba1 (green) (right panel) in SARS-CoV-2 infected hamster lung. Triangles indicate positive cells which were magnified in each insert. e. Double immunofluorescence stained IAV N protein (red) and macrophage marker Iba1 (green) in IAV infected hamster lung. Scale bar = 100 μm. Data represents mean ± SD. ∗p < 0.05, ∗∗p < 0.01, ∗∗∗p < 0.001, ∗∗∗∗p < 0.0001 by One-way ANOVA with Tukey's multiple comparisons test (a–c).
Fig. 5
Fig. 5
Alveolar AT2 cell regeneration in SARS-CoV-2 infected hamsters. a. Representative images of immunofluorescence stained Ki67 (red) and SPC (green) in SARS-CoV-2 infected hamster lungs. Numbered squares were magnified on the right-side. White arrows indicate Ki67 and SPC double positive cells illustrated in the inserts. Scale bar = 200 μm or 50 μm. b. Percentage of SPC+ AT2 cells in total cells of mock and SARS-CoV-2 infected hamster lung. n = 6 for 4&42dpi, 5 for other groups. c. Percentage of proliferative AT2 cells (Ki67+ SPC+/SPC+) in mock or SARS-CoV-2 infected hamster lungs. n = 6 for 4&42dpi, 5 for other groups. Data represents mean ± SD. ∗p < 0.05, ∗∗p < 0.01, ∗∗∗p < 0.001, ∗∗∗∗p < 0.0001 by One-way ANOVA with Tukey's multiple comparisons test (b and c).
Fig. 6
Fig. 6
CK14+ basal cells actively proliferated, differentiated in lung regeneration and bronchiolization in SARS-CoV-2 infected hamsters. a. Representative images of immunofluorescence stained Ki67 (red) and CK14 (green) in SARS-CoV-2 infected hamster lungs from 7dpi to 42dpi. Scale bar = 200 μm or 50 μm. Squared area 1 indicates bronchioles, area 2 and 3 indicate alveoli. White arrows indicate Ki67 and CK14 double positive cells. b. Representative image of immunofluorescence stained CK14 (red) and SPC (green) in SARS-CoV-2 infected hamster lung at 7dpi. White triangles indicated CK14 and SPC double positive cells. Scale bar = 200 μm. c and d. Representative image of immunofluorescence stained CK14 (red) and SCGB1A1 (green) (c) or CK14 (red) and Tubulin (green) (d) in SARS-CoV-2 infected hamster lung at 14dpi. White triangles indicate double positive cells. Scale bar = 200 μm or 100 μm. e. CK14+ basal cells percentage in total cells of mock or SARS-CoV-2 infected hamster lung. n = 6 for mock, 4dpi, 84&120dpi; 5 for 7&14dpi; 7 for 42dpi. Data represents mean ± SD. ∗p < 0.05, ∗∗p < 0.01, ∗∗∗p < 0.001, by Kruskal–Wallis test with Dunn's multiple comparisons test.
Fig. 7
Fig. 7
Bronchiolization foci is mainly composed of ciliated and club cells in SARS-CoV-2 infected hamster lung. a. Representative images of double immunofluorescence-stained Tubulin (red) and SCGB1A1 (green) in airway epithelium of mock or SARS-CoV-2 infected hamster lungs at 4 and 7dpi. Scale bar = 200 μm or 50 μm. b. Representative image of double immunofluorescence-stained Tubulin (red) and SCGB1A1 (green) in the airway and alveolar-bronchiolization foci in SARS-CoV-2 infected hamster lungs at 14, 42, 84 and 120dpi. Scale bar = 200 μm or 50 μm. c. Proposed lung regeneration after SARS-CoV-2 infection of hamster lung in graphic summary: During acute phase of SARS-CoV-2 infection (4&7dpi), CK14+ basal cells actively contributed to regeneration of bronchiolar epithelium. In alveolar, AT2 cells were damaged massively due to virus attack. Remaining AT2 cells self-renewed. CK14+ basal cells migrated and differentiated to AT2 cells for alveolar repair. At 14dpi, most bronchiolar and part of alveolar resumed to normal structure, while aberrant CK14+ basal cells differentiation lead to formation of foci of bronchiolization with club cells and ciliated cells, which persisted until 120dpi (the end point of observation).
Fig. 8
Fig. 8
Highly elevatedNotch signaling long after SARS-CoV-2 infection in hamster lung. a. Relative mRNA expression levels of Notch signaling related genes in the lung tissues in SARS-CoV-2 and IAV infected hamsters. n = 5 for IAV 42&120dpi, 6 for SARS-CoV-2 42dpi, 4 for SARS-CoV-2 120dpi. Data represents mean ± SD. b. Representative images of immunofluorescence stained Notch3 (green) in mock and SARS-CoV-2 infected hamster lung at 7, 14, 42, 84 and 120dpi. Scale bar = 100 μm or 20 μm. White triangles indicate Notch3 positive cells. White arrows indicate Notch3 signals inside nuclei. c. Representative magnified images of immunofluorescence stained Notch3 (green) captured by confocal microscopy in SARS-CoV-2 infected hamster lung at 14, 42, 84 and 120dpi. Scale bar = 5 μm or 10 μm. White arrows indicate Notch3 signals inside nuclei. d. Representative images of immunofluorescence stained Hes1 (green) in mock and SARS-CoV-2 infected hamster lung at 42 and 120dpi. Scale bar = 100 μm, 50 μm or 20 μm. White arrows indicate Notch3 positive cells. ∗p < 0.05, ∗∗p < 0.01, ∗∗∗∗p < 0.0001 by Two-way ANOVA with Tukey's multiple comparisons test (a).
Fig. 9
Fig. 9
Spatial transcriptomics of SARS-CoV-2 infected hamster lung. a. Six tissue regions representing abnormal (red circled), or normal (black circled) alveolar structures based on histological features shown in the H&E section. b.Ccdc39 gene expression in selected normal (left) and abnormal (right) tissue regions. c. Differential expression of genes expressed on ciliated cells, AT1 cells, AT2 cells, club cells and ADI cells in selected normal and abnormal tissue regions. d. Enriched pathways based on the up-regulated genes in abnormal tissue regions. e. Differential expression of genes associated with positive regulation of Notch signaling pathway in selected normal and abnormal tissue regions. f. Differential expression of genes related to cancer in selected normal and abnormal tissue regions.
Fig. 10
Fig. 10
Highly expressed Sox2 and Mlf1 in cells in bronchiolization foci of SARS-CoV-2 infected hamster lung. a. Representative images of immunofluorescence stained Sox2 (green) in mock or SARS-CoV-2 infected hamster lungs at 42 and 120dpi. Scale bar = 200 μm or 50 μm. b. Representative images of immunofluorescence stained Mlf1 (green) in mock or SARS-CoV-2 infected hamster lungs at 42 and 120dpi. Scale bar = 200 μm or 50 μm.

Similar articles

References

    1. World Health Organization . WHO Coronavirus (COVID-19) dashboard. 2024. Accessed on May 09, 2024.
    1. Davis H.E., McCorkell L., Vogel J.M., Topol E.J. Long COVID: major findings, mechanisms and recommendations. Nat Rev Microbiol. 2023;21(3):133–146. - PMC - PubMed
    1. Ballering A.V., van Zon S.K.R., Olde Hartman T.C., Rosmalen J.G.M. Persistence of somatic symptoms after COVID-19 in The Netherlands: an observational cohort study. Lancet. 2022;400(10350):452–461. - PMC - PubMed
    1. Stewart I., Jacob J., George P.M., et al. Residual lung abnormalities after COVID-19 hospitalization: interim analysis of the UKILD post-COVID-19 study. Am J Respir Crit Care Med. 2023;207(6):693–703. - PMC - PubMed
    1. Adegunsoye A., Baccile R., Best T.J., et al. Pharmacotherapy and pulmonary fibrosis risk after SARS-CoV-2 infection: a prospective nationwide cohort study in the United States. Lancet Reg Health Am. 2023;25:100566. - PMC - PubMed

MeSH terms

Substances