. 2024 Aug 30;10(17):e37221.
doi: 10.1016/j.heliyon.2024.e37221. eCollection 2024 Sep 15.

Optimized method for higher yield of alveolar macrophage isolation for ex vivo studies

Affiliations

Optimized method for higher yield of alveolar macrophage isolation for ex vivo studies

Surya Prasad Devkota et al. Heliyon. .

Abstract

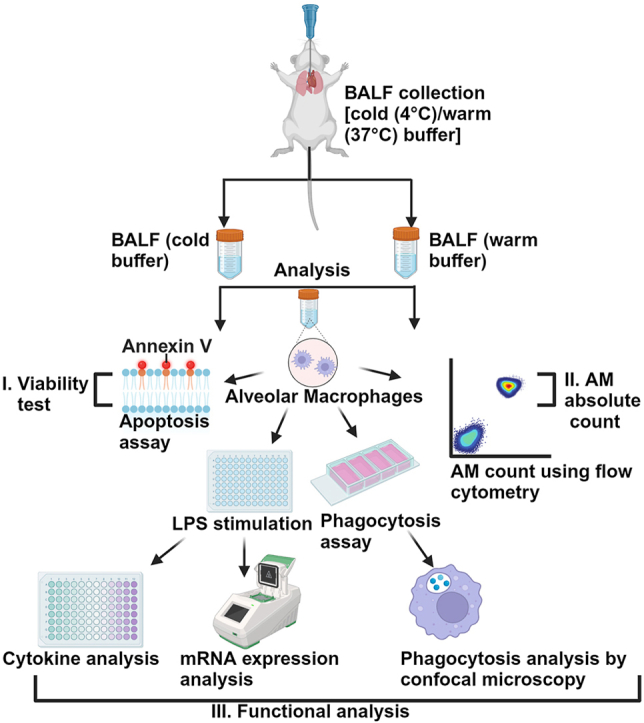
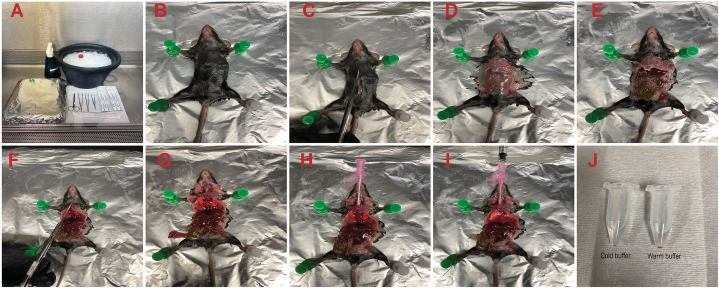
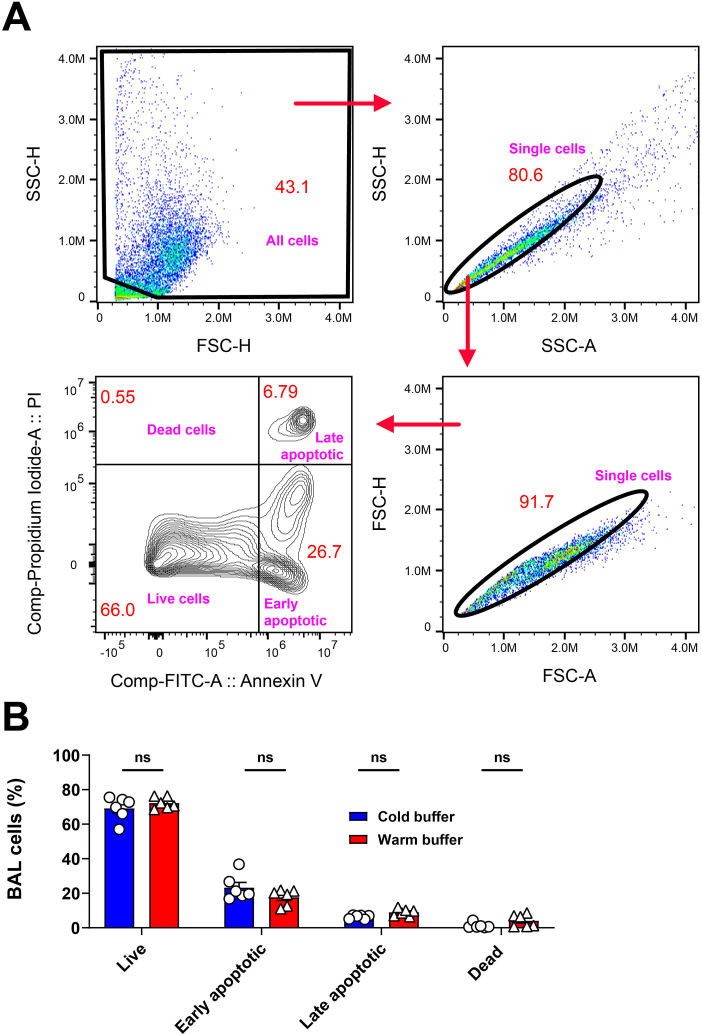
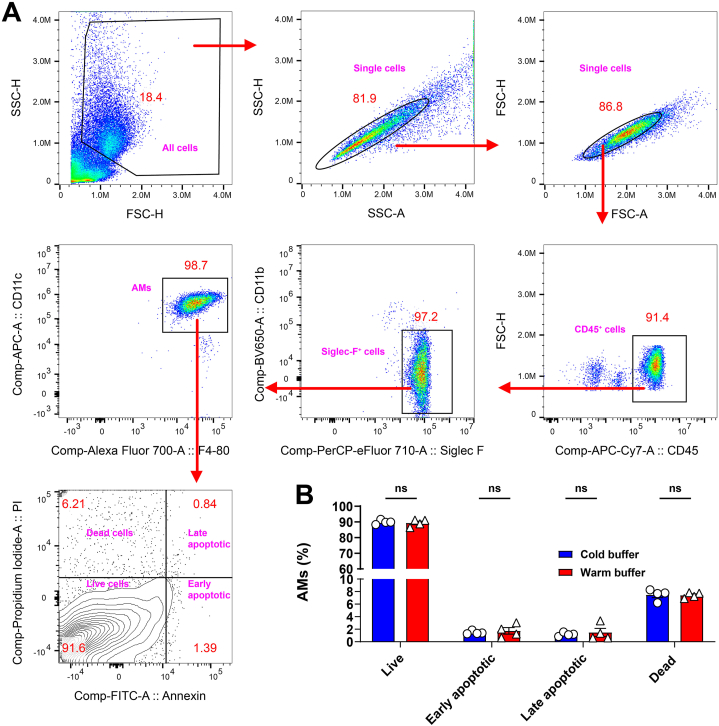
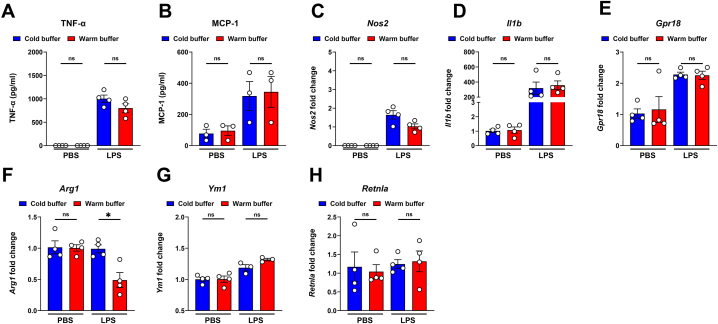
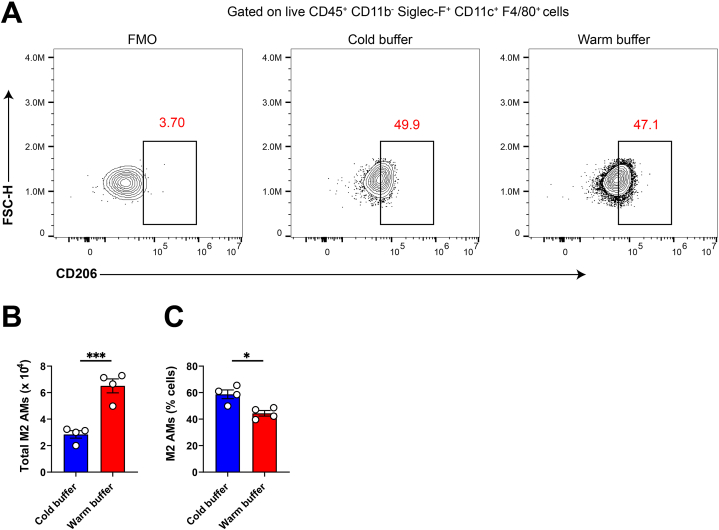
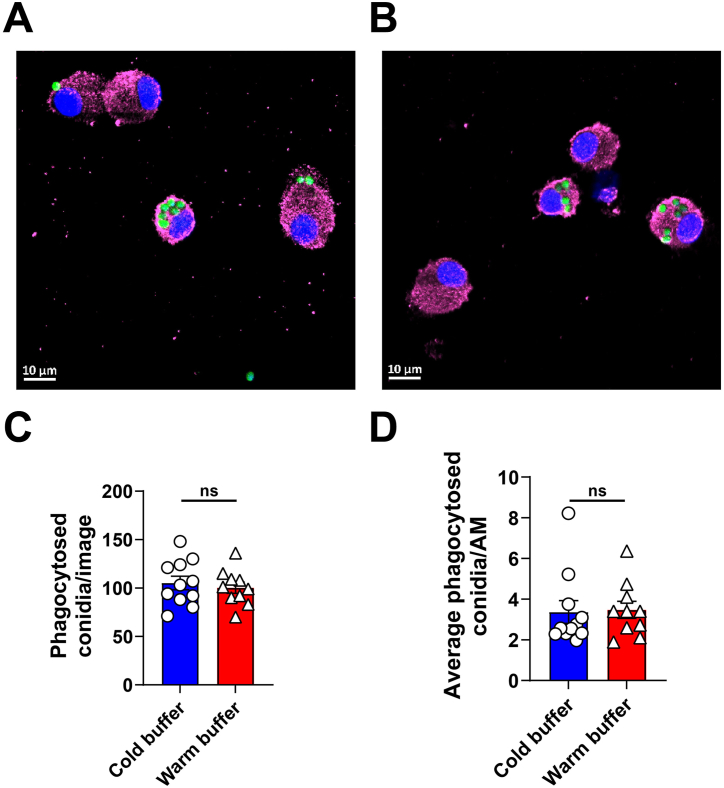
Alveolar macrophages (AMs) are a fully differentiated lung-resident immune cell population and are a critical component of lung immunity. AMs can be easily isolated from mice via bronchoalveolar lavage fluid (BALF) collection. The quality and quantity of AMs in BALF isolation are critical for generating reliable and high-quality data for ex vivo studies. Traditional techniques use ice-cold (4°C) buffer to collect AMs in BALF and result in low yield. Hence, a new method that consistently gives a higher yield of AMs is needed. We demonstrate here an optimized method that significantly increases the quantity of AM recovery in BALF (>2.8 times than the traditional method). Our method uses a warm-buffer (37°C) containing EDTA. We compared the viability and functional parameters (cytokine/chemokine expression, phagocytosis) of AMs isolated by our new and traditional methods. Our study revealed that AMs collected using our method have similar viability and functional characteristics to those collected using traditional method. Hence, our new method can be used for the collection of a higher number of AMs without altering their function. This protocol might also be useful for isolating tissue-resident immune cells from other anatomical sites for ex vivo and other downstream applications.

Keywords: Alveolar macrophages; Bronchoalveolar lavage fluid; Immune response; Phagocytosis; Warm buffer.


Conflict of interest statement

The authors declare that they have no known competing financial interests or personal relationships that could have appeared to influence the work reported in this paper.

Figures

Image 1
Graphical abstract
Fig. 1
Fig. 1
Overview of dissection setup and BALF collection (A) Workbench set up for the mouse dissection and necessary tools. (B–I) Steps involved in mouse dissection and BALF isolation. (B) Fix the mouse on the dissection platform facing upside using thumb pin and spray 70 % ethanol throughout the exposed area. (C) Cut open the outer stomach layer. (D–E) Expose the abdomen and chest all the way to the trachea. (F) Cut the peritoneum, diaphragm, and chest cavity all the way to the neck without damaging the lungs and trachea. (G) Expose lungs and trachea clearly by cutting the muscles and tissue surrounding them. (H) Insert the 20 G cannula (BD Insyte Autoguard) into the trachea. (I) Lavage the lung with BALF buffer using 1 mL syringe containing 0.8 mL buffer four times, (J) Collect BALF in a 5 mL microcentrifuge tube, place it on ice, centrifuge the lavage, and follow the BALF analysis procedure.
Fig. 2
Fig. 2
Total BAL cells, and gating strategy to characterize and quantify alveolar macrophages. (A) Quantification of total BALF cells using a hemocytometer. BALF cells were isolated using cold buffer and warm buffer. (B) Characterization of alveolar macrophages (AMs) in BALF using flow cytometry. BALF single cells were gated for Live/Dead CD45+ leukocytes, which were further gated as CD11bSiglec-F+ (SF) cells. The CD11bSF+ cells were further separated as CD11c+F4/80+ cells (AMs). (C) Total AM quantification in BALF isolated from ice-cold and warm buffers by flow cytometric analyses. Data in (A) & (C) are Means ± SEM & were analyzed by two-tailed unpaired t-test with the following significance level (*p < 0.05, **p < 0.01, ***p < 0.001, ****P < 0.0001). Each dot represents a single mouse.
Fig. 3
Fig. 3
Gating strategy for the characterization and quantification of BAL cells at different live/apoptotic stages. (A) BAL cells were analyzed for the viability and apoptosis using the apoptosis assay. Single cells were further gated for Annexin V and propidium iodide (PI) positivity. Cells which are both Annexin V and PI negative are live, only Annexin V positive are early apoptotic, both Annexin V and PI positive are late apoptotic, and PI only positive cells are dead as shown in the gating strategy. (B) Quantification of live, early apoptotic, late apoptotic, and dead cells by flow cytometry analyses. Each dot represents a single mouse. Total n = 6 mice was used for the cold buffer group and n = 6 mice was used for the warm buffer group. Data in (B) are Means ± SEM & were analyzed by two-tailed unpaired t-test with the following significance level (ns > 0.05).
Fig. 4
Fig. 4
Quantification of live, early apoptotic, late apoptotic, and dead AMs by flow cytometry analyses. (A) Gating strategy showing characterization of live, early apoptotic, late apoptotic, and dead AMs in BALF isolated using cold and warm buffers. AMs were characterized as CD45+ Siglec-F+ CD11b CD11c+ F4/80+ cells. Live cells were characterized as both PI and Annexin V negative. Annexin V only positive cells were early apoptotic and both PI and Annexin V positive cells were late apoptotic. Cells stained only for PI were dead. (B) Quantification of live, early apoptotic, late apoptotic and dead AMs. Each group has n = 4 mice. Data in (B) are means ± SEM and were analyzed by two-tailed unpaired t-test with the following significance level (ns > 0.05).
Fig. 5
Fig. 5
mRNA level gene expression and cytokine secretion by alveolar macrophages following LPS stimulation. (A to H) AMs were seeded in 96-well plates and stimulated with LPS after overnight culture. Culture medium was used for the unstimulated control samples. Following 4 h of stimulation, culture supernatants and cell pellets were collected. Quantification of TNF-α (A) and MCP-1 (B) levels in culture supernatants was determined by ELISA. The mRNA gene expression of Nos2 (C) Il1b (D), Gpr18 (E), Arg1 (F), Ym1 (G) and Retnla (H) were measured by real-time qPCR. Each dot represents a single mouse. Data in (A to H) are Means ± SEM and were analyzed using two-tailed unpaired t-test with the following significance level (ns > 0.05).
Fig. 6
Fig. 6
Quantification of M2 AMs in BALF. (A) Flow cytometry plots showing M2 alveolar macrophages (CD45+ Siglec-F+CD11bCD11c+ F4/80+ CD206+ cells). We used fluorescence minus one (FMO) as a negative staining control to decide the appropriate gating for M2 AMs. (B and C) Total M2 AMs (B), and proportion of M2 AMs (C) quantified in BALF isolated from ice-cold (with EDTA) and warm buffers (with EDTA). Data in (B) & (C) are means ± SEM & were analyzed by two-tailed unpaired t-test with the following significance level (*p < 0.05, ***p < 0.001). Each dot represents a mouse.
Fig. 7
Fig. 7
Confocal microscopy images showing phagocytosis of fungal conidia by AMs. Confocal images were taken using Zeiss LSM 880, EC Plan-Neofluar 40X/1.3 oil DIC objective (digital zoom 2). AMs isolated from cold-buffer (A) and warm buffer (B) were challenged with A. fumigatus conidia of MOI of 2 for 4 h, followed by immunofluorescence staining. Conidia were labeled with Alexa Fluor 488 (Green), nucleus with DAPI (Blue) and anti F4/80 antibody with Alexa Fluor 594 (Magenta) were used to stain AMs. Quantification of phagocytosis based on the number of conidia engulfed per image (C), and average number of engulfed conidia per AM (D). At least three images were taken per sample for quantification. For quantification purposes, images were taken using 40X objectives without zooming. Statistical analysis: two-tailed unpaired t-test with the following significance level (ns > 0.05). (For interpretation of the references to color in this figure legend, the reader is referred to the Web version of this article.)

Similar articles

References

    1. Hussell T., Bell T.J. Alveolar macrophages: plasticity in a tissue-specific context. Nat. Rev. Immunol. 2014;14(2):81–93. doi: 10.1038/nri3600. - DOI - PubMed
    1. Hu G., Christman J.W. vol. 10. Frontiers Media SA; 2019. p. 2275. (Alveolar Macrophages in Lung Inflammation and Resolution). - PMC - PubMed
    1. Pernet E., Sun S., Sarden N., et al. Neonatal imprinting of alveolar macrophages via neutrophil-derived 12-HETE. Nature. 2023;614(7948):530–538. doi: 10.1038/s41586-022-05660-7. - DOI - PMC - PubMed
    1. Lavin Y., Mortha A., Rahman A., Merad M. Regulation of macrophage development and function in peripheral tissues. Nat. Rev. Immunol. 2015;15(12):731–744. doi: 10.1038/nri3920. - DOI - PMC - PubMed
    1. Morales-Nebreda L., Misharin A.V., Perlman H., Budinger G.R.S. The heterogeneity of lung macrophages in the susceptibility to disease. Eur. Respir. Rev. 2015;24(137):505–509. doi: 10.1183/16000617.0031-2015. - DOI - PMC - PubMed

LinkOut - more resources