

Involvement of ICAM5 in Carcinostasis Effects on LUAD Based on the ROS1-Related Prognostic Model
- PMID: 39318995
- PMCID: PMC11421455
- DOI: 10.2147/JIR.S475088
Involvement of ICAM5 in Carcinostasis Effects on LUAD Based on the ROS1-Related Prognostic Model
Abstract
Background: Lung cancer is the most common type of cancer in the world. In lung adenocarcinoma (LUAD), studies on receptor tyrosine kinase ROS proto-oncogene 1 (ROS1) have mainly focused on the oncogenic effects of its fusion mutations, whereas ROS1 has been reported to be aberrantly expressed in a variety of cancers and can extensively regulate the growth, survival, and proliferation of tumor cells through multiple signaling pathways. The comprehensive analysis of ROS1 expression has not been fully investigated regarding its predictive value for LUAD patients.
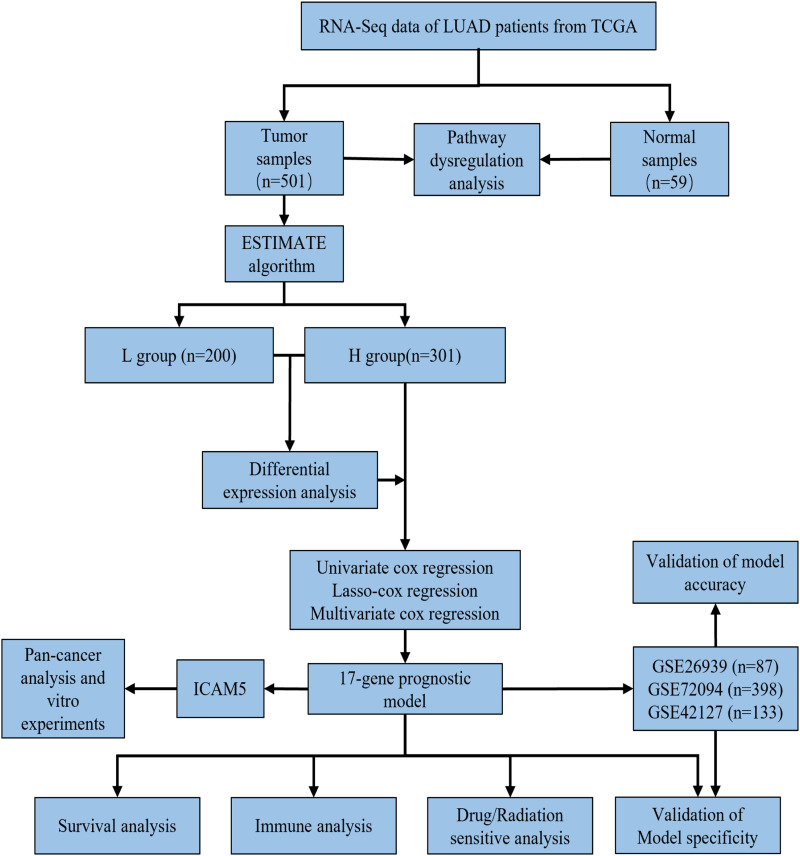
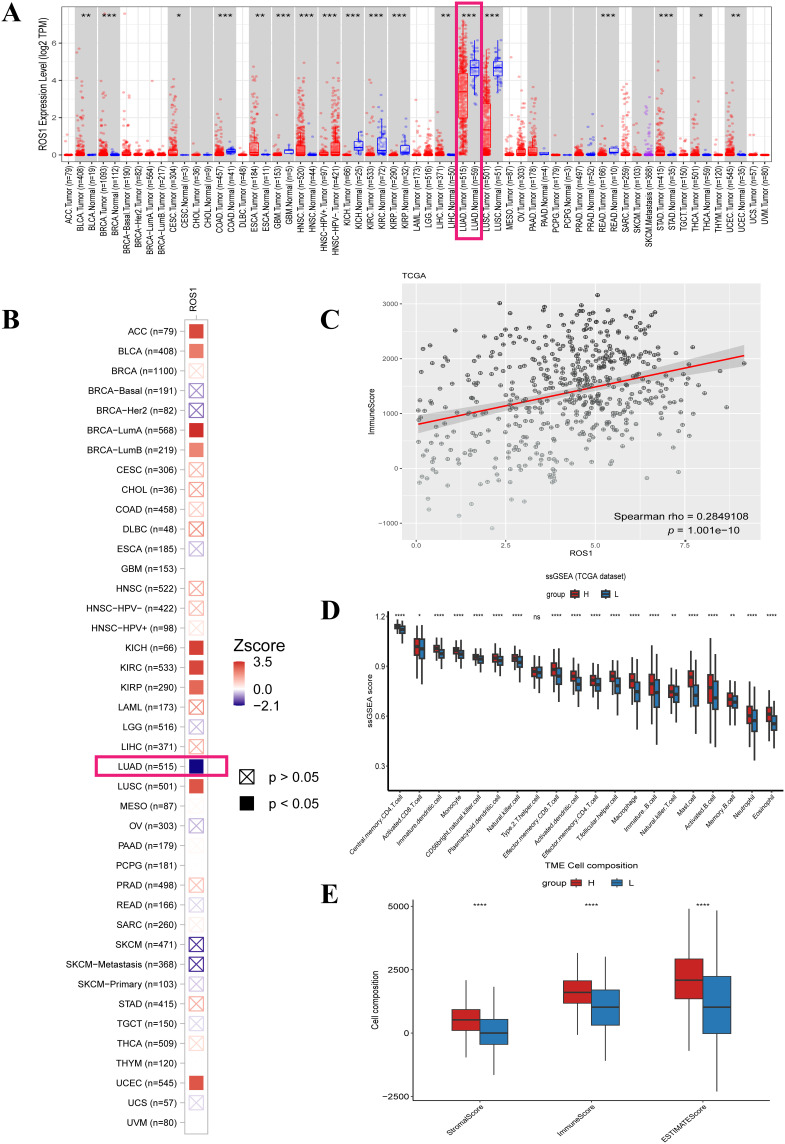
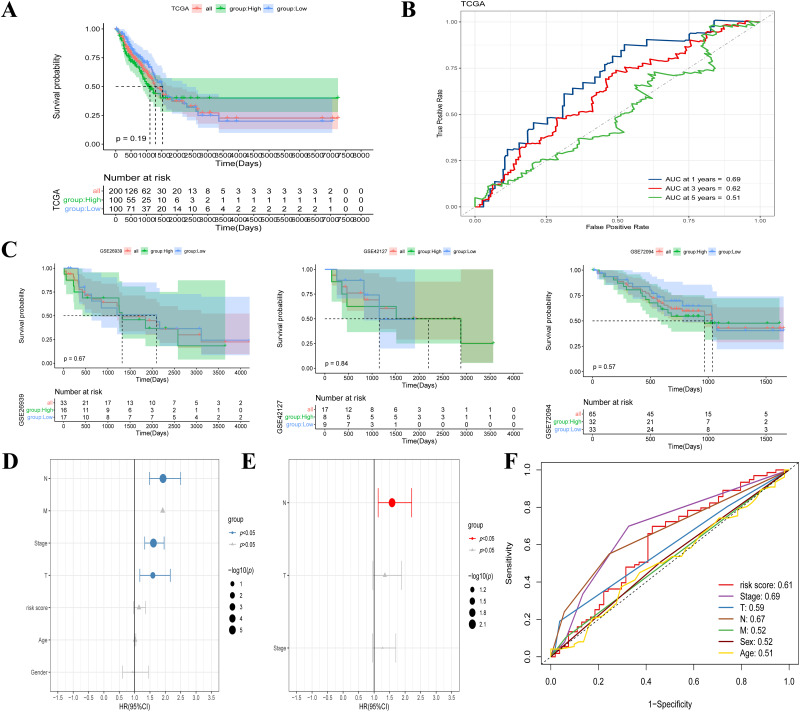
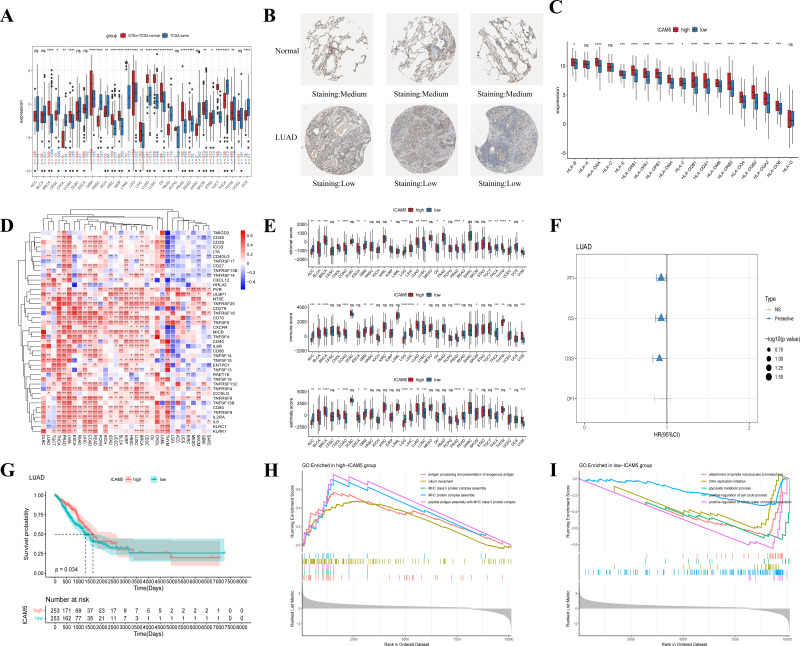
Methods: Gene expression profiles collected from The Cancer Genome Atlas (TCGA) and the Gene Expression Omnibus (GEO) databases were used to build and validate prognostic risk models. The association of ROS1 with overall survival and the immune landscape was obtained from the Tumor Immune Estimation Resource (TIMER) database. The following analyses were performed using the R package to determine the model's validity: pathway dysregulation analysis, gene set enrichment analysis, Gene Oncology analysis, immune invasion analysis, chemotherapy, radiotherapy, and immunotherapy sensitivity analysis. Finally, we conducted a pan-cancer analysis and performed in vitro experiments to explore the regulatory role of intercellular adhesion molecule 5 (ICAM5) in the progression of LUAD.
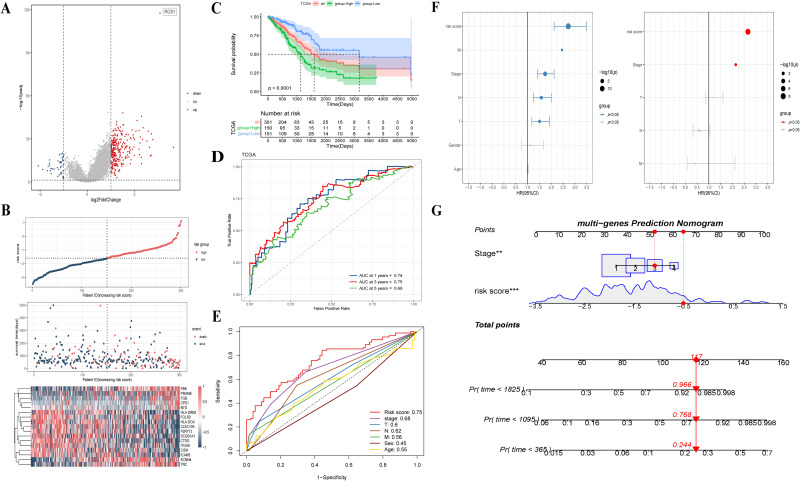
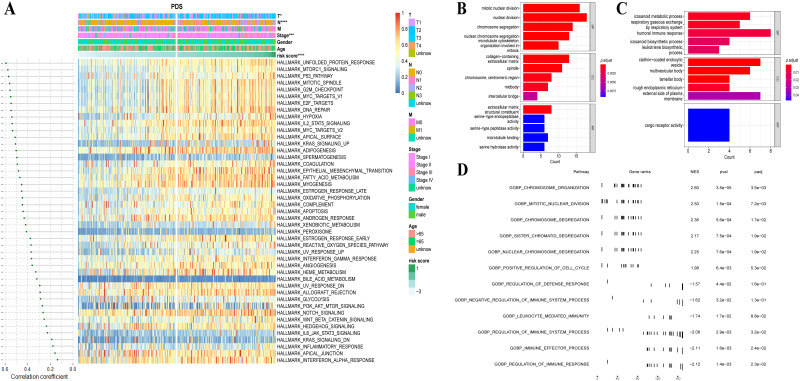
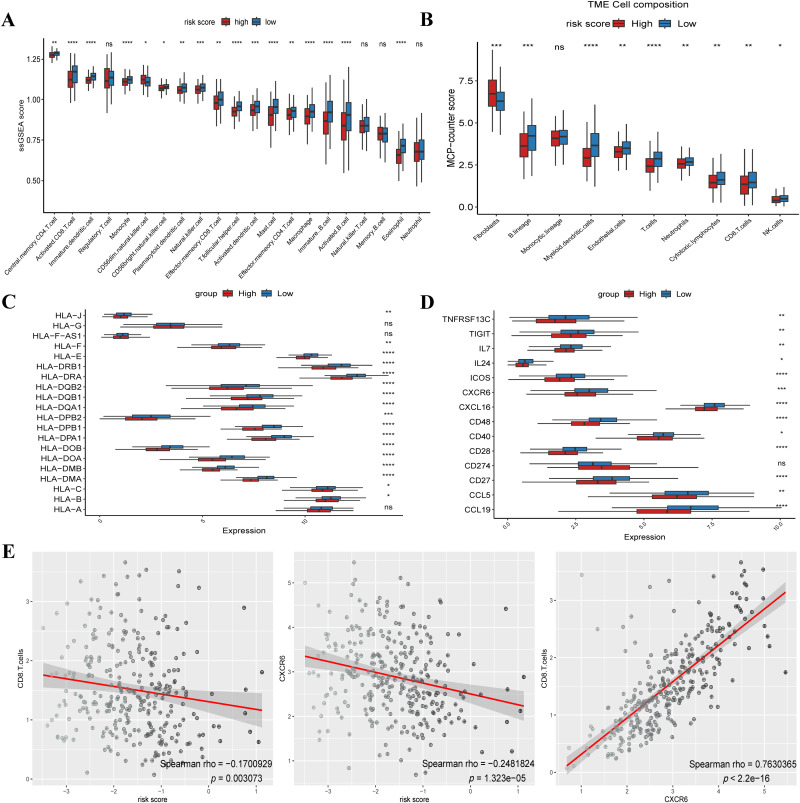
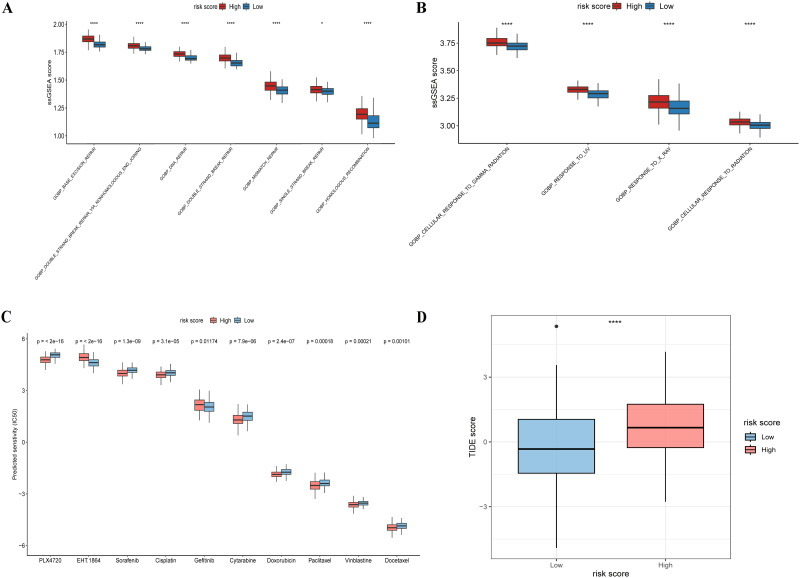
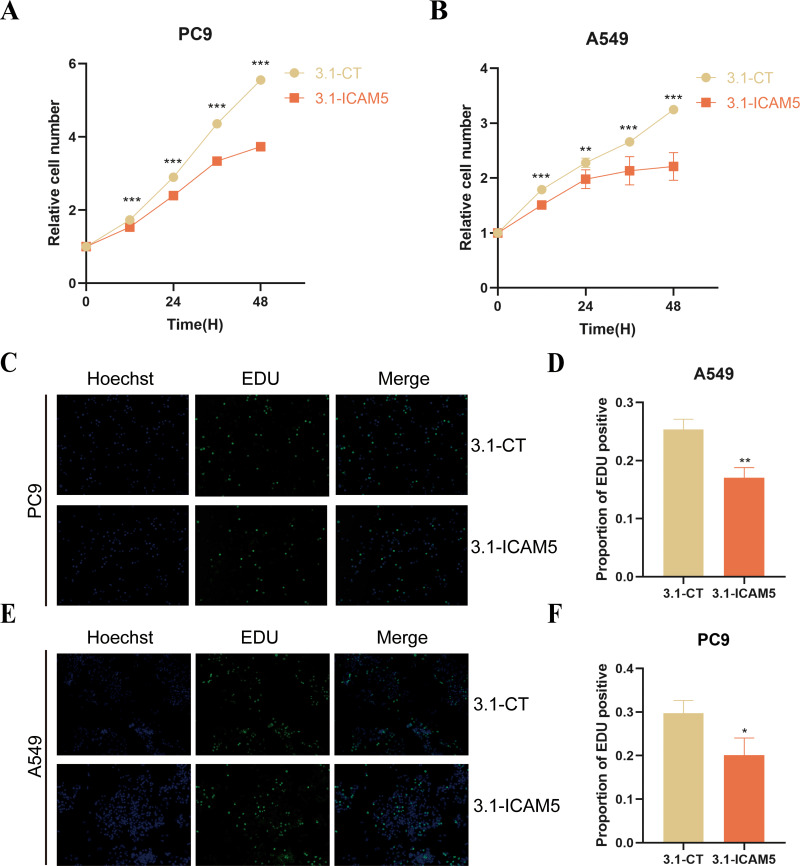
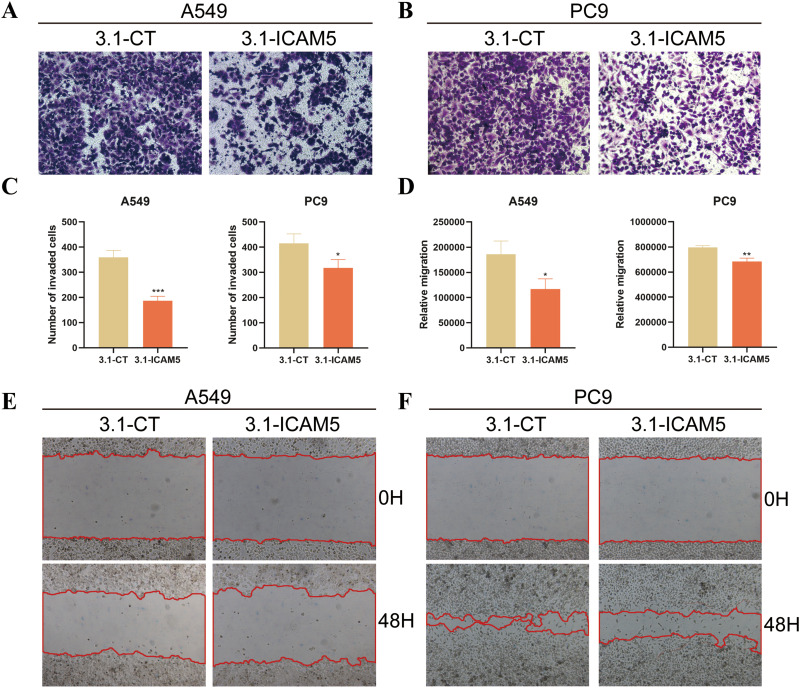
Results: We constructed a 17-gene model that categorized patients into two risk groups. The model had predictive accuracy for tumor prognosis and was specific for patients with high ROS1 expression. Comprehensive analysis showed that patients in the high-risk group were characterized by marked dysregulation of multiple pathways (eg, unfolded protein response), immune suppression of the tumor microenvironment, and poor benefit from immunotherapy and radiotherapy compared with patients in the low-risk group. PLX4720 may be a suitable treatment for the high-risk patient population. The ICAM5 gene has been demonstrated to inhibit the proliferation, cell cycle, invasion, and migration of LUAD cells.
Conclusion: We constructed a 17-gene prognostic risk model and found differences in immune-related cells, biological processes, and prognosis among patients in different risk groups based on the correlation between ROS1 and immunity. Personalized therapy may play an essential role in treatment. We further investigated the role of ICAM5 in inhibiting the malignant bioactivity of LUAD cells.
Keywords: ICAM5; LUAD; ROS1; immune; prognostic model.
© 2024 Liu et al.
Conflict of interest statement
Gemu Huang and Qingtao Song are affiliated with Amoy Diagnostics Co., LTD. The authors declare that they have no other competing interests in this work.
Figures
Similar articles
-
Identification of CDK2-Related Immune Forecast Model and ceRNA in Lung Adenocarcinoma, a Pan-Cancer Analysis.Front Cell Dev Biol. 2021 Jul 30;9:682002. doi: 10.3389/fcell.2021.682002. eCollection 2021. Front Cell Dev Biol. 2021. PMID: 34409029 Free PMC article.
-
Anoikis-related subtype and prognosis analyses based on bioinformatics, and an expression verification of ANGPTL4 based on experiments of lung adenocarcinoma.J Thorac Dis. 2024 Aug 31;16(8):5361-5378. doi: 10.21037/jtd-24-1123. Epub 2024 Aug 28. J Thorac Dis. 2024. PMID: 39268091 Free PMC article.
-
The prognostic value of immune escape-related genes in lung adenocarcinoma.Transl Cancer Res. 2024 Jun 30;13(6):2647-2661. doi: 10.21037/tcr-23-2295. Epub 2024 Jun 25. Transl Cancer Res. 2024. PMID: 38988926 Free PMC article.
-
Comprehensive analysis to identify GNG7 as a prognostic biomarker in lung adenocarcinoma correlating with immune infiltrates.Front Genet. 2022 Sep 9;13:984575. doi: 10.3389/fgene.2022.984575. eCollection 2022. Front Genet. 2022. PMID: 36159963 Free PMC article.
-
High Expression of DLGAP5 Indicates Poor Prognosis and Immunotherapy in Lung Adenocarcinoma and Promotes Proliferation through Regulation of the Cell Cycle.Dis Markers. 2023 Jan 19;2023:9292536. doi: 10.1155/2023/9292536. eCollection 2023. Dis Markers. 2023. PMID: 36712920 Free PMC article.
References
Grants and funding
LinkOut - more resources
Full Text Sources
