. 2024 Aug 15;9(18):e168889.
doi: 10.1172/jci.insight.168889.

Fibroblast-derived extracellular vesicles contain SFRP1 and mediate pulmonary fibrosis

Affiliations

Fibroblast-derived extracellular vesicles contain SFRP1 and mediate pulmonary fibrosis

Olivier Burgy et al. JCI Insight. .

Abstract

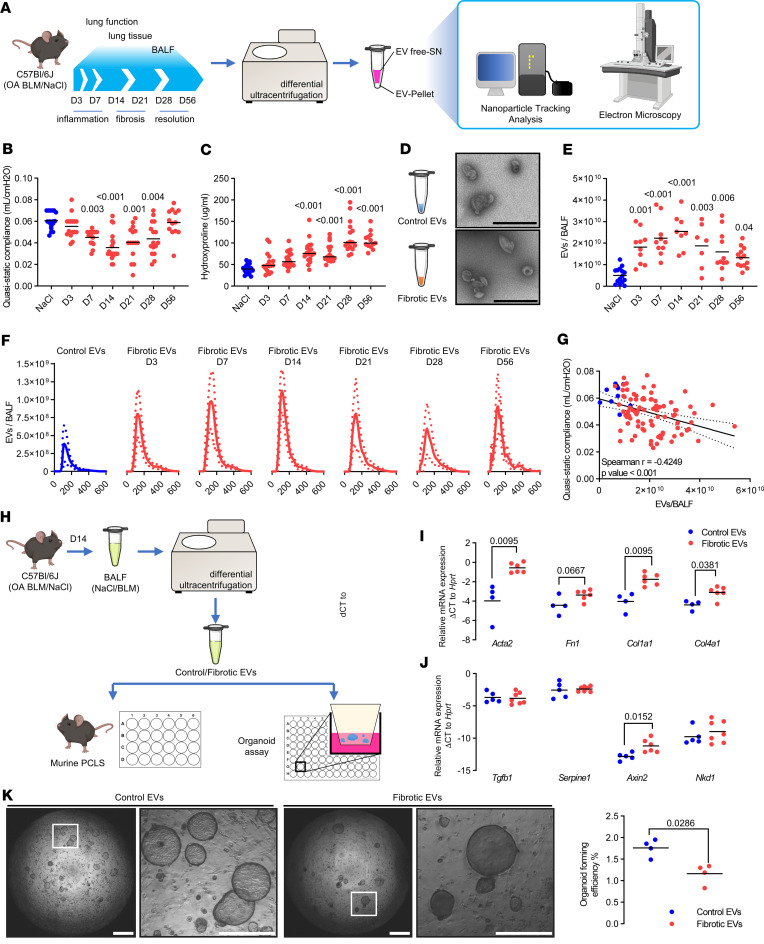
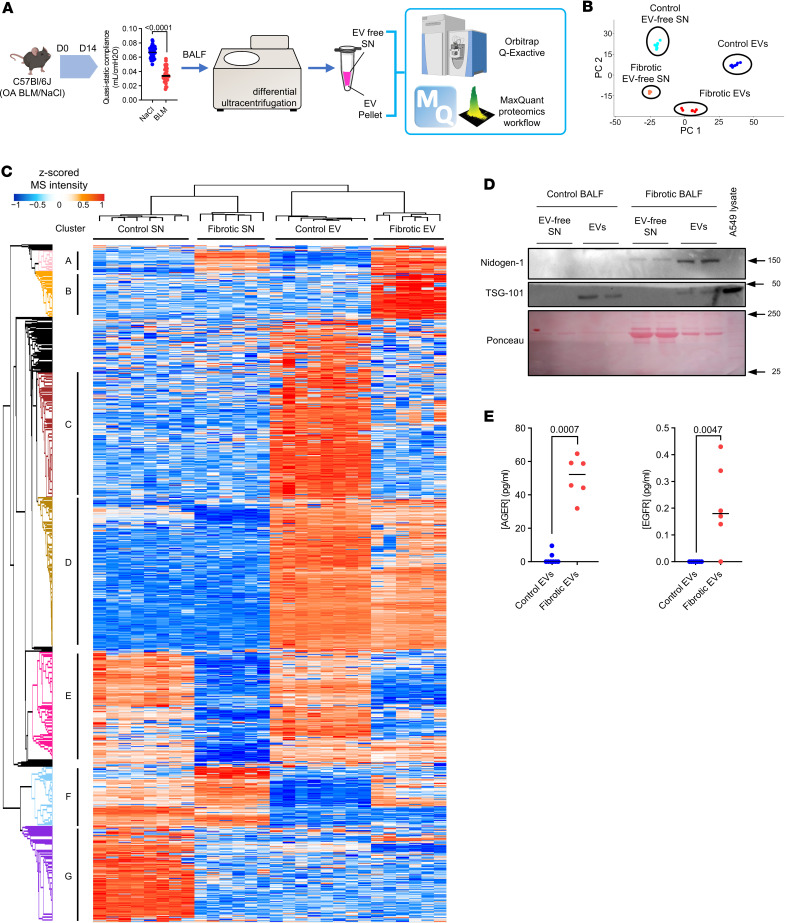
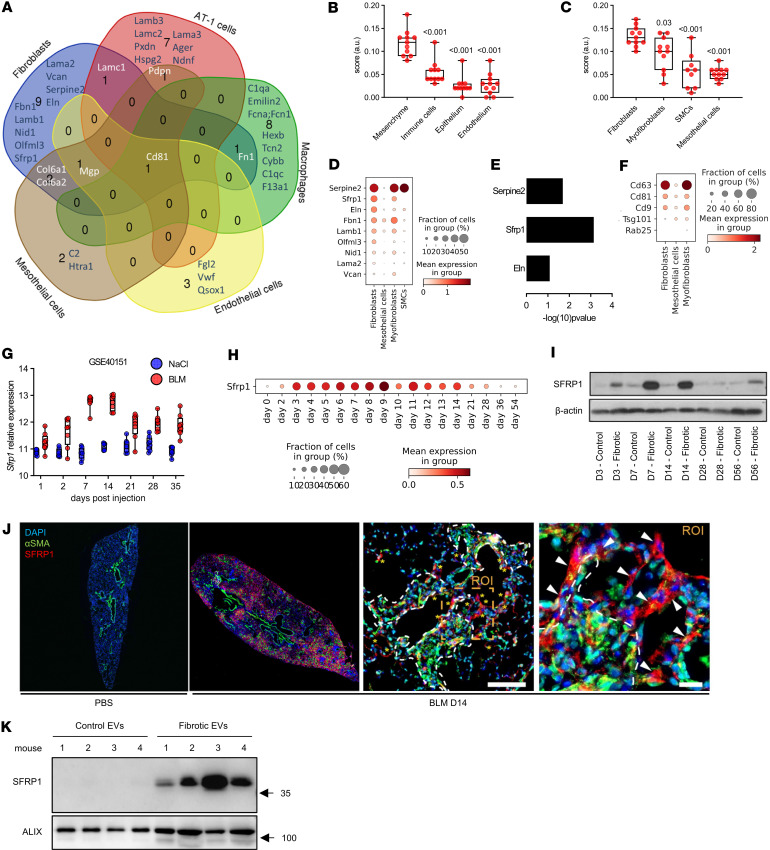
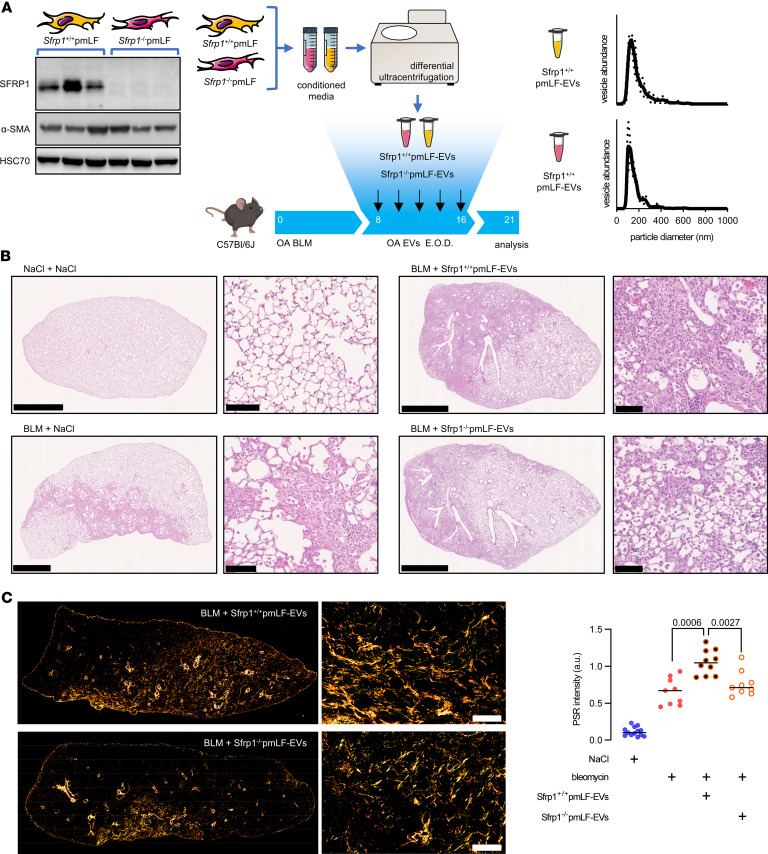
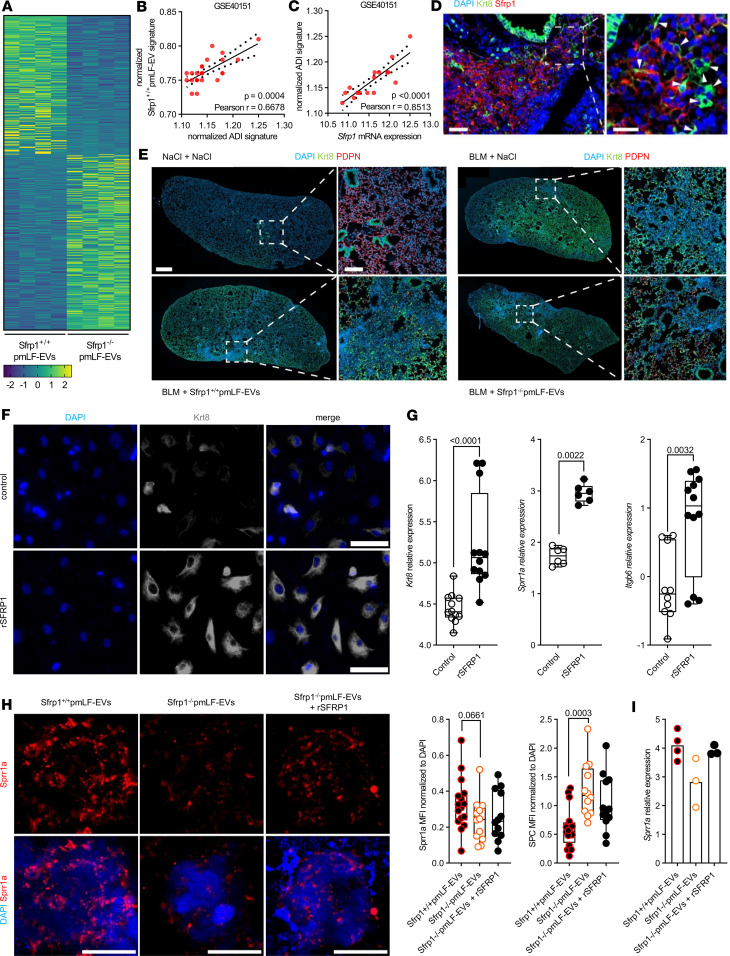
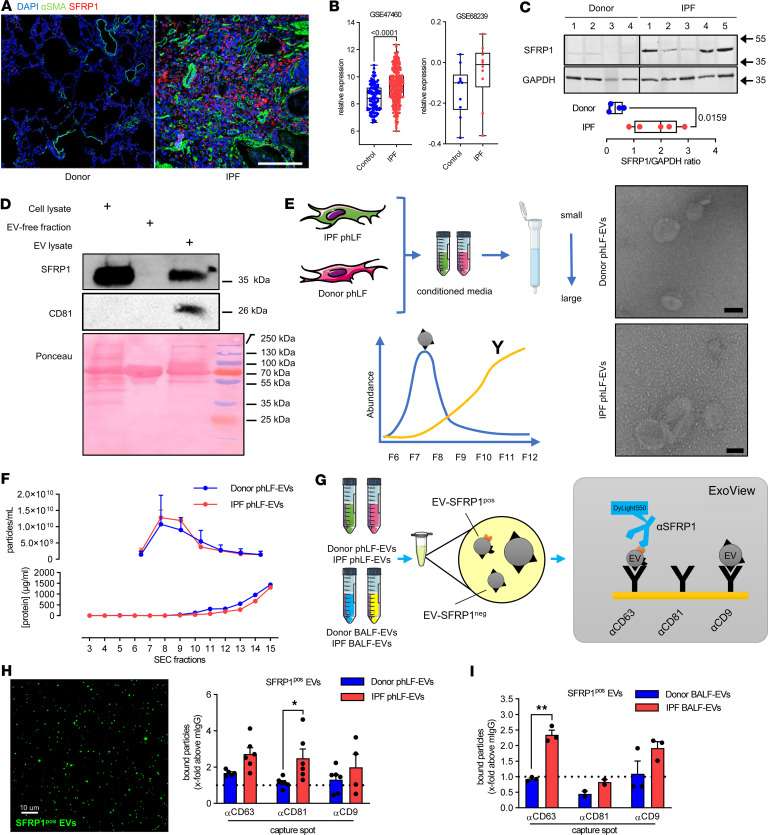
Idiopathic pulmonary fibrosis (IPF) is a lethal chronic lung disease characterized by aberrant intercellular communication, extracellular matrix deposition, and destruction of functional lung tissue. While extracellular vesicles (EVs) accumulate in the IPF lung, their cargo and biological effects remain unclear. We interrogated the proteome of EV and non-EV fractions during pulmonary fibrosis and characterized their contribution to fibrosis. EVs accumulated 14 days after bleomycin challenge, correlating with decreased lung function and initiated fibrogenesis in healthy precision-cut lung slices. Label-free proteomics of bronchoalveolar lavage fluid EVs (BALF-EVs) collected from mice challenged with bleomycin or control identified 107 proteins enriched in fibrotic vesicles. Multiomic analysis revealed fibroblasts as a major cellular source of BALF-EV cargo, which was enriched in secreted frizzled related protein 1 (SFRP1). Sfrp1 deficiency inhibited the activity of fibroblast-derived EVs to potentiate lung fibrosis in vivo. SFRP1 led to increased transitional cell markers, such as keratin 8, and WNT/β-catenin signaling in primary alveolar type 2 cells. SFRP1 was expressed within the IPF lung and localized at the surface of EVs from patient-derived fibroblasts and BALF. Our work reveals altered EV protein cargo in fibrotic EVs promoting fibrogenesis and identifies fibroblast-derived vesicular SFRP1 as a fibrotic mediator and potential therapeutic target for IPF.

Keywords: Cell biology; Fibrosis; Molecular biology; Pulmonology.


Figures

Figure 1
Figure 1. EVs accumulate in lung fibrosis, initiate lung remodeling, and impair alveolar epithelial cell function.
(A) C57BL/6J mice were exposed to orotracheal bleomycin or NaCl (control). Lung function was assessed and lung tissue and BALF were collected over the indicated time course. EVs were concentrated from BALF and characterized. BLM, bleomycin. (B) Quasistatic compliance and (C) hydroxyproline level of the corresponding experiments are shown. (D) BALF-EVs were observed by electron microscopy (scale bars indicate 600 nm) and (E) numbered by Nanosight (data expressed as number of particles per BALF). (F) EV quantification according to particle diameters (expressed in nm) at each time point after bleomycin exposure (mean ± SD). (G) Correlation between EV number and quasistatic compliance is depicted. (BG) Each point corresponds to a mouse (n = 5–8 for NaCl groups, n = 13–20 for BLM groups). (H) BALF-EVs were isolated from mice with pulmonary fibrosis (14 days after bleomycin) or control mice and used for functional assays. (I and J) PCLS from normal C57BL/6J were cultured with the abovementioned BALF-EVs. After 7 days, the expression of fibrosis-related genes was assessed by qPCR. Data are representative of PCLS from individual mice exposed to control- (n = 4 PCLS) or fibrotic EVs (n = 6 PCLS). Gene expression was normalized to Hprt expression. (K) Murine EpCAM-positive cells and CCL-206 fibroblasts in Matrigel were exposed to BALF-EVs for 14 days. Representative images (left panel, scale bar = 1 mm or 500 μm for region of interest [ROI] zoom) and quantification (right panel, n = 4 control EVs, n = 4 fibrotic EVs) of the organoid formation efficiency. Statistical analysis by Kruskal-Wallis followed by Dunn’s multiple comparisons tests (BD), Spearman’s correlation test (G), or nonparametric Mann-Whitney test (IK). P values are indicated for each comparison.
Figure 2
Figure 2. Label-free proteomics identifies several proteins specific to fibrotic EVs.
(A) C57BL/6J mice were exposed to orotracheal bleomycin or NaCl as control. At 14 days after injection, lung function was assessed and BALF was collected. BALF was utilized for EV isolation, and vesicular (EV pellet) as well as nonvesicular counterparts (EV-free SN) were subjected to label-free proteomics (n = 8 for control, n = 6 for bleomycin). (B) Principal component analysis representation of the different samples. (C) Heatmap of the identified proteins. Color coding corresponds to z-scored MS intensity values after imputation. Based on the unsupervised clustering, proteins were grouped into 7 clusters called A to G. (D) Levels of nidogen-1 (Western blot) in EVs from bleomycin or control mice are shown. TSG-101 was used to show protein enrichment in EVs, and protein content for each sample is shown with Ponceau. A549 lysate served as positive control. Equal (10 μg) protein content was used for the Western blot. (E) AGER and EGFR levels assessed by ELISA on normal (blue) and fibrotic (red) EVs. Data are presented as analyte concentration (pg/mL) normalized to 2 × 10⁸ vesicles. Statistical analysis by nonparametric Mann-Whitney. SN, EV-free fraction.
Figure 3
Figure 3. Fibroblasts are a major source of EVs during fibrosis.
(A) Venn diagram depicting the cellular origin of the bleomycin BALF-EV proteins. (B and C) Scoring of an scRNA-Seq dataset (GSE141259) for the mean expression of the 107 proteins identified in the bleomycin BALF-EVs in the main cellular compartments of the lung (B) as well as in mesenchymal populations (C). Box plots show the interquartile range, median (line), and minimum and maximum (whiskers). SMCs, smooth muscle cells. (D) Top proteins expressed in fibroblasts, among the proteins identified in bleomycin-BALF-EV and classified in main mesenchymal cellular compartments. (E) Statistical difference in the proteomic dataset between fibrotic and control EVs for the top 3 most expressed fibroblast-related genes. (F) Analysis of an scRNA-Seq dataset (GSE40151) for the expression of EV machinery in fibroblasts expressing (true) or not expressing (false) Sfrp1. (G) Gene expression of Sfrp1 in the lungs of mice with bleomycin-induced lung fibrosis or control (NaCl) mice. Data from GSE40151. (H and I) Expression of SFRP1 in lung tissue from mice exposed to bleomycin at different time points at the transcriptomic (H, data from GSE141259) or proteomic level (I). (J) Immunofluorescence staining for α-SMA (green) and SFRP1 (red) in FFPE lung sections from mice challenged with bleomycin (day 14) or NaCl as control. Representative observation of a fibrotic area from a mouse lung 14 days after bleomycin (right panels). Asterisks denote SFRP1+ transitional fibroblasts, dashed lines indicate fibrotic dense areas with α-SMA+ myofibroblasts (in green), and arrowheads point out single SFRP1+ transitional fibroblasts (in red) in the zoomed ROI. Nuclei are stained with DAPI (blue). Scale bars = 100 μm or 20 μm (ROI’s zoom). (K) Western blot for SFRP1 expression on normal and fibrotic EVs (n = 4/group). Equal number of vesicles (2 × 10⁸) loaded. ALIX serves as EV-enriched protein. Molecular weights (kDa) are indicated. All statistical analyses by nonparametric Mann-Whitney. P values as indicated.
Figure 4
Figure 4. Sfrp1 deficiency in fibroblast-derived EVs attenuates lung fibrosis in vivo.
(A) General outline of the experiment. EVs were isolated from the conditioned media of primary mouse lung fibroblasts (pmLFs) isolated from mice with genetic deletion of Sfrp1 (Sfrp1–/–) or WT control (Sfrp1+/+). SFRP1 expression was verified by Western blot (left panel). Isolated vesicles were characterized for size by NTA and injected intratracheally in mice previously challenged with bleomycin or control NaCl. E.O.D., every other day. (B) Representative histology of the lung of the above-described mice at D21 after bleomycin exposure. Scale bars indicate 2.5 μm or 100 μm (zoom). (C) Collagen quantification on FFPE lung sections stained with Picrosirius red and visualized under polarized light. Representative observation (n = 10 for BLM+Sfrp1+/+ pmLF-EVs and n = 9 BLM+Sfrp1–/– pmLF-EVs, left panel. Scale bar = 100 μm) and quantification (right panel) are shown. Statistical analysis by nonparametric Mann-Whitney. Each point represents 1 mouse. P values are indicated for each comparison.
Figure 5
Figure 5. SFRP1-EVs promote the accumulation of keratin 8–positive expressing AT2 cells.
(A) Heatmap of differentially expressed genes (P < 0.05) between WT EV and KO EV groups (n = 4 samples/group). Genes are ranked by averaged decreasing expression in the WT EV group. Krt8, keratin 8. (B and C) Correlation of WT EV signature (top 10) versus the ADI gene signature (B) or Sfrp1 expression versus ADI gene signature (C). Data from GSE40151 (D14 to D28 after bleomycin, n = 24). (D) Immunofluorescence analysis of lung tissue sections from bleomycin-treated mice at day 14 after injury (BLM D14) displaying the appearance of SFRP1+ cells (red) surrounding Krt8+ expressing ADI cells (green). Arrowheads in the magnified inset point out single Krt8+ ADI cells. Nuclei stained with DAPI (blue). Scale bars = 20 μm. (E) Immunofluorescence analysis of lung tissue sections from bleomycin-treated mice at day 14 after injury (BLM) compared with healthy controls (NaCl). BLM-treated mice were additionally treated with/without SFRP1-containing EVs. Podoplanin (PDPN) in red, Krt8 in green, and nuclei stained with DAPI in blue. Scale bars = 1,000 μm and 200 μm (ROI). (F and G) pmAT2 cells were cultured with or without recombinant (r) SFRP1. After 6 days, cells were analyzed for the expression of Krt8, Sprr1a, or Itgb6 by immunofluorescence (F) or qPCR (G). Scale bars = 50 μm. Representative data from 3 independent experiments. Box plots show the interquartile range, median (line), and minimum and maximum (whiskers). (H) Immunofluorescence analysis of Sprr1a (red) in organoids treated with WT or SFRP1–/– containing EVs or SFRP1–/– containing EVs supplemented with rSFRP1. Nuclei stained with DAPI (blue). Single points represent MFI from 4 single organoids for each biological replicate (n = 3–4). (I) Real-time qPCR to determine Sprr1a gene expression of organoids treated with WT or SFRP1–/– containing EVs or SFRP1–/– containing EVs supplemented with rSFRP1. Single points represent biological replicates (n = 3–4). Statistical analysis by nonparametric Mann-Whitney or Pearson’s correlation testing. P values and correlation coefficient indicated in corresponding panels.
Figure 6
Figure 6. SFRP1 in overexpressed in IPF and is transported by fibroblast EVs.
(A) Immunofluorescence staining for α-SMA (green) and SFRP1 (red) in FFPE lung sections from patients with IPF or donors. DAPI stains nuclei (blue). Scale bars = 200 μm. (B) Gene expression of SFRP1 in lung tissue from patients with IPF or controls. Data from GSE47460 and GSE68239. Box plots show the interquartile range, median (line), and minimum and maximum (whiskers). (C) SFRP1 expression by Western blot on lung tissue from patients with IPF (n = 5) or donors (n = 4). GAPDH serves as loading control. Densitometry over GAPDH is shown. (D) phLFs were cultured and EVs isolated from the cell culture SN. SFRP1 expression in cell lysate, EV-free fraction, and EV fractions. CD81 used as EV-enriched protein and Ponceau shows total protein amount. (E and F) phLF-EVs were isolated by SEC from conditioned media of control or IPF cells. Expected quantifications for EVs (blue) and proteins (yellow) are shown. Representative electron microscopy of pooled fractions 7–9 (E). Particle concentration in fractions 3–16 were quantified by nFCM (F). (G) Schematic presentation of ExoView analysis workflow for SFRP1 surface expression on EVs. ExoView chips have spotted capture antibodies targeting CD63, CD81, and CD9. EVs bound to the chip via the capture antibodies were visualized using a DyLink 550–conjugated α-SFRP1 antibody. (H) SFRP1+ EVs from phLFs (donor and IPF) were quantified using the ExoView system. Bound particles positive for SFRP1 at the different capture spots are presented as x-fold above mIgG background. SFRP1-positive EVs in green. Scale bar = 10 μm. (I) SFRP1+ EVs from human BALF (donor and IPF) were quantified using ExoView. Bound particles positive for SFRP1 at the different capture spots are presented as x-fold above murine IgG background. BALF from 5 donors each were pooled. Statistical analysis by parametric 2-tailed unpaired t test (C) or 2-way ANOVA (H and I). P values are indicated and *P < 0.05, **P < 0.01.

Similar articles

Cited by

References

    1. Wynn TA. Common and unique mechanisms regulate fibrosis in various fibroproliferative diseases. J Clin Invest. 2007;117(3):524–529. doi: 10.1172/JCI31487. - DOI - PMC - PubMed
    1. Martinez FJ, et al. Idiopathic pulmonary fibrosis. Nat Rev Dis Primers. 2017;3:17074. doi: 10.1038/nrdp.2017.74. - DOI - PubMed
    1. King TE, Jr A phase 3 trial of pirfenidone in patients with idiopathic pulmonary fibrosis. N Engl J Med. 2014;370(22):2083–2092. doi: 10.1056/NEJMoa1402582. - DOI - PubMed
    1. Richeldi L, et al. Nintedanib in patients with idiopathic pulmonary fibrosis: combined evidence from the TOMORROW and INPULSIS trials. Respir Med. 2016;113:74–79. doi: 10.1016/j.rmed.2016.02.001. - DOI - PubMed
    1. Burgy O, et al. Pathogenesis of fibrosis in interstitial lung disease. Curr Opin Pulm Med. 2020;26(5):429–435. doi: 10.1097/MCP.0000000000000706. - DOI - PubMed

MeSH terms