. 2024 Sep 9:15:1450349.
doi: 10.3389/fendo.2024.1450349. eCollection 2024.

Correction of osteopetrosis in the neonate oc/oc murine model after lentiviral vector gene therapy and non-genotoxic conditioning

Affiliations

Correction of osteopetrosis in the neonate oc/oc murine model after lentiviral vector gene therapy and non-genotoxic conditioning

Sara Penna et al. Front Endocrinol (Lausanne). .

Abstract

Introduction: Autosomal recessive osteopetrosis (ARO) is a rare genetic disease, characterized by increased bone density due to defective osteoclast function. Most of the cases are due to TCIRG1 gene mutation, leading to severe bone phenotype and death in the first years of life. The standard therapy is the hematopoietic stem cell transplantation (HSCT), but its success is limited by several constraints. Conversely, gene therapy (GT) could minimize the immune-mediated complications of allogeneic HSCT and offer a prompt treatment to these patients.

Methods: The Tcirg1-defective oc/oc mouse model displays a short lifespan and high bone density, closely mirroring the human condition. In this work, we exploited the oc/oc neonate mice to optimize the critical steps for a successful therapy.

Results: First, we showed that lentiviral vector GT can revert the osteopetrotic bone phenotype, allowing long-term survival and reducing extramedullary haematopoiesis. Then, we demonstrated that plerixafor-induced mobilization can further increase the high number of HSPCs circulating in peripheral blood, facilitating the collection of adequate numbers of cells for therapeutic purposes. Finally, pre-transplant non-genotoxic conditioning allowed the stable engraftment of HSPCs, albeit at lower level than conventional total body irradiation, and led to long-term survival and correction of bone phenotype, in the absence of acute toxicity.

Conclusion: These results will pave the way to the implementation of an effective GT protocol, reducing the transplant-related complication risks in the very young and severely affected ARO patients.

Keywords: HSC mobilization; TCIRG1 gene; conditioning; gene therapy; hematopoietic stem cells; lentiviral vector; osteoclast; osteopetrosis.


Conflict of interest statement

The authors declare that the research was conducted in the absence of any commercial or financial relationships that could be construed as a potential conflict of interest. The author(s) declared that they were an editorial board member of Frontiers, at the time of submission. This had no impact on the peer review process and the final decision.

Figures
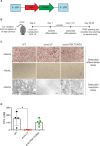
Figure 1
Figure 1
In vitro gene therapy (GT) of oc/oc derived osteoclasts (OCs). (A) Scheme of the lentiviral vector (LV) LV_PGK.TCIRG1, containing the human TCIRG1 cDNA under the control of the phosphoglycerate kinase (PGK) promoter, flanked by defective long terminal repeat elements (LTR). (B) Experimental scheme: splenic Lin- cells are isolated from 12-day-old pups and transduced with LV_PGK.TCIRG1 at a multiplicity of infection (MOI) 10. Then cells are differentiated towards the myeloid lineage for 7-10 days. Once myeloid committed precursors are obtained, OC differentiation is induced to evaluate differentiation and bone resorption capacity. (C) Representative picture of OCs differentiated from WT, untransduced (UT) oc/oc and LV_PGK.TCIRG1-transduced oc/oc Lin- cells, cultured in presence (top) or absence (middle) of RankL cytokine. OCs were stained for tartrate-resistant acid phosphatase (TRAP) activity. The bottom panel shows representative picture of bone resorption assay performed on OCs cultured on dentine slices and stained with toluidine blue to visualize bone resorption pits (darker areas). All images were acquired with Nikon ECLIPSE E600 microscope equipped with Nikon DS-Ri2 camera, using Plan Fluor 10x/0.13 objective and NIS-Elements F 4.30.01 software. (D) Quantification of C-telopeptide fragments from type I collagen (CTX-I) in the culture supernatant, released during resorption assay, by functional osteoclasts derived from WT, oc/oc untransduced (UT) and oc/oc PGK.TCIRG1-transduced Lin- cells.
Figure 2
Figure 2
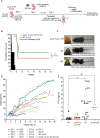
Ex vivo gene therapy (GT) of oc/oc mice. (A) Experimental scheme: Lin- cells are isolated from 14.5 days-post-coitum fetal livers of oc/oc embryos and transduced with LV_PGK.TCIRG1 at a multiplicity of infection (MOI) of 10. Cells are then transplanted by intra-liver injection into 300 rad conditioned oc/oc recipients at post-natal day (PND) 1 or 2. Transplanted mice were followed overtime for their clinical status and weight. The end of the experiment was set at 4 months after the transplant. Created with BioRender.com. (B) The Kaplan-Meier curve shows the survival of GT mice (GT, n=14) compared to oc/oc mice transplanted with WT Lin- cells (oc/oc Tx Lin- WT, n=15) and oc/oc untreated mice (n=8). Statistical analysis: Log-rank test, ns = not significant, p value is indicated. (C) Representative pictures show incisor teeth and body size of GT mice compared to oc/oc transplanted with WT Lin- cells and WT littermates. (D) The graph shows in color the body weights of all GT mice in comparison to the mean of oc/oc Tx Lin- WT and WT controls overtime (in black dashed and dotted lines, respectively). (E) Parathormone (PTH) concentration (ng/ml) in the serum of indicated experimental groups. Each dot represents the mean of two technical replicates. Labels indicate the identification numbers of GT mice. Serum of oc/oc transplanted with WT Lin- (n=6), GT mice (n=7) and WT controls (n=9) was collected at termination (8-20 weeks of age), while serum from oc/oc untreated (UNT) controls (n=5) was collected at 2-3 weeks of age. Statistical analysis: non-parametric one-way ANOVA with Dunn’s multiple comparison post-test. *p<0.05, **p<0.01.
Figure 3
Figure 3
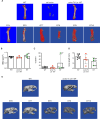
Bone structure analysis by micro-computed tomography (micro-CT). (A) Representative images showing micro-CT scanning of the femur of adult GT mice compared to oc/oc mice transplanted with WT Lin- cells and WT littermates. The cortical area of the bone is highlighted in red. Note that the cortical bone is clearly distinguished in GT4 and GT6, as well as in WT and oc/oc Tx Lin- WT mice. On the contrary, the bone was still extremely dense in GT7-GT10 and the cortical and trabecular components could not be distinguished. Image of oc/oc have been obtained from a 2-week-old mouse, but the dimension is inadequate for micro-CT. GT12 mouse: not done. (B) Bone mineral density (BMD) quantification in the trabecular region of the femur, performed on the images acquired in panel (A) GT8: scanned, not possible to quantify. GT9 and GT10: scanned but not quantified. GT12: not done. (C) Bone volume fraction (% BV/TV): ratio of the segmented bone volume to the total volume of the region of interest (D) Bone length (mm) of the scanned femurs. (E) Representative images of the skull of adult GT mice compared to oc/oc mice transplanted with WT Lin- cells and WT littermates. Labels indicate the identification numbers of GT mice. GT4 and GT12: not done.
Figure 4
Figure 4
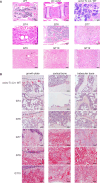
Histological analysis of vertebral column and femur. (A) Representative images of hematoxylin and eosin (H&E) staining of vertebral column section of GT compared to WT and oc/oc untreated controls and oc/oc mice transplanted with WT Lin- cells. Note that WT, oc/oc Tx Lin- WT and GT were obtained from adult mice (8-20 weeks of age), while oc/oc untreated controls were 2-week-old. Images were acquired with a 100x magnification (Leica DM2500 microscope equipped with Leica DFC310 FX camera). GT8: not done. (B) Images show tartrate-resistant acid phosphatase (TRAP) staining of femora sections of oc/oc mice transplanted with WT Lin- or GT cells. Images were acquired with a 200X magnification of the growth plate (left, the growth plate is outlined with a dashed line), in the cortical (middle) and in the trabecular (right) areas of the bone. GT8 and GT12: not done.
Figure 5
Figure 5
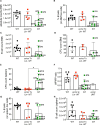
Hematopoietic organ readouts. (A) Total bone marrow (BM) cellularity in WT, oc/oc Tx Lin- WT and GT mice. Labels indicate the identification numbers of GT mice. (B) Frequency of B cells in the BM. GT8: not done. (C) Absolute counts of B cells in BM. (D) Counts of colony forming units (CFUs) from total BM. GT7, GT9 and GT10: not available due to culture contamination. (E) Counts of colony forming units (CFUs) from splenocytes. (F) Ratio of the white and red pulp areas (WP/RP) of the spleen. WP/RP of oc/oc untreated controls (UNT) is also reported. GT12: not done. (G) Frequency of B cells in the spleen. GT8: not done. (H) Absolute counts of B cells in spleen. Bars indicate mean ± SD. Statistical analysis: non-parametric one-way ANOVA with Dunn’s multiple comparison post-test. *p<0.05.
Figure 6
Figure 6
Plerixafor mobilization of hematopoietic stem and progenitor cells (HSPCs). (A) White blood cell (WBC) count per μl of blood of WT and oc/oc pups untreated (UT) or subcutaneously injected with a dose of 5 mg/kg of plerixafor (AMD3100) at post-natal day (PND) 3 and 7. (B) Counts of colony forming units (CFUs) for each μl of whole blood of WT mice at PND 3 and 7. (C) Counts of colony forming units (CFUs) for each μl of whole blood of oc/oc mice at PND 3 and 7. (D) Absolute counts of Lin- Sca1+ cKit+ (LSK) HSPCs per μl of blood at PND 3 and 7. Bars indicate mean ± SD. Statistical significance was determined by non-parametric one-way ANOVA with Dunn’s multiple comparison post-test. *p<0.05, ****p<0.0001.
Figure 7
Figure 7
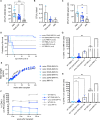
Non-genotoxic conditioning. (A) Counts of colony forming units (CFUs) obtained from 0.75*105 bone marrow (BM) cells of the indicated groups at day 2 (before transplant). (B) CFU counts per μl of blood at day 2. (C) CFU counts obtained from 1.5*105 spleen cells at day 2. (D) The Kaplan-Meier curve shows the survival of WT (dashed lines) and oc/oc (continuous lines) mice unconditioned (PBS-injected), irradiated (IRR) or CD45-saporin treated and transplanted with total BM cells. The number of mice of each group is indicated. (E) Weight of the oc/oc mice after transplant. (F) Mean frequency of donor-derived CD45.1 cells in the peripheral blood of transplanted mice overtime. (G) Frequency of donor derived CD45.1 cells in the BM of transplanted mice. (H) Frequency of donor derived CD45.1 cells in the spleen of transplanted mice. (A, C) and (G, H): bars indicate mean ± SD. Panel (F): each dot represents the mean ± SD. Statistical analysis A, C, G, H: non-parametric one-way ANOVA with Dunn’s multiple comparison post-test. *p<0.05, **p<0.01, ***p<0.001, ****p<0.0001.

Similar articles

References

    1. Penna S, Villa A, Capo V. Autosomal recessive osteopetrosis: Mechanisms and treatments. DMM Dis Model Mech. (2021) 14. doi: 10.1242/DMM.048940 - DOI - PMC - PubMed
    1. Teti A, Teitelbaum SL. Congenital disorders of bone and blood. Bone. (2019) 119:71–81. doi: 10.1016/j.bone.2018.03.002 - DOI - PubMed
    1. Whyte MP. Osteopetrosis: Discovery and early history of “marble bone disease. Bone. (2023) 171. doi: 10.1016/J.BONE.2023.116737 - DOI - PubMed
    1. Frattini A, Orchard PJ, Sobacchi C, Giliani S, Abinun M, Mattsson JP, et al. . Defects in TCIRG1 subunit of the vacuolar proton pump are responsible for a subset of human autosomal recessive osteopetrosis. Nat Genet. (2000) 25:343–6. doi: 10.1038/77131 - DOI - PubMed
    1. Capo V, Abinun M, Villa A. Osteoclast rich osteopetrosis due to defects in the TCIRG1 gene. Bone. (2022) 165:116519. doi: 10.1016/j.bone.2022.116519 - DOI - PubMed

Grants and funding

The author(s) declare financial support was received for the research, authorship, and/or publication of this article. This research was supported by Fondazione Telethon (grant TTAVC0522TT to AV and grant TGT21016 to SS), by a fellowship from the European Calcified Tissue Society (ECTS) to VC and by Italian Ministero della Salute (grant RF-2018-12367680 to CS and grant GR-2019-12369499 to SS). We acknowledge financial support under the National Recovery and Resilience Plan (NRRP), Mission 4, Component 2, Investment 1.4, Public Notice No. 3138 published on 16-12-2021 by the Italian Ministry of University and Research (MUR), funded by the European Union – NextGenerationEU – Project Title “National Center for Gene Therapy and Drugs based on RNA Technology” - Spoke 10 Pre-clinical Development, ID code CN_00000041 – CUP G83C22000270001 - Grant Assignment Decree No. 1035 adopted on 17-06-2022 by the Italian Ministry of University and Research (MUR).

LinkOut - more resources