[Preprint]. 2024 Nov 18:2024.09.09.612106.
doi: 10.1101/2024.09.09.612106.

Adaptive protein synthesis in genetic models of copper deficiency and childhood neurodegeneration

Affiliations

Adaptive protein synthesis in genetic models of copper deficiency and childhood neurodegeneration

Alicia R Lane et al. bioRxiv. .

Abstract

Rare inherited diseases caused by mutations in the copper transporters SLC31A1 (CTR1) or ATP7A induce copper deficiency in the brain, causing seizures and neurodegeneration in infancy through poorly understood mechanisms. Here, we used multiple model systems to characterize the molecular mechanisms by which neuronal cells respond to copper deficiency. Targeted deletion of CTR1 in neuroblastoma cells produced copper deficiency that was associated with a metabolic shift favoring glycolysis over oxidative phosphorylation. Proteomic and transcriptomic analysis of CTR1 KO cells revealed simultaneous upregulation of mTORC1 and S6K signaling and reduced PERK signaling. Patterns of gene and protein expression and pharmacogenomics show increased activation of the mTORC1-S6K pathway as a pro-survival mechanism, ultimately resulting in increased protein synthesis. Spatial transcriptomic profiling of Atp7a flx/Y :: Vil1 Cre/+ mice identified upregulated protein synthesis machinery and mTORC1-S6K pathway genes in copper-deficient Purkinje neurons in the cerebellum. Genetic epistasis experiments in Drosophila demonstrated that copper deficiency dendritic phenotypes in class IV neurons are partially rescued by increased S6k expression or 4E-BP1 (Thor) RNAi, while epidermis phenotypes are exacerbated by Akt, S6k, or raptor RNAi. Overall, we demonstrate that increased mTORC1-S6K pathway activation and protein synthesis is an adaptive mechanism by which neuronal cells respond to copper deficiency.


Conflict of interest statement

Conflict of Interest Statement The authors declare no competing financial interests.

Figures

Figure 1–1.
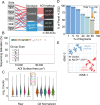
Figure 1–1.. Generation and Characterization of CTR1 (SLC31A1) Null Mutant Neuroblastoma Cells.
A. DNA sequence chromatograms of one wild type and three SLC31A1 CRISPR-edited SH-SY5Y clonal lines. Blue boxes mark the mutated sequence. B. Cell survival analysis of SLC31A1 mutants with increasing concentrations of copper. Blue shaded symbols represent three different clones (n=3 replicates for 1 or 3 clones for wild type or SLC31A1 mutants respectively). IC50 was calculated by fitting data to a non-linear model using Prism. C. Cell survival analysis of wild type and CTR1 mutants with increasing concentrations of elesclomol (n = 11 and 14, p value Sum-of-squares F test analysis). D. 64Zn quantification in whole cells or mitochondria in CTR1 KO cells treated with vehicle or 1 nM elesclomol, normalized to 32S. There are no significant differences by treatment or genotype as assessed by One-Way ANOVA, followed by Benjamini, Krieger, and Yekutieli multiple comparisons correction. E. Metabolic map of basal OCR and ECAR from the Mito Stress Test of wild-type and CTR1 KO cells (clone KO20) normalized to untreated wild-type cells treated with vehicle, elesclomol, or BCS as described in Fig. 1. F-G. Mass spectrometry quantification of metabolites, analyzed by One-Way ANOVA followed by Benjamini, Krieger, and Yekutieli multiple comparisons correction. CTR1 clone KO20 was used. G. Quantification of energy charge, calculated by dividing the amount of [ATP] + 0.5[ADP] by the total levels of [ATP]+[ADP]+[AMP] (Atkinson and Walton, 1967). Heat maps show the levels of the adenylate nucleotides used for the calculation and GTP for comparison. G. Quantification of lactate levels. All data are presented as average ± SEM.
Figure 2–1.
Figure 2–1.. Transcript changes in CTR1 mutants reflect increased activation of the mTOR and PI3K-Akt signaling pathways.
A. Principal component analysis of the Metabolic and Neuropathology annotated transcriptomes from wild type (gray) or CTR1 KO (blue symbols; KO20) clonal lines in the absence or presence of BCS (200 μM, 72 hours). B. Hierarchical clustering of the metabolism annotated transcriptome differentially expressed at a significancy of q<0.05 (analyzed by one-way ANOVA followed by Benjamini-Hochberg FDR correction). C. mTOR pathway annotated transcript levels, expressed as relative level. Each of these transcripts changed >1.5-fold as compared to wild type cells (q<0.05). D. Gene ontology analysis of metabolism annotated transcripts with increased or decreased expression in CTR1 mutants. KEGG database was queried with the ENRICHR engine. Fisher exact test followed by Benjamini-Hochberg correction. E. mTOR signaling pathway diagram modified from KEGG map04150. See Extended Data File 1 for raw data.
Figure 4–1.
Figure 4–1.. mTOR inhibitors reduce phosphorylation of mTOR and S6K.
Immunoblot of total and phosphorylated mTOR and S6K after overnight serum depletion in 0.2% serum, 30 minute pretreatment with rapamycin (270 nM) or Torin-2 (1 nM) in existing 0.2% serum media, followed by a switch to fresh media with 0.2% or 20% serum, rapamycin, and/or Torin-2 for 30 minutes.
Figure 4–2.
Figure 4–2.. Synergy analysis of CTR1 mutant cells.
A-D. Quantification of survival and drug synergy in wild-type and CTR1 mutant cells treated with Torin-2 and serum (A), Torin-2 and BCS (B), rapamycin and BCS (C), or Torin-2 and elesclomol (D). Gray panels represent cell survival normalized to untreated cells, as described in Figure 4. Blue panels represent the corresponding interaction synergy map calculated using the Zero Interaction Potency (ZIP) score for cell survival (Yadav et al., 2015) (refer to Figure 4).
Figure 5–1.
Figure 5–1.. Cell survival under conditions inhibiting protein synthesis.
A-B. Immunoblot for puromycin using a nitrocellulose membrane in wild-type and CTR1 mutant cells treated with vehicle (lanes 1 and 2) or puromycin for 30 min (lanes 3 and 4). Line trace represents the corresponding quantification of signal intensity. B. Quantification of the puromycin signal between 250 and 15 kDa normalized to HSP90. Paired two-tailed t test (pairing r=0.86, p=0.0007). C-D. Cell growth analysis of wild type and CTR1 mutants with increasing concentrations of emetine for 24 hours (D, Average ± SEM, n = 6, p value calculated with Sum-of-squares F test analysis) and corresponding IC50 (B, two-sided permutation t-test), as measured by Alamar blue. E. Cell growth of wild type and CTR1 KO cells in complete media and serum depletion after 48h as measured by total protein, normalized to the seeding cell number at time zero. Insert shows the percent difference in cell counts after the initial 48h. n=4 Average ± SEM. F. Normalized cell counts in wild type and CTR1 KO cells either in the absence or presence of 240 nM emetine for the indicated times. CTR1 clone KO20 was used for all experiments in C-F.
Figure 6–1.
Figure 6–1.. Spatial Transcriptomics Quality Controls and Descriptors.
A. Sankey diagram depicts an overview of samples (n=58) showing their annotations. B. Sequencing quality as measured by saturation to ensure sensitivity of low expressor genes. Sequencing saturation measures sequencing depth for a sample defined as (1 – % Unique reads). Threshold above 50% is considered a reliable determination. 0 samples below the 50% threshold. C. Sequencing reads raw and normalized to the third quartile (Q3) to account for differences in cellularity, area of interest (AOI) size, or other variables. D. number of genes in different percentages of tissues expressed above LOQ2 (Limit of Quantitation), defined as the Geometric Mean of the negative probes, multiplied by the geometric standard deviation to the second power (^2). We assayed 19,963 genes across 58 AOIs. Of these 17,453 genes were expressed in 10% of AOIs and 10,290 genes expressed were expressed in 50% of AOIs. E. t-Distributed Stochastic Neighbor Embedding (t-SNE) of gene expression values per annotation. See Extended Data File 2 for raw data.
Figure 6–2.
Figure 6–2.. Cell type-specific gene expression in the cerebellar cortex in a presymptomatic Menkes mouse model.
A. 63Cu and 64Zn quantification in the brains of Atp7aflx/Y :: Vil1Cre/+ mice at P10, normalized to 32S and analyzed by two-sided permutation t-test (italicized numbers represent p values). B. Volcano plot of mRNAs differentially expressed between the Purkinje and granular layer of control mice. C. Expression of selected cell type-specific markers (Kozareva et al., 2021). D. Differential expression of all transcripts compared to cytoplasmic ribosome subunits mRNAs. Whiskers correspond to 5–95 percentile, box represents 25 and 75 percentile, horizontal line marks the mean. Shaded area demotes ±1.5 fold difference. E. Gene ontology analysis of transcripts more highly expressed in Purkinje cells than granular layer cells. MSigDB was queried with the ENRICHR engine. Fisher exact test followed by Benjamini-Hochberg correction. F. 294 of the 1881 transcripts more highly expressed in wild-type Purkinje cells are annotated to the MitoCarta3.0 knowledgebase. G. GSEA and NES enrichment score of genes differentially expressed in wild-type Purkinje cells and granular layer cells reveal enrichment in metabolic ontologies. H. Volcano plot of mRNAs differentially expressed in the granular layer in mutant Atp7aflx/Y :: Vil1Cre/+ mice vs control. Yellow symbols mark genes with increased expression in the granular layer in mutant Atp7aflx/Y :: Vil1Cre/+ mice. See Extended Data File 2 for raw data.
Figure 6–3.
Figure 6–3.. Respiratory complex subunit gene expression in a presymptomatic Menkes mouse model.
A. Hierarchical clustering of all transcripts annotated to electron transport chain subunits according to MitoCarta 3.0 across genotypes and AOIs quantified. B. Principal component 1 of data presented in A for the Purkinje layer. Permutation t test. See Extended Data File 2 for raw data.
Figure 7–1.
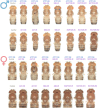
Figure 7–1.. mTOR-Raptor-S6K pathway loss-of-function enhances copper-depletion phenotypes in Drosophila epidermis.
Expression of wild type ATP7 and/or wild type or RNAi of different components of the mTOR pathway in the epidermis of the thoracic segment using the pnr-GAL4 driver in males and females (see Table 3 and Methods). Arrowheads point to ‘dimples’ in the dorsal aspect of ATP7-OE; S6K-IR males.
Figure 1.
Figure 1.. CTR1 (SLC31A1) null mutation disrupts electron transport chain assembly and function and increases glycolysis.
A. Immunoblot of cellular extracts from wild-type (lane 1) and two independent SLC31A1Δ/Δ mutant (CTR1 KO, lanes 2–3) SH-SY5Y cell clones probed for CTR1 and DBH with beta-actin as a loading control. B. 63Cu quantification in whole cells or mitochondria in CTR1 KO cells treated with vehicle or 1 nM elesclomol, normalized to 32S. Italicized numbers represent q values (One-Way ANOVA, followed by Benjamini, Krieger, and Yekutieli multiple comparisons correction). C. Immunoblot with OxPhos antibody mix in mitochondrial fractions from wild-type and CTR1 KO cells. Complex II was used as a loading control as it does not form respiratory supercomplexes (Iverson et al., 2023). (Each dot is an independent biological replicate. Italicized numbers represent p values analyzed by two-sided permutation t-test.) D. Blue native electrophoresis of mitochondrial fractions from wild-type and CTR1 KO cells (Clone KO3) solubilized in either DDM or digitonin to preserve or dissolve supercomplexes, respectively (Wittig et al., 2006; Timón-Gómez et al., 2020). Shown are native gel immunoblots probed with antibodies against Complex, I, II, III, and IV. Italicized numbers represent p values. Complex II was used as a loading control. Immunoblots were also prepared with CTR1 clone KO20 (not shown). E-G. Seahorse stress tests in wild-type and CTR1 KO cells. Arrows indicate the sequential addition of oligomycin (a), FCCP (b), and rotenone-antimycin (c) in the Mito Stress Test (E) to cells treated with vehicle, 1 nM elesclomol, or 200 μM BCS for 72 hours (E, F, BCS n =3, all other treatments n=6–7) or the addition of glucose (a), oligomycin (b), and 2-Deoxy-D-glucose (c) in the Glycolysis Stress Test (G, n=3). Basal cellular respiration and glycolysis were measured for 90 min after additions using Seahorse. E,F. Mito Stress Test data are presented normalized to basal respiration of wild-type cells in the absence of drug, analyzed by a One-Way ANOVA followed by Benjamini, Krieger, and Yekutieli multiple comparisons correction (italics show q values). CTR1 clone KO20 was used. G. Glycolysis Stress Test data are presented normalized to protein, analyzed by two-sided permutation t-test (italicized numbers represent p values). All data are presented as average ± SEM.
Figure 2.
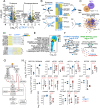
Figure 2.. CTR1 mutant proteome and phosphoproteome have increased activation of mTOR-Raptor-S6K signaling and protein synthesis pathways.
A. Volcano plots of the CTR1 KO cell proteome and phosphoproteome (TMT1), where yellow dots represent proteins or phosphoproteins whose expression is increased in KO cells and blue dots represent decreased expression in KO cells. n=4 for wild type cells and n=4 for KO cells in two independent clones (KO3 and KO11). B. Principle component analysis (PCA) of the whole proteome and phosphoproteome from wild type (gray) and two CTR1 KO clonal lines (blue symbols). Hierarchical clustering and PCA of all proteome or phosphoproteome hits where differential expression is significant with q<0.05 and a fold of change of 1.5 (t-test followed by Benjamini-Hochberg FDR correction). C. Replication TMT Proteome (TMT2) in independent CTR1 KO clone experiment (KO3 and KO20), Venn diagram overlap p value calculated with a hypergeometric test. Merged protein-protein interaction network of both TMT experiments is enriched in the GO term GO:0006091 generation of precursor metabolites and energy. D. TMT proteome levels of Complex IV subunits and assembly factors expressed as Z-score from TMT2. All 16 proteins changed more than 1.5-fold as compared to wild type cells with a q<0.05. E. Gene ontology analysis of differentially expressed proteins or phosphopeptides in CTR1 mutant proteome and phosphoproteome (TMT1). The Bioplanet database were queried with the ENRICHR engine. Fisher exact test followed by Benjamini-Hochberg correction. F. Metascape analysis of the proteome and phosphoproteome (TMT1). Ontology enrichment analysis was applied to a protein-protein interaction network of all components to select molecular complexes with MCODE based on significant ontologies. G. mTOR signaling pathway diagram modified from KEGG map04150. H. Mass spectrometry quantification of ontologically selected proteins and phosphopeptides (TMT1). Proteins are shown with blue circles and phosphopeptides are shown with red squares. Vertical numbers represent q values. See Extended Data File 1 for source data.
Figure 3.
Figure 3.. Increased activity of the mTOR-S6K pathway in CTR1 KO cells.
A. Immunoblots of whole-cell extracts from wild-type and CTR1 mutant cells probed for ATP7A, COX17, CCS, DEPTOR, RAPTOR, RICTOR, and EIF2AK3 with actin as a loading control. Immunoblots were quantified by normalizing protein abundance to wild-type cells. Italicized numbers represent p values analyzed by two-sided permutation t-test. B,C. Immunoblots with antibodies detecting either phosphorylated or total mTOR or S6K as loading controls after overnight depletion of fetal bovine serum followed by serum addition for 0.5–2 hours (B, top) or at time 0 followed removal of fetal bovine serum for 2–6 hours (C, bottom). Graphs depict quantitation of blots on the left in 3–6 independent replicates as the ratio of the phosphorylated to total protein content, normalized to control at time 0 (C) or time at 2 hours (B) (Two-Way ANOVA followed by Benjamini, Krieger, and Yekutiel corrections).
Figure 4.
Figure 4.. CTR1 knockout increases susceptibility to mTOR inhibition.
A. Cell survival analysis of CTR1 mutants with increasing concentrations of serum or insulin (average ± SEM, n = 7 for serum and 5 for insulin, two-way ANOVA followed by Benjamini, Krieger, and Yekutieli corrections). B-G. Synergy analysis of cell survival of CTR1 mutants treated with increasing concentrations of combinations of the compounds serum, rapamycin, Torin-2, BCS, and elesclomol. B. Cell survival map for cells treated with serum and rapamycin, with the corresponding interaction synergy map calculated using the Zero Interaction Potency (ZIP) score for cell survival (Yadav et al., 2015) (D). C-G. Scores below −10 indicate an antagonistic interaction between the compounds. Maps were generated with at least six independent experiments per pair that generated percent cell survival maps presented in Extended Data Fig. 4-1 and average ZIP score for drug interactions in C or weighted ZIP score in E (see Methods). Average ± SEM, two-sided permutation t-test. E-G. Synergy analysis of CTR1 mutants with increasing concentrations of Torin-2 and elesclomol, with different colors and symbols indicating increasing concentrations of elesclomol (F) with average weighted ZIP score (E, two-sided permutation t-test) and elesclomol ZIP interaction synergy map (G).
Figure 5.
Figure 5.. CTR1 mutant cells are resistant to protein synthesis inhibition.
A. Immunoblot for puromycin in wild-type (lanes 1 and 2) and CTR1 mutant cells (lanes 3 and 4) treated with either vehicle (lanes 1 and 3) or 240 nM emetine (lanes 2 and 4) for 24 hours, followed by a 30 min pulse of puromycin. Quantification of the puromycin signal between 250 and 15 kDa normalized to HSP90. One-Way ANOVA, followed by Holm-Šídák’s multiple comparisons test. CTR1 clone KO20 was used for all experiments. B-D. Resipher respiration rates in wild type and CTR1 KO cells. Cells were grown in complete 10% serum media unless otherwise specified. Cells were incubated for 48h, followed by serum depletion (B, serum 0.16%), vehicle (C, DMSO), or emetine (D, 60 or 240 nM) for 24h. B-D. Assay was terminated at 72 h by the addition of rotenone plus antimycin (R+A). Columns 1 and 2 represent raw or normalized OCR, respectively, presented as OCR over time or the integrated area under the curve (AUC) for the indicated time periods. Each dot depicts a batch of concurrent experiments (n=4–7 per genotype for each experiment, average ± SEM, two-sided permutation t-test).
Figure 6.
Figure 6.. Transcriptome of cerebellar cortex layers in a presymptomatic Menkes mouse model.
A. Sagittal sections of control and Atp7aflx/Y :: Vil1Cre/+ mutants at day 10 stained with Syto83 and GFAP to distinguish cerebellar layers. B. ROIs corresponding to the two AOIs analyzed: the GFAP-negative Purkinje cell layer AOI and the GFAP-positive granular layer AOI. C. Normalized mRNA counts for the Purkinje cell markers Calb1 and Pcp2 in the Purkinje and granular layer AOIs. D. Normalized mRNA counts for insulin and mTOR-S6 kinase related genes. Blue denotes mutant. n = 16 control AOIs and 13 mutant Atp7aflx/Y :: Vil1Cre/+ AOIs, 4 animals of each genotype. E. Abundance of Igf1r protein and p-Igf1r (Tyr1135/Tyr1136) as measured by LFQ-MS or Luminex, respectively. Box plots are all two-sided permutation t-tests. F. Volcano plot of mRNAs differentially expressed in mutant Atp7aflx/Y :: Vil1Cre/+ Purkinje neurons vs control. Yellow symbols mark genes with increased expression in mutant Atp7aflx/Y :: Vil1Cre/+ Purkinje cells. G. Gene Set Enrichment Analysis and normalized enrichment score (NES) of genes differentially expressed by comparing controls to mutant Atp7aflx/Y :: Vil1Cre/+ Purkinje cells. Gene sets enriched in mutants correspond to negative NES. p values are corrected. See Extended Data File 2 for raw data
Fig. 7.
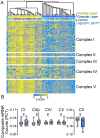
Fig. 7.. mTOR-dependent protein synthesis pathways ameliorate copper-depletion phenotypes in sensory neurons.
Table 3 and Methods.) Scale bar: 100 μm. Right panel depicts 400 μM circle used to distinguish proximal and distal dendrites (see Methods). B. Quantitative analysis of dendritic parameters in the specified genotypes: average branch length for the entire dendritic arbor or for the region distal to the soma (see Methods), dendritic field coverage, and total dendritic length. Each dot represents an independent animal. Average ± SEM. Italicized numbers represent q values (One-Way ANOVA, followed by Benjamini, Krieger, and Yekutieli multiple comparisons correction). C. Representative live confocal images of C-IV da neurons of the specified genotypes expressing a mitochondria-targeted GFP that were manually traced using a plasma membrane marker (CD4-tdTomato, not shown). Scale bar: 5 μm.

Similar articles

References

    1. Acosta-Jaquez HA, Keller JA, Foster KG, Ekim B, Soliman GA, Feener EP, Ballif BA, Fingar DC (2009) Site-specific mTOR phosphorylation promotes mTORC1-mediated signaling and cell growth. Mol Cell Biol 29:4308–4324. - PMC - PubMed
    1. Almeida LM, Pinho BR, Duchen MR, Oliveira JMA (2022) The PERKs of mitochondria protection during stress: insights for PERK modulation in neurodegenerative and metabolic diseases. Biol Rev Camb Philos Soc 97:1737–1748. - PubMed
    1. Arshadi C, Günther U, Eddison M, Harrington KIS, Ferreira TA (2021) SNT: a unifying toolbox for quantification of neuronal anatomy. Nat Methods 18:374–377. - PubMed
    1. Atkinson DE, Walton GM (1967) Adenosine triphosphate conservation in metabolic regulation. Rat liver citrate cleavage enzyme. J Biol Chem 242:3239–3241. - PubMed
    1. Ballou LM, Lin RZ (2008) Rapamycin and mTOR kinase inhibitors. J Chem Biol 1:27–36. - PMC - PubMed

Publication types