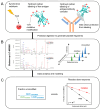
Residue-Specific Epitope Mapping of the PD-1/Nivolumab Interaction Using X-ray Footprinting Mass Spectrometry
- PMID: 39311382
- PMCID: PMC11417893
- DOI: 10.3390/antib13030077
Residue-Specific Epitope Mapping of the PD-1/Nivolumab Interaction Using X-ray Footprinting Mass Spectrometry
Abstract
X-ray footprinting coupled with mass spectrometry (XFMS) presents a novel approach in structural biology, offering insights into protein conformation and dynamics in the solution state. The interaction of the cancer-immunotherapy monoclonal antibody nivolumab with its antigen target PD-1 was used to showcase the utility of XFMS against the previously published crystal structure of the complex. Changes in side-chain solvent accessibility, as determined by the oxidative footprint of free PD-1 versus PD-1 bound to nivolumab, agree with the binding interface side-chain interactions reported from the crystal structure of the complex. The N-linked glycosylation sites of PD-1 were confirmed through an LC-MS/MS-based deglycosylation analysis of asparagine deamidation. In addition, subtle changes in side-chain solvent accessibility were observed in the C'D loop region of PD-1 upon complex formation with nivolumab.
Keywords: ICI; PD-1; X-ray footprinting mass spectrometry (XFMS); epitope mapping; hydroxyl radical footprinting; nivolumab; programmed cell death protein 1.
Conflict of interest statement
The authors declare no conflicts of interest.
Figures


Similar articles
-
Epitope and Paratope Mapping of PD-1/Nivolumab by Mass Spectrometry-Based Hydrogen-Deuterium Exchange, Cross-linking, and Molecular Docking.Anal Chem. 2020 Jul 7;92(13):9086-9094. doi: 10.1021/acs.analchem.0c01291. Epub 2020 Jun 10. Anal Chem. 2020. PMID: 32441507 Free PMC article.
-
Hydroxyl radical mediated damage of proteins in low oxygen solution investigated using X-ray footprinting mass spectrometry.J Synchrotron Radiat. 2021 Sep 1;28(Pt 5):1333-1342. doi: 10.1107/S1600577521004744. Epub 2021 Jul 20. J Synchrotron Radiat. 2021. PMID: 34475282 Free PMC article.
-
Mass Spectrometry-Based Fast Photochemical Oxidation of Proteins (FPOP) for Higher Order Structure Characterization.Acc Chem Res. 2018 Mar 20;51(3):736-744. doi: 10.1021/acs.accounts.7b00593. Epub 2018 Feb 16. Acc Chem Res. 2018. PMID: 29450991 Free PMC article. Review.
-
Study of the interactions of a novel monoclonal antibody, mAb059c, with the hPD-1 receptor.Sci Rep. 2019 Nov 28;9(1):17830. doi: 10.1038/s41598-019-54231-w. Sci Rep. 2019. PMID: 31780710 Free PMC article.
-
Using X-ray Footprinting and Mass Spectrometry to Study the Structure and Function of Membrane Proteins.Protein Pept Lett. 2019;26(1):44-54. doi: 10.2174/0929866526666181128142401. Protein Pept Lett. 2019. PMID: 30484402 Free PMC article. Review.
References
Grants and funding
LinkOut - more resources
Full Text Sources
Research Materials

