. 2024 Sep 3;14(14):5551-5570.
doi: 10.7150/thno.100703. eCollection 2024.

The m6A reader YTHDC2 promotes the pathophysiology of temporal lobe epilepsy by modulating SLC7A11-dependent glutamate dysregulation in astrocytes

Affiliations

The m6A reader YTHDC2 promotes the pathophysiology of temporal lobe epilepsy by modulating SLC7A11-dependent glutamate dysregulation in astrocytes

Kai Zhang et al. Theranostics. .

Abstract

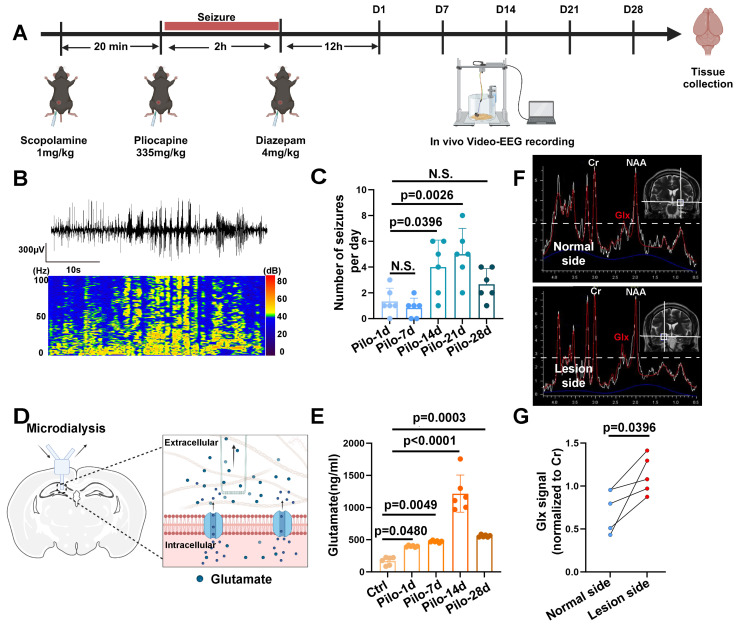
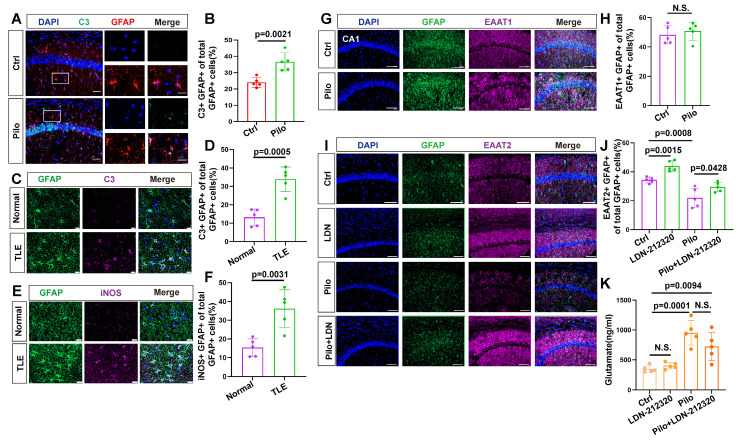
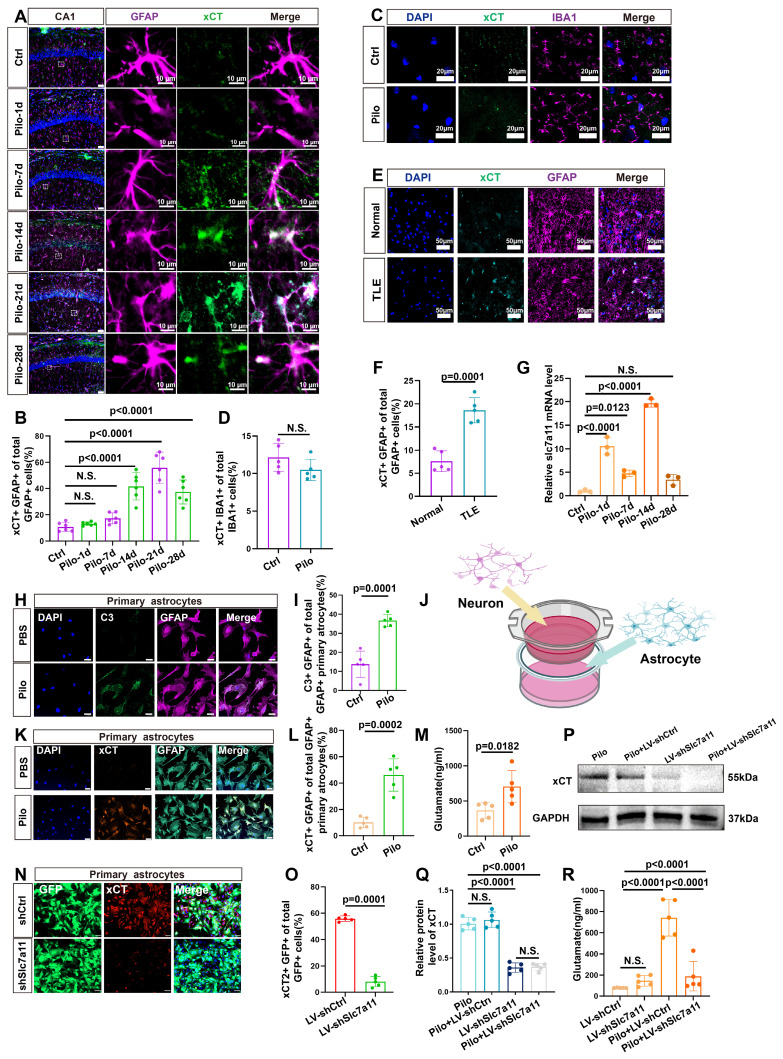
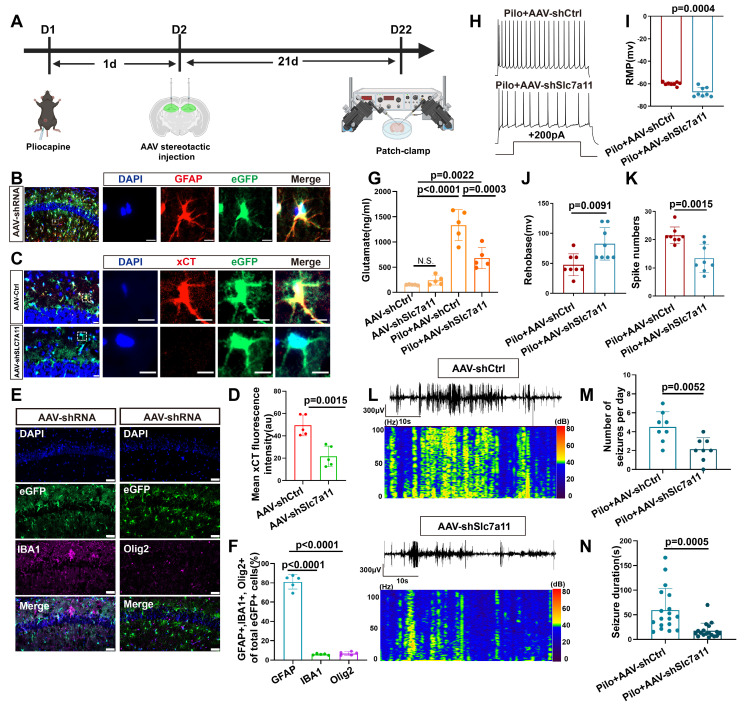
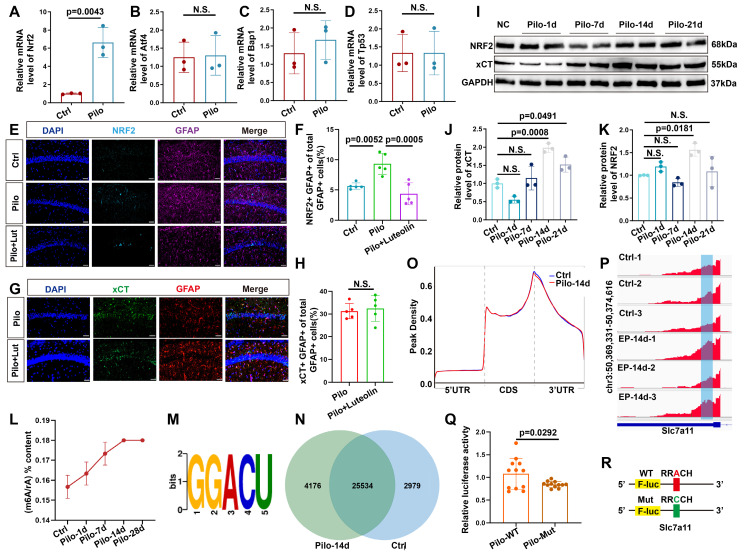
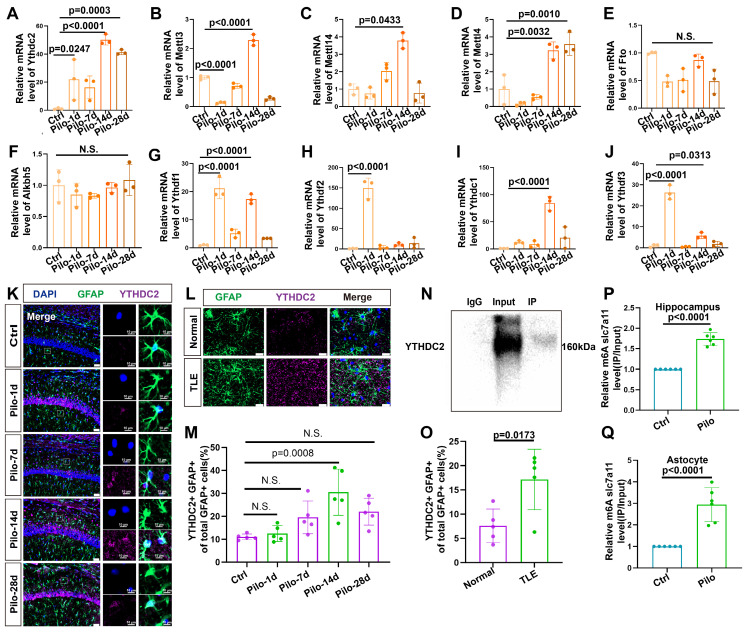
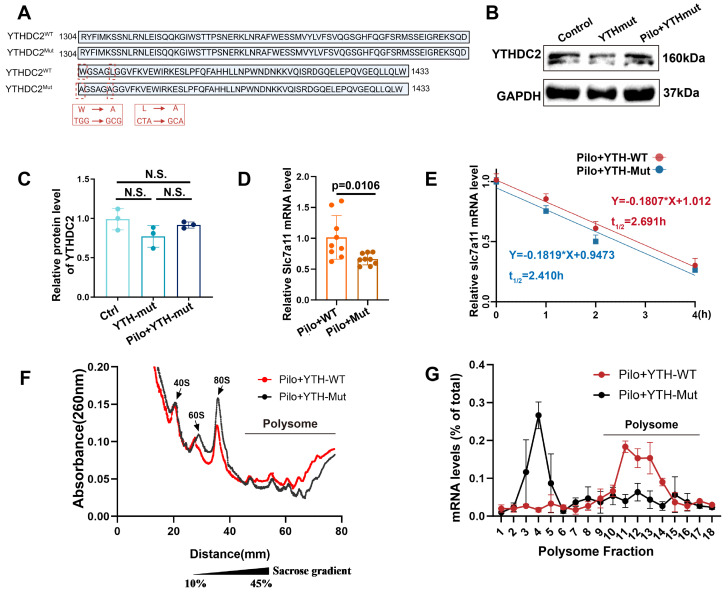
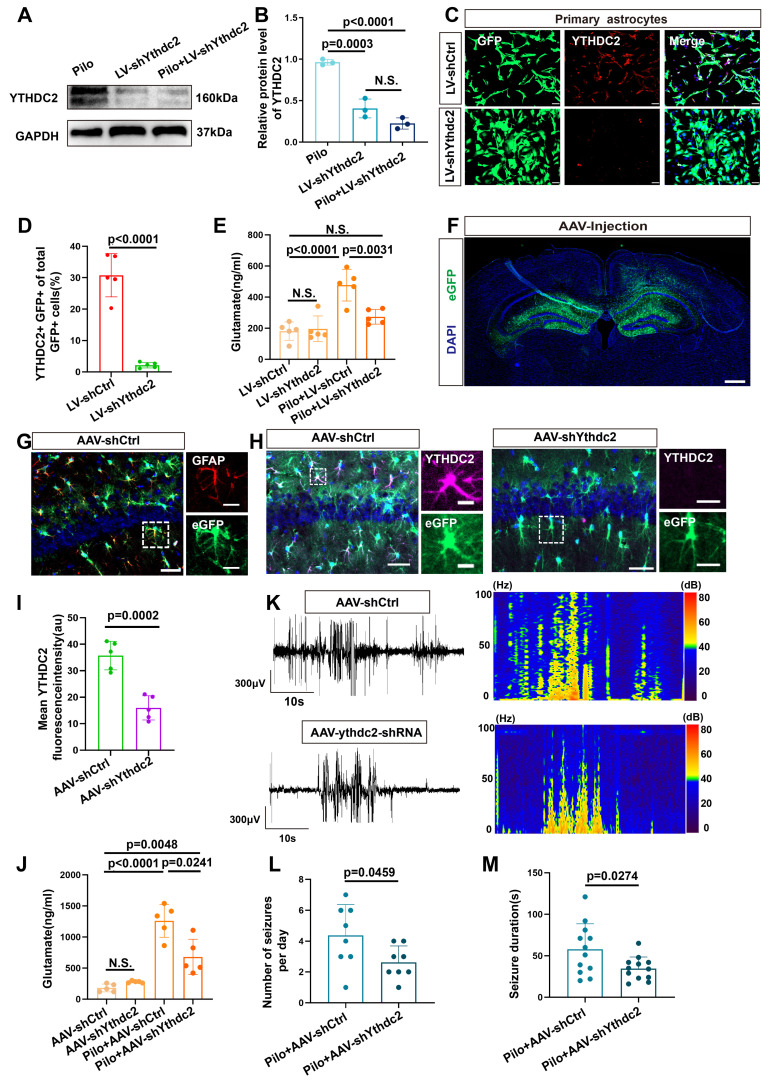
Rationale: Epilepsy affects over 70 million people globally, with temporal lobe epilepsy with hippocampal sclerosis (TLE-HS) often progressing to a drug-resistant state. Recent research has highlighted the role of reactive astrocytes and glutamate dysregulation in epilepsy pathophysiology. This study aims to investigate the involvement of astrocytic xCT, a glutamate-cystine antiporter, and its regulation by the m6A reader protein YTHDC2 in TLE-HS. Methods: A pilocarpine-induced epilepsy model in mice was used to study the role of xCT in reactive astrocytes. The expression of xCT and its regulation by YTHDC2 were assessed through various molecular and cellular techniques. Quantitative real-time polymerase chain reaction (qRT-PCR) and western blotting were used to measure mRNA and protein levels of xCT and YTHDC2, respectively; immunofluorescence was utilized to visualize their localization and expression in astrocytes. In vivo glutamate measurements were conducted using microdialysis to monitor extracellular glutamate levels in the hippocampus. RNA immunoprecipitation-qPCR (RIP-qPCR) was performed to investigate the binding of YTHDC2 to SLC7A11 mRNA, while methylated RNA immunoprecipitation-qPCR (MeRIP-qPCR) was performed to quantify m6A modifications on SLC7A11 mRNA. A dual-luciferase reporter assay was conducted to assess the effect of m6A modifications on SLC7A11 mRNA translation, and polysome profiling was employed to evaluate the translational efficiency of SLC7A11 mRNA. Inhibition experiments involved shRNA-mediated knockdown of SLC7A11 (commonly known as xCT) and YTHDC2 expression in astrocytes. Video-electroencephalogram (EEG) recordings were used to monitor seizure activity in mice. Results: The xCT transporter in reactive astrocytes significantly contributes to elevated extracellular glutamate levels, enhancing neuronal excitability and seizure activity. Increased xCT expression is influenced by the m6A reader protein YTHDC2, which regulates its expression through m6A methylation. Inhibition of xCT or YTHDC2 in astrocytes reduces glutamate levels and effectively controls seizures in a mouse model. Specifically, mice with SLC7A11- or YTHDC2-knockdown astrocytes showed decreased glutamate concentration in the hippocampus and reduced frequency and duration of epileptic seizures. Conclusions: This study highlights the therapeutic potential of targeting YTHDC2 and xCT in reactive astrocytes to mitigate epilepsy. The findings provide a novel perspective on the mechanisms of glutamate dysregulation and their implications in seizure pathophysiology, suggesting that modulation of YTHDC2 and xCT could be a promising strategy for treating TLE.

Keywords: epilepsy; glutamate dysregulation; hippocampal sclerosis; m6A methylation; reactive astrocytes.


Conflict of interest statement

Competing Interests: The authors have declared that no competing interest exists.

Figures

Figure 1
Figure 1
Glutamate dysregulation in patients with TLE and pilocarpine-induced mouse model. (A) Schematic illustration depicting the key steps involved in the pilocarpine-induced mouse model of epilepsy. (B) Representative images from video-electroencephalogram (EEG) recordings showing abnormal electrical discharges in the hippocampus of a pilocarpine-treated mouse brain. (C) Video-EEG recordings demonstrating a significant increase in the frequency of epileptic seizures starting 14 days after successful model induction with pilocarpine (p = 0.0026, n = 6). (D) Schematic illustration of the microdialysis technique used for extracting extracellular fluid from the mouse hippocampus. (E) The concentration of glutamate in the extracellular fluid of the mouse hippocampus increased on the first day after successful model establishment (p = 0.0480, n = 6), with a further, more pronounced increase observed on day 14 (p < 0.0001, n = 6). N.S. means no significant difference. (F) Magnetic resonance spectroscopy (MRS) of a representative patient with temporal lobe epilepsy (TLE) demonstrating Glx peaks in both hippocampi. The blue dashed line indicates the level of glutamate on the normal side. (G) In four patients with TLE, the intensity of the Glx signal was significantly higher on the lesion side compared with the normal side (p = 0.0396, n = 4). For B, C, D and E, data represent the mean ± standard error of the mean (SEM); one-way ANOVA with Bonferroni's post hoc test (B-E), two-sided paired Student's t-tests (F, G).
Figure 2
Figure 2
Immunofluorescence analysis of reactive astrocytes and EAAT expression in TLE. (A, B) Immunofluorescence staining reveals co-staining of astrocytes (identified by GFAP expression) and complement component 3 (c3) in the hippocampal CA1 area of both control and pilocarpine-treated mice (scale bar = 50 μm and 20 μm); Statistical analysis showed a significant increase in the proportion of C3-positive and GFAP-positive cells (activated astrocytes) among the total GFAP-positive cells in the pilocarpine-treated group (p = 0.0021, n = 5). (C, D) Immunofluorescence staining illustrated the expression of C3-positive astrocytes in normal brain tissue and the hippocampus of patients with TLE. A significantly increased proportion of C3-expressing astrocytes was observed in patients with TLE compared to the control group (p = 0.0005, n = 5). Scale bar = 50 μm. (E, F) Immunofluorescence staining displayed the expression of inducible nitric oxide synthase (iNOS) in astrocytes within the hippocampus of patients with TLE and normal brain tissue. The proportion of iNOS-expressing astrocytes was significantly higher in patients with TLE compared with the control group (p = 0.0031, n = 5). Scale bar = 50 μm. (G, H) Immunofluorescence staining of astrocytes within the CA1 area illustrates the expression of excitatory amino acid transporter 1 (EAAT1), a glutamate transporter (scale bar = 100 μm); No significant change was observed in the ratio of astrocytes expressing EAAT1 in the CA1 area of mice between the pilocarpine group and the control group (n = 5). (I-K) Immunofluorescence staining illustrates the expression of EAAT2 in astrocytes within the CA1 area across different treatment groups (scale bar = 100 μm); Compared with the control group, the proportion of EAAT2-positive astrocytes increased in the LDN-21230 treated group (p = 0.0115, n = 5), decreased in the pilocarpine group (p = 0.0008, n = 5), and increased in the group treated with LDN-21230 after pilocarpine compared with the pilocarpine-alone group (p = 0.0428, n = 5); glutamate concentrations in the extracellular fluid extracted by microdialysis from various treatment groups showed a significance increase in the pilocarpine-treated group compared with the control group (p = 0.0001, n = 5), with no significant difference observed after subsequent treatment with LDN-21230. two-sided unpaired Student's t-tests (B, D, F, H), two-way ANOVA with Bonferroni's post hoc test s (J, K).
Figure 3
Figure 3
Expression of xCT in astrocytes and its impact on extracellular glutamate. (A) Immunofluorescence staining demonstrated the co-localization of astrocytes (identified by GFAP expression) and xCT in the CA1 area of mice at various time points following pilocarpine-induced epilepsy modeling (scale bar = 50 μm and 10 μm). (B) Statistical analysis revealed that compared with the control group, the proportion of astrocytes co-expressing xCT in the CA1 area did not significantly increase 1 or 7 days after epilepsy modeling. However, a marked increase was observed by day 14, 21 and 28 (p < 0.0001, n = 6). (C) Immunofluorescence staining displayed co-localization of microglia (IBA1-positive) and xCT in mice treated with pilocarpine compared with the control group (scale bar = 20 μm). (D) The proportion of microglia expressing xCT showed no significant difference between the pilocarpine-treated mice and the control group (n = 5). (E) Immunofluorescence staining displayed the co-localization of astrocytes and xCT in the hippocampus of patients with TLE and normal brain tissue (scale bar = 50 μm). (F) The proportion of astrocytes expressing xCT in the hippocampal tissue of patients with TLE significantly increased compared with the control group (p = 0.0001, n = 5). (G) Quantitative real-time polymerase chain reaction (qPCR) results indicated a significant increase in SLC7A11 mRNA expression (encoding xCT) 14 days after epilepsy modeling compared with the control group (p < 0.0001, n = 3). (H) Immunofluorescence staining of primary astrocytes demonstrates the expression of C3 in both control and pilocarpine-treated neurons co-culture groups (scale bar = 50 μm). (I) The proportion of primary astrocytes expressing C3 increased significantly in the pilocarpine-treated group compared with the control group (p = 0.0001, n = 5). (J) Schematic diagram of neuron-astrocyte co-culture. (K) Immunofluorescence of primary astrocytes showed the expression of xCT in both control and pilocarpine-treated groups (scale bar = 50 μm). (L) The proportion of primary astrocytes expressing xCT increased in the pilocarpine-treated group (p = 0.0002, n = 5). (M) Glutamate concentrations in the extracellular fluid of primary astrocytes from various treatment groups revealed an increase in the pilocarpine-treated group compared with the control group (p = 0.0182, n = 5). (N, O) Immunofluorescence staining showed the effect of SLC7A11 knockdown using short hairpin RNA (shRNA) carried by a lentivirus expressing green fluorescent protein (GFP) (p = 0.0001, n = 5). (scale bar = 50 μm). (P, Q) Western blot analysis revealed the expression levels of xCT protein in different groups after knockdown. Following the SLC7A11 knockdown, the relative expression level of xCT protein decreased compared with the control group (p = 0.0001, n = 5), with no significant change observed after pilocarpine treatment. N.S. means no significance. (R) The concentration of glutamate in the extracellular fluid of primary astrocytes significantly decreased in the SLC7A11 knockdown group compared with the vector control group (p < 0.0001, n = 5). N.S. means no significance; two-sided unpaired Student's t-tests (D, F, I, L M, O), one-way ANOVA with Bonferroni's post hoc test (B, G, Q, R).
Figure 4
Figure 4
Targeted knockdown of SLC7A11 in astrocytes reduces xCT expression and seizure activity in a mouse model of epilepsy. (A) Schematic illustration of bilateral hippocampal injection in mice with adeno-associated virus 9 (AAV9) carrying eGFP to knockdown SLC7A11. (B) Immunofluorescence staining revealed the expression of eGFP in astrocytes within the CA1 area of the mouse hippocampus, scale bar = 50 μm and 5 μm; (C, D) Immunofluorescence staining demonstrates a significant decrease in xCT protein fluorescence intensity in the SLC7A11 knockdown group compared with the control group (p = 0.015, n = 5), indicating reduced xCT expression in astrocytes (scale bar = 20 μm and 5 μm). (E, F) Immunofluorescence staining for eGFP-positive cells co-stained with IBA1 (marker for microglia) and OLIG2 (marker for oligodendrocytes) revealed that most eGFP-positive cells co-localize with GFAP (marker for astrocytes), with only a minority co-staining with IBA1 (p < 0.0001, n = 5) or OLIG2 (p < 0.0001, n = 5), indicating predominant astrocyte targeting (scale bar = 50 μm). (G) Changes in glutamate concentration in the hippocampal extracellular fluid show a significant reduction in the SLC7A11 knockdown group compared with the vector control group (p = 0.0003, n = 5). (H) Whole-cell patch-clamp recordings of hippocampal neuronal activity in epileptic mice treated with AAV carrying control shRNA (AAV-ctrl-shRNA, n = 8) and AAV carrying SLC7A11 shRNA, n = 8). (I-K) Measurements of resting membrane potential (RMP) and rheobase indicate altered excitability levels in neurons. The SLC7A11 knockdown group shows a lower RMP compared with the vector control (p = 0.0004, n = 8), higher rheobase (p = 0.0091, n = 8), and fewer action potentials (spikes) fired (p = 0.0015, n = 8). (L-N) Representative EEG graphs for the SLC7A11 knockdown and vector control groups show that SLC7A11 knockdown reduces the average number of seizures per day (p = 0.0052, n = 8) and shortens seizure duration (p = 0.0005, n = 18), indicating a potential therapeutic effect against epilepsy. Two-sided unpaired Student's t-tests (D, I, J, K, M, N), one-way ANOVA with Bonferroni's post hoc test (F), and two-way ANOVA with Bonferroni's post hoc test (G).
Figure 5
Figure 5
m6A methylation dynamics and its impact on SLC7A11 expression in epileptic mouse hippocampus. (A-D) Quantitative real-time polymerase chain reaction (qPCR) analysis revealed the relative expression of four transcription factors upstream of SLC7A11 in various groups of hippocampal tissues. NRF2 expression was significantly increased in the pilocarpine-treated group compared to the control group (p = 0.0043, n = 3). No statistically significant differences were observed in the expression of other transcription factors (n = 3). (E, F) Immunofluorescence analysis of astrocytes co-stained with NRF2 in the CA1 region of mice across different groups revealed an increase in the proportion of NRF2-positive astrocytes in the pilocarpine-treated mice compared with the control group (p = 0.0052, n = 5). Treatment with luteolin, an NRF2 inhibitor, resulted in a reduction of NRF2 expression (p = 0.0005, n = 5). Scale bar = 50 μm. (G, H) Immunofluorescence staining for xCT in astrocytes showed no significant difference between the pilocarpine and pilocarpine followed by luteolin treatment groups (n = 5). Scale bar = 50 μm. (I-K) Western blot analysis of the relative expression levels of NRF2 and xCT proteins at various time points showed an increase in NRF2 expression at 14 days (p = 0.0181, n = 3) and an increase in xCT expression after 14 days (p = 0.0008, n = 3). N.S. indicates no significance. (L) Liquid chromatography-mass spectrometry (LC/MS) was utilized to assess the degree of m6A methylation in mouse hippocampal tissue at various time points after pilocarpine injection (n = 3). (M) Using the Homer database, a common sequence motif was identified within the significantly differentially enriched m6A binding sites. (N) A Venn diagram illustrates the number of m6A methylated mRNAs in the control group compared with 14 days after epilepsy modeling. (O) In the control group and 14 days post-pilocarpine modeling, a metagene profile of significantly differentially enriched m6A methylation modification binding sites along normalized transcripts was generated. The profile is composed of three readjusted, non-overlapping segments: 5' untranslated region (5'UTR), coding sequence (CDS), and 3' untranslated region (3'UTR) (n = 3). (P) Integrative Genomics Viewer (IGV) tracks displayed MeRIP-seq read distribution along the CDS and 3'UTR of SLC7A11 mRNA. (Q, R) Schematic representation of wild-type or mutant m6A sites (adenine to cytosine mutation) in SLC7A11, fused with a dual-luciferase reporter gene. After transfecting primary astrocytes with wild-type or mutant SLC7A11 plasmids and stimulating with pilocarpine, the mutant group showed a decrease in luciferase intensity (p = 0.0292, n = 12). Two-sided unpaired Student's t-tests (A-D, H, Q), one-way ANOVA with Bonferroni's post hoc test (F), Kruskal-Wallis H test (J, K).
Figure 6
Figure 6
Upregulation of YTHDC2 in astrocytes following pilocarpine-induced epilepsy in mice. (A-J) Quantitative real-time polymerase chain reaction (qPCR) results revealed no significant changes in the relative mRNA expression levels of key m6A-related proteins at different time points (n = 3). N.S. means no significance. (K, M) Immunofluorescence staining revealed the expression of YTHDC2 in astrocytes within the mouse hippocampus at various time points following pilocarpine-induced epilepsy modeling. A significant increase in YTHDC2 expression was observed on day 14 compared with the control group (p = 0.0008, n = 5). Scale bar = 50 μm and 10 μm. (L, O) Immunofluorescence staining showed the expression of YTHDC2-positive astrocytes in normal brain tissue and the hippocampus of patients with TLE. The proportion of YTHDC2-expressing astrocytes was significantly higher in patients with TLE compared to the control group (p = 0.0173, n = 5). Scale bar = 50 μm. (N, P, Q) Representative western blot image from a YTHDC2-RNA immunoprecipitation (RIP) assay; Significant increases were observed in the binding of YTHDC2 to SLC7A11 mRNA in both the hippocampus of mice treated with pilocarpine (p < 0.0001, n = 6) and primary astrocytes co-culture with pilocarpine treated neurons (p < 0.0001, n = 6) compared with the control group. N.S. means no significance; one-way ANOVA with Bonferroni's post hoc test (A-J, M), two-sided unpaired Student's t-tests (O, P, Q).
Figure 7
Figure 7
YTHDC2 mediates increased xCT expression by increasing SLC7A11 mRNA translation efficiency. (A) The YTH domain of the YTHDC2-Mut allele (indicated by the red dashed line, required for m6A interaction) exhibits changes in nucleotides and amino acids compared with the wild-type sequence. (B, C) Western blot analysis showed no significant differences in YTHDC2 expression among various groups of in vitro astrocytes (n = 3). (D) Quantitative real-time polymerase chain reaction (qPCR) revealed a significant decrease in the relative expression of SLC7A11 mRNA in primary astrocytes treated with pilocarpine in the YTH-Mut group compared to the YTH-WT group (p = 0.0106, n = 8). (E) YTH-WT and YTH-Mut astrocytes were treated with actinomycin D (ActD, 5 μg/mL) for specified durations. The expression of SLC7A11 mRNA was examined through qRT-PCR (n = 3). (F, G) Sucrose gradient-based polysome profiling was performed on YTH-WT and YTH-Mut astrocytes. The quantification of SLC7A11 mRNA in each ribosomal fraction was performed by qRT-PCR and plotted as a percentage of the total (n = 3). N.S. indicates no significance; Kruskal-Wallis H test (C), two-sided unpaired Student's t-tests (D).
Figure 8
Figure 8
Reduction of YTHDC2 expression in astrocytes decreases extracellular glutamate levels and seizure activity in a mouse model of epilepsy. (A, B) Western blot analysis revealed the expression levels of YTHDC2 protein in various groups of in vitro astrocytes. The YTHDC2 knockdown group showed a reduced relative expression of YTHDC2 protein compared with the control group (p = 0.0003, n = 3). After stimulation with pilocarpine, the relative expression of YTHDC2 showed no significant difference compared to the knockdown group alone (n = 3). (C, D) Immunofluorescence staining demonstrated the knockdown of YTHDC2 using shRNA carried by a lentivirus expressing GFP (p < 0.0001, n = 5), scale bar = 50 μm. (e) In vitro measurement of glutamate concentration showed a significant decrease in the YTHDC2 knockdown group compared with the vector control group (p = 0.0031, n = 5). (F) Representative image of eGFP expression 21 days post bilateral hippocampal injection of AAV, scale bar = 500 μm. (G) Immunofluorescence staining revealed the expression of eGFP in astrocytes within the CA1 area of the mouse hippocampus (scale bar = 50 μm and 5 μm). (H, I) Immunofluorescence staining showed a significant decrease in YTHDC2 protein expression in astrocytes of the YTHDC2 knockdown group compared with the control group (p = 0.002, n = 5), scale bar = 50 μm and 5 μm. (J) The concentration of glutamate in the extracellular fluid of the hippocampus across different treatment groups showed a significant decrease in the YTHDC2 knockdown group compared with the vector group after pilocarpine treatment (p = 0.0241, n = 5). (K-M) Representative EEG graphs for the YTHDC2 knockdown and vector control groups showed a decrease in the average number of seizures per day (p = 0.0459, n = 8) and a shortening of seizure duration in the YTHDC2 knockdown group (p = 0.0274, n = 12). N.S. means no significance; Kruskal-Wallis H test (B), two-sided unpaired Student's t-tests (D, I, L, M), two-way ANOVA with Bonferroni's post hoc test (E, J).

Similar articles

References

    1. Thijs RD, Surges R, O'Brien TJ, Sander JW. Epilepsy in adults. Lancet. 2019;393:689–701. - PubMed
    1. Asadi-Pooya AA, Brigo F, Lattanzi S, Blumcke I. Adult epilepsy. Lancet. 2023;402:412–424. - PubMed
    1. Perucca E, Perucca P, White HS, Wirrell EC. Drug resistance in epilepsy. Lancet Neurol. 2023;22:723–734. - PubMed
    1. Löscher W, Potschka H, Sisodiya SM, Vezzani A. Drug resistance in epilepsy: clinical impact, potential mechanisms, and new innovative treatment options. Pharmacol Rev. 2020;72:606–638. - PMC - PubMed
    1. Ammothumkandy A, Ravina K, Wolseley V, Tartt AN, Yu PN, Corona L. et al. Altered adult neurogenesis and gliogenesis in patients with mesial temporal lobe epilepsy. Nat Neurosci. 2022;25:493–503. - PMC - PubMed

LinkOut - more resources