. 2024 Sep;14(9):4118-4133.
doi: 10.1016/j.apsb.2024.05.030. Epub 2024 Jun 3.

Transferrin receptor-targeted immunostimulant for photodynamic immunotherapy against metastatic tumors through β-catenin/CREB interruption

Affiliations

Transferrin receptor-targeted immunostimulant for photodynamic immunotherapy against metastatic tumors through β-catenin/CREB interruption

Mengyi Yan et al. Acta Pharm Sin B. 2024 Sep.

Abstract

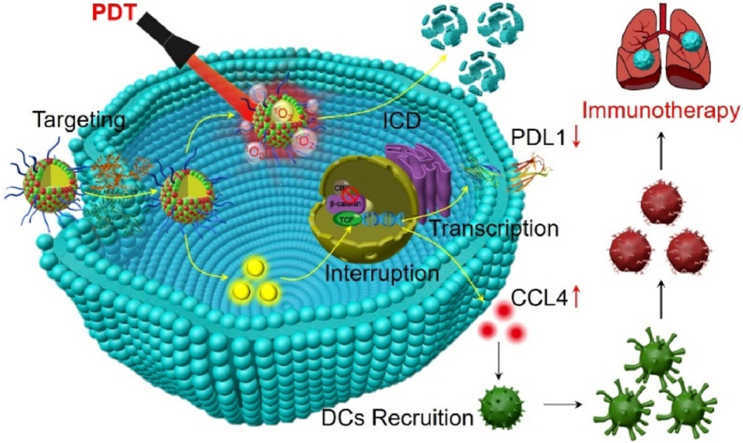
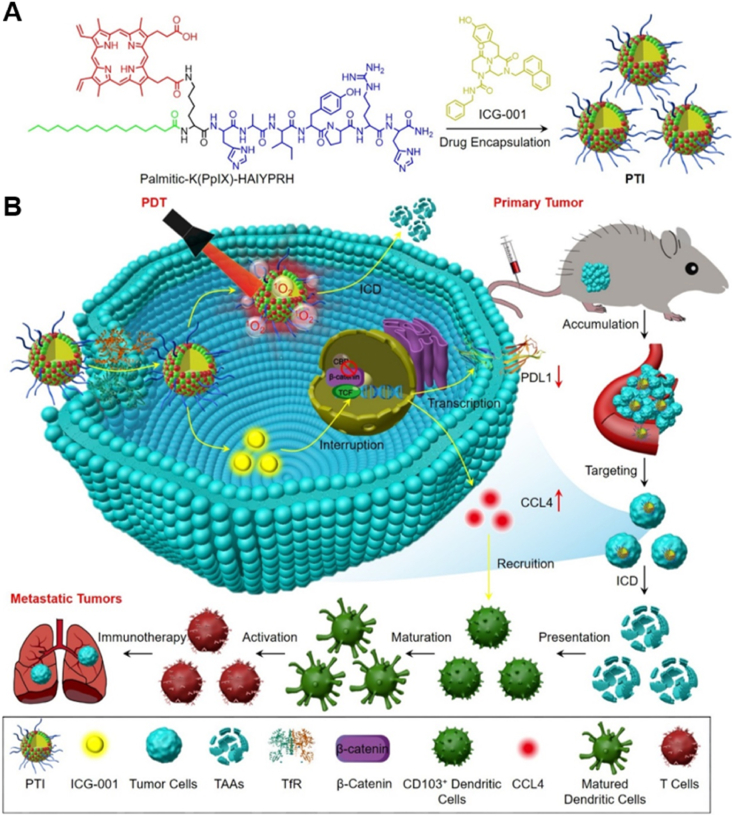
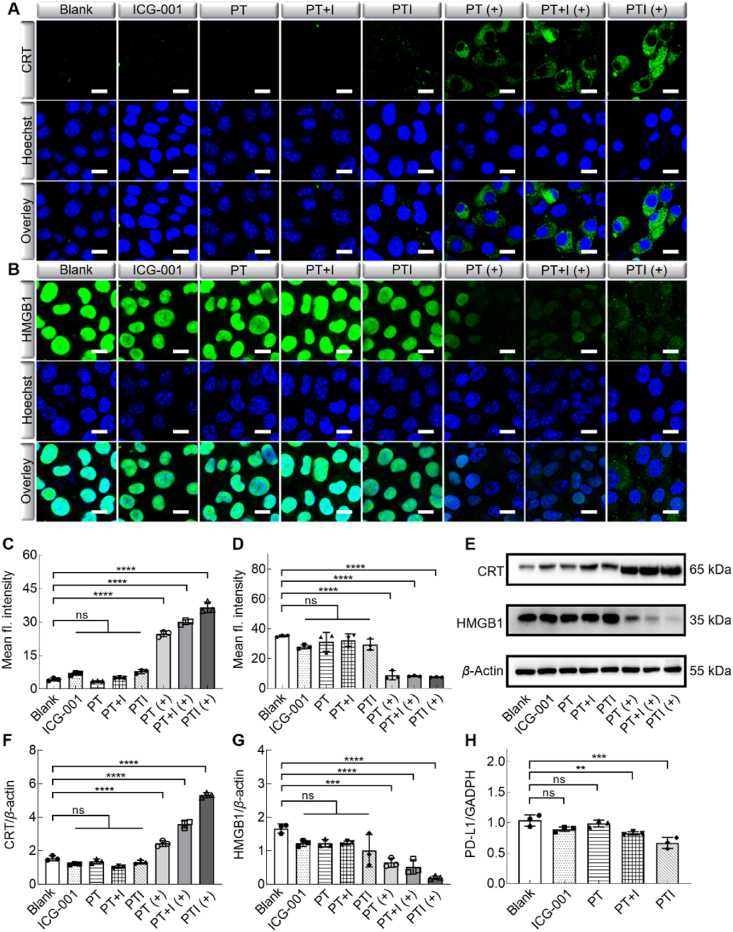
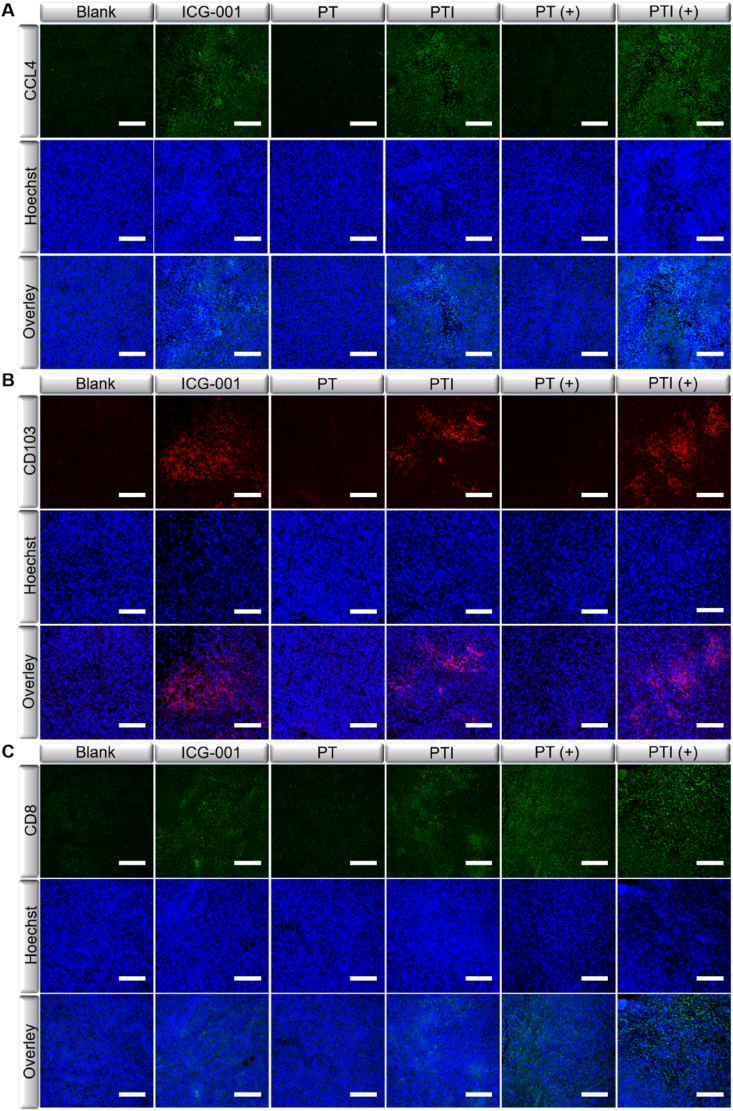
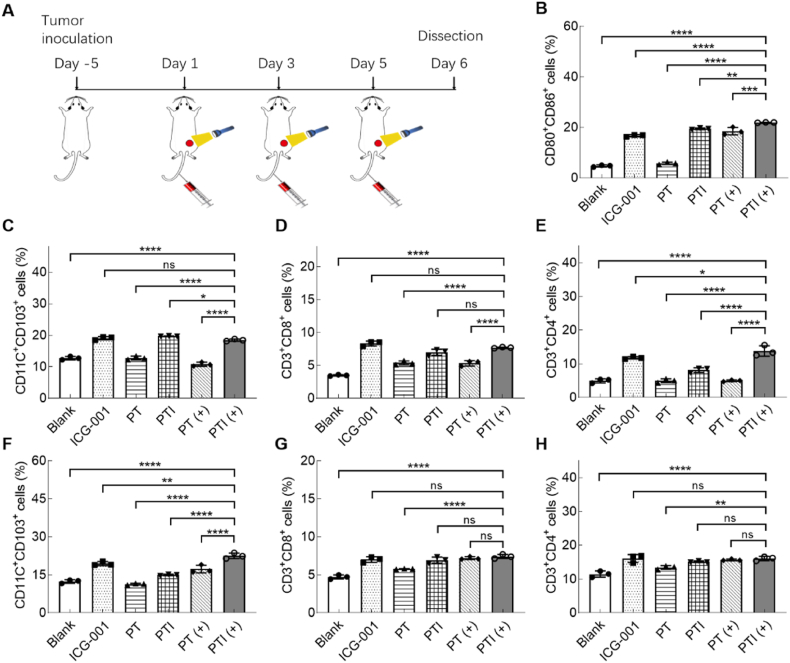
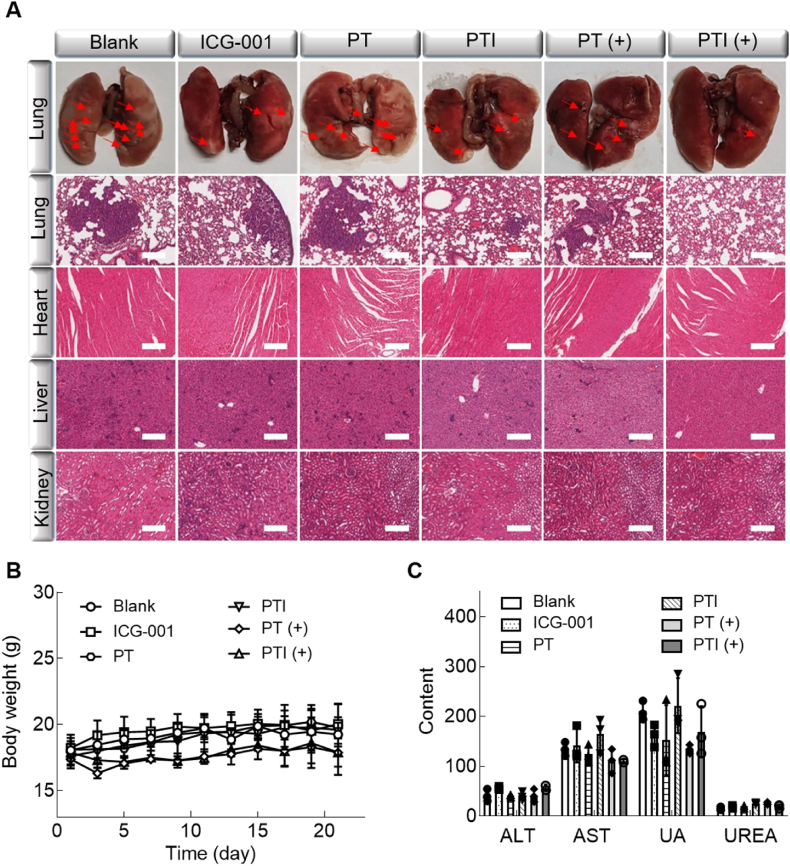
The immunosuppressive phenotype of tumor cells extensively attenuates the immune activation effects of traditional treatments. In this work, a transferrin receptor (TfR) targeted immunostimulant (PTI) is fabricated for photodynamic immunotherapy against metastatic tumors by interrupting β-catenin signal pathway. To synthesize PTI, the photosensitizer conjugated TfR targeting peptide moiety (Palmitic-K(PpIX)-HAIYPRH) is unitized to encapsulate the transcription interrupter of ICG-001. On the one hand, the recognition of PTI and TfR can promote drug delivery into tumor cells to destruct primary tumors through photodynamic therapy and initiate an immunogenic cell death with the release of tumor-associated antigens. On the other hand, PTI will interrupt the binding between β-catenin and cAMP response element-binding protein (CREB), regulating the gene transcription to downregulate programmed death ligand 1 (PD-L1) while upregulating C-C motif chemokine ligand 4 (CCL4). Furthermore, the elevated CCL4 can recruit the dendritic cells to present tumor-specific antigens and promote T cells activation and infiltration, and the downregulated PD-L1 can avoid the immune evasion of tumor cells and activate systemic anti-tumor immunity to eradicate lung metastasis. This work may inspire the development of antibody antibody-free strategy to activate systemic immune response in consideration of immunosuppressive conditions.

Keywords: C–C motif chemokine ligand 4; Immunogenic cell death; Immunotherapy; Photodynamic therapy; Programmed death ligand 1; Transferrin receptor; Tumor targeting; β-Catenin signal pathway.


Conflict of interest statement

The authors have no conflicts of interest to declare.

Figures

Image 1
Graphical abstract
Scheme 1
Scheme 1
Chemical structure and the proposed mechanism of PTI to eradicate metastatic tumors through photodynamic immunotherapy. (A) Chimeric peptide of (Palmitic-K(PpIX)-HAIYPRH) can load ICG-001 to self-assemble into nanomedicine for preparation of PTI; (B) PTI is preferred to accumulate in primary tumor site through TfR mediated tumor targeting drug delivery. In tumor cells, PTI can not only interrupt the β-catenin/CREB recognition and regulate gene transcription to decrease PD-L1 expression and elevate CCL4 expression, but also trigger the release of tumor associated antigens (TAAs) through photodynamic therapy (PDT) induced immunogenic cell death (ICD). The released CCL4 can recruit dendritic cells (DCs), combining with TAAs to accelerate the DCs maturation, T cells activation and infiltration for metastatic tumor eradication.
Figure 1
Figure 1
The characterization and optical properties of PTI. Size distributions (n = 3) and transmission electron microscope (TEM) images of PTI obtained at the ratios of PT to ICG-001 at (A) 10:1, (B) 10:4 and (C) 10:8. Scale bar: 200 nm; Size and PDI changes of PTI in 7 days under the ratios of (D) 10:1, (E) 10:4 and (F) 10:8; (G) The zeta potential of PT, ICG-001 and PTI. (H) UV–Vis spectra of PpIX, ICG-001, PT and PTI in DMSO. (I) 1O2 generation by ICG-001, PT and PTI with or without illumination. Data are presented as mean ± SD (n = 3).
Figure 2
Figure 2
Cell internalization and ROS generation in 4T1 cells. (A) Drug dose and (B) incubation time-dependent uptake behaviors of PT and PTI by 4T1 cells. Flow cytometry analysis of (C) incubation concentration and (D) time-dependent uptake behaviors of 4T1 cells. (E) CLSM images and (F) corresponding fluorescence analysis of 4T1 cells to detect ROS production by DCFH-DA test kit after treated by ICG-001, PT, PTI for 6 h with or without illumination. Scale bar: 10 μm. Data are presented as mean ± SD (n = 3). ∗P < 0.05, ∗∗∗P < 0.001, ∗∗∗∗P < 0.0001 and ns, not significant, was tested via a One-Way ANOVA.
Figure 3
Figure 3
Cytotoxicity of PTI against 4T1 cells. (A) CLSM images of live/dead staining assay and (B) the quantitative green fluorescence analysis of 4T1 cells treated by ICG-001, PT, PT + ICG-001 and PTI with or without illumination (n = 3). Scale bar: 100 μm. (C) MTT assay to detect the viability of 4T1 cells treated by ICG-001, PT, PT + ICG-001 and PTI with or without illumination (n = 4). (D) Flow cytometry measurement to analyze the Annexin V-FITC/PI staining on 4T1 cells treated by ICG-001, PT, PT + ICG-001 and PTI with or without illumination. Data are presented as mean ± SD. ∗∗∗P < 0.001 and ∗∗∗∗P < 0.0001 was tested via a One-Way ANOVA.
Figure 4
Figure 4
ICD induction and PD-L1 downregulation by PTI. (A) CRT and (B) HMGB1 immunofluorescence staining of 4T1 cells treated by ICG-001, PT, PT + ICG-001 or PTI with or without illumination. Scale bar: 20 μm. Quantitative (C) CRT and (D) HMGB1 immunofluorescence analysis of 4T1 cells after various treatments. (E) Western blot analysis of CRT and HMGB1 expressions on 4T1 cells treated by ICG-001, PT, PT + ICG-001 or PTI with or without illumination. Quantitative analysis of (F) CRT and (G) HMGB1 expressions on 4T1 cells after various treatments. (H) Quantitative analysis of PD-L1 expression on 4T1 cells after treatment with ICG-001, PT, PT + ICG-001 or PTI. Data are presented as mean ± SD (n = 3). ∗∗P < 0.01, ∗∗∗P < 0.001, ∗∗∗∗P < 0.0001, and ns, not significant were tested via a One-Way ANOVA.
Figure 5
Figure 5
Anti-tumor effect of PTI in vivo. (A) Fluorescence images of 4T1 tumor bearing mouse after intravenous injection with PTI for 0 (bright field), 0.5, 2, 4, 8, and 12 h. (B) Ex vivo tissue imaging of the mouse after 12 h postinjection. (C) Relative primary tumor growth curves of mice after treatment with ICG-001, PT or PTI in the presence or absence of irradiation in 21 days. (D) Tumor images, (E) the mean tumor weight, (F) spleen images, and (G) spleen weight of mice after various treatments on Day 21. (H) H&E staining images of spleen and tumor tissues after various treatments on Day 21. Scale bar: 200 μm. (I) Immunofluorescence staining of TUNEL (green) and Ki-67 (red) in tumors after various treatments on Day 21. Scale bar: 100 μm. Data are presented as mean ± SD (n = 5). ∗∗∗∗P < 0.0001 and ns, not significant, was tested via a One-Way ANOVA.
Figure 6
Figure 6
PTI enhanced the infiltration of immune cells in tumor. The immunofluorescence staining of (A) CCL4 (green), (B) CD103 (red) and (C) CD8 (green) in 4T1 tumors after treatment with ICG-001, PT and PTI in the presence or absence of illumination. Scale bar: 100 μm.
Figure 7
Figure 7
Immune activation in vivo. (A) Therapeutic schedule of 4T1 tumor bearing mice for immune cell analysis. Percentages of (B) CD80+CD86+, (C) CD11C+CD103+ matured DCs, (D) CD3+CD8+ and (E) CD3+CD4+ T lymphocytes in 4T1 tumors treated by ICG-001, PT or PTI with or with light exposure. Percentages of (F) CD11C+CD103+ matured DCs, (G) CD3+CD8+ and (H) CD3+CD4+ T lymphocytes in spleens treated by ICG-001, PT or PTI with or with light exposure. Data are presented as mean ± SD (n = 3). ∗P < 0.05, ∗∗P < 0.01, ∗∗∗P < 0.001, ∗∗∗∗P < 0.0001 and ns, not significant, were tested via a One-Way ANOVA.
Figure 8
Figure 8
Anti-metastatic study and safety assessment of PTI. (A) Images of lung tissues and H&E staining of lung, heart, liver and kidney of the mice after treatment with ICG-001, PT or PTI in the presence or absence of illumination. Scale bar: 200 μm. (B) The body weight variations of the mice after treatment with ICG-001, PT or PTI in the presence or absence of illumination in 21 days (n = 5). (C) Blood biochemical analysis of ALT, AST, UA and UREA after various treatments (n = 3).

Similar articles

References

    1. Reinfeld B.I., Rathmell W.K., Kim T.K., Rathmell J.C. The therapeutic implications of immunosuppressive tumor aerobic glycolysis. Cell Mol Immunol. 2022;19:46–58. - PMC - PubMed
    1. Gao A.Q., Liu X., Lin W.L., Wang J.N., Wang S.Y., Si F.S., et al. Tumor-derived ILT4 induces T cell senescence and suppresses tumor immunity. J Immunother Cancer. 2021;9 - PMC - PubMed
    1. Fan Y.B., Li Y., Yao X.D., Jin J.K., Scott A., Liu B., et al. Epithelial SOX9 drives progression and metastases of gastric adenocarcinoma by promoting immunosuppressive tumour microenvironment. Gut. 2023;72:624–637. - PubMed
    1. Kerdidani D., Chouvardas P., Arjo A.R., Giopanou I., Ntaliarda G., Guo Y.A., et al. WNT1 silences chemokine genes in dendritic cells and induces adaptive immune resistance in lung adenocarcinoma. Nat Commun. 2019;10:1405. - PMC - PubMed
    1. Cerezo-Wallis D., Contreras-Alcalde M., Troulé K., Catena X., Mucientes C., Calvo T.G., et al. Midkine rewires the melanoma microenvironment toward a tolerogenic and immune-resistant state. Nat Med. 2020;26:1865–1877. - PubMed

LinkOut - more resources