. 2024 Sep 9;20(12):4853-4871.
doi: 10.7150/ijbs.97503. eCollection 2024.

NOP2-mediated 5-methylcytosine modification of APOL1 messenger RNA activates PI3K-Akt and facilitates clear cell renal cell carcinoma progression

Affiliations

NOP2-mediated 5-methylcytosine modification of APOL1 messenger RNA activates PI3K-Akt and facilitates clear cell renal cell carcinoma progression

Junjie Tian et al. Int J Biol Sci. .

Abstract

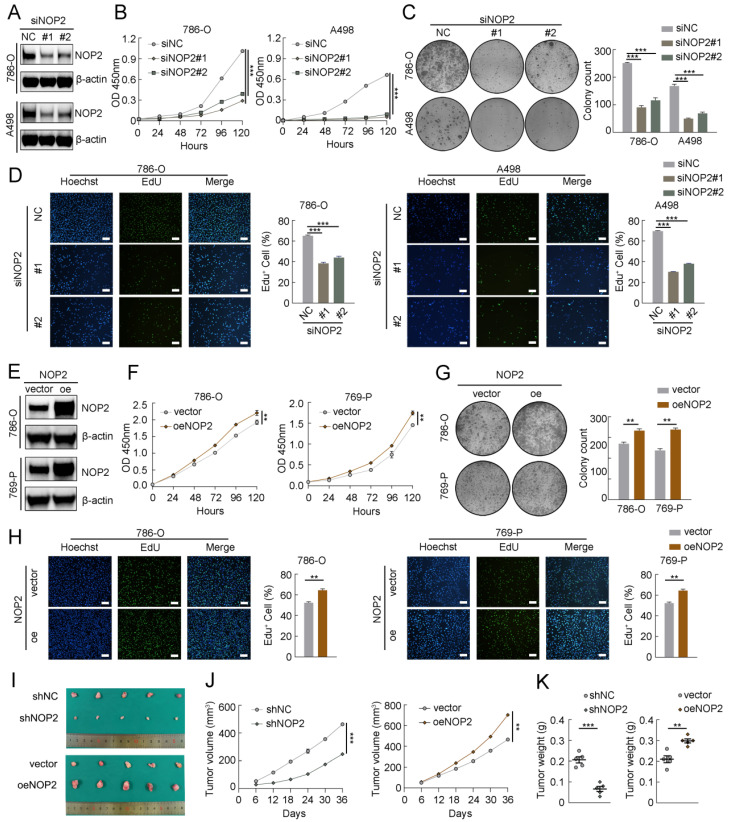
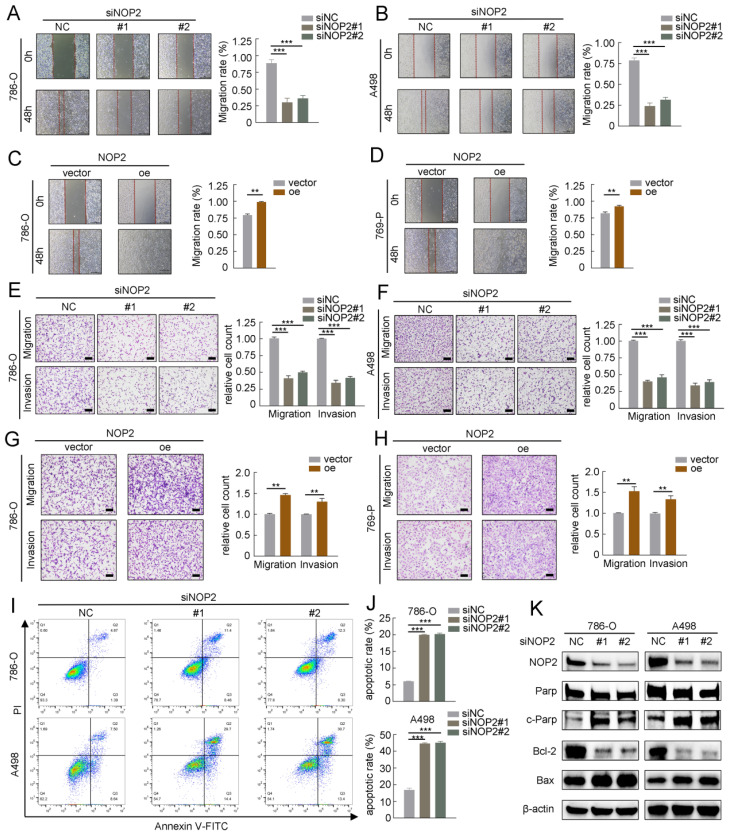
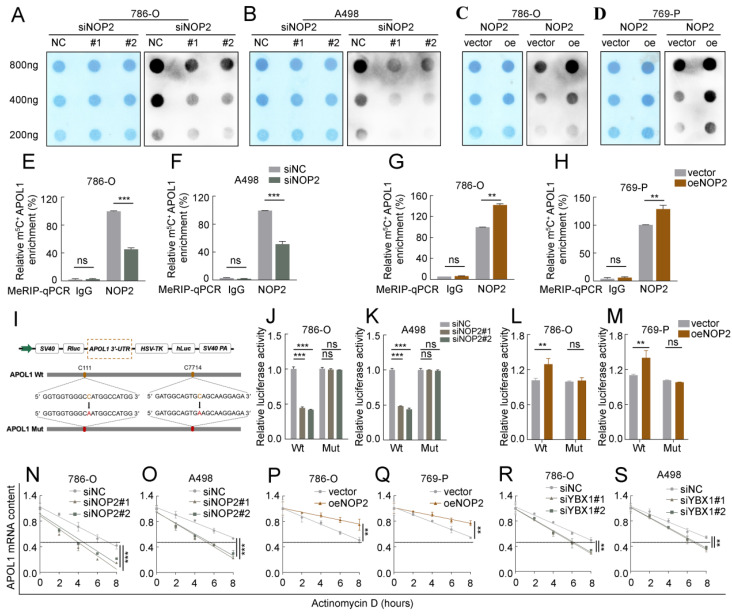
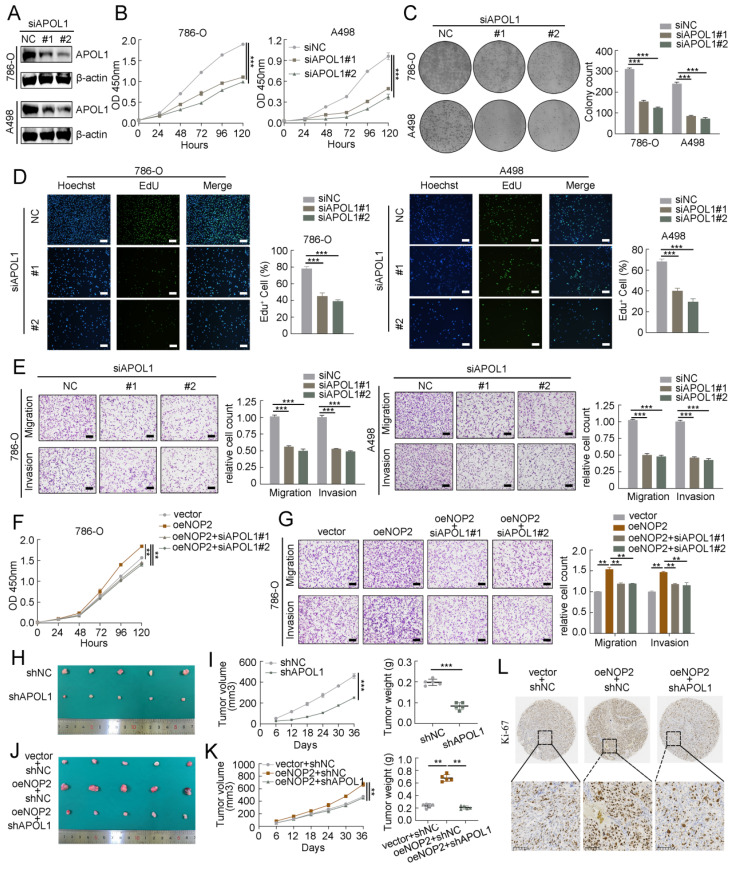
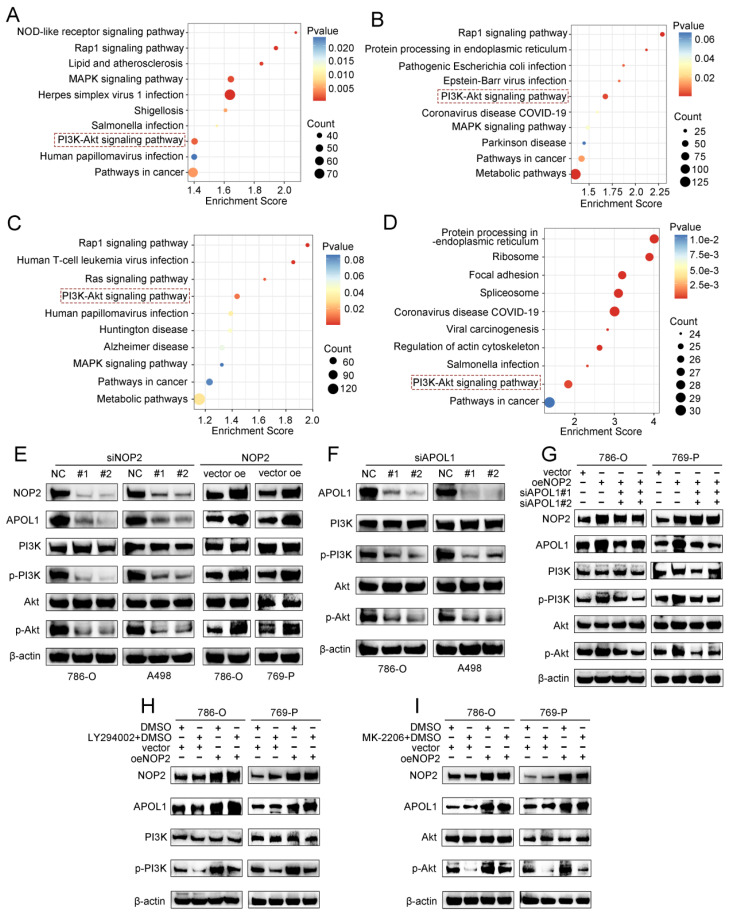
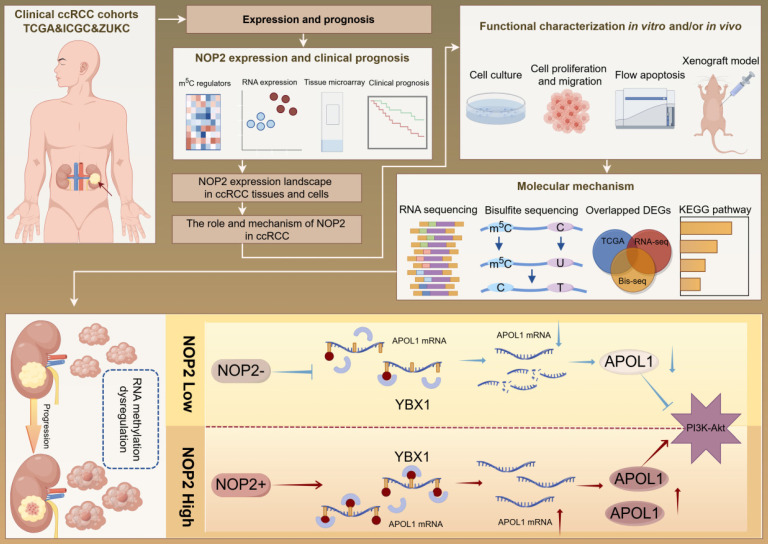
Background: By regulating the functions of multiple RNAs, 5-methylcytosine (m5C) RNA methylation, particularly mediated by NOP2, is involved in tumorigenesis and developments. However, the specific functions and potential mechanisms of m5C, especially involving NOP2, in clear-cell renal cell carcinoma (ccRCC), remain unclear. Methods: NOP2 expression in cell lines and patient tissues was detected using western blotting, quantitative real-time polymerase chain reaction (RT-qPCR), and immunohistochemistry. The biological effects of NOP2 on ccRCC cells were investigated through a series of in vitro and in vivo experiments. To explore the potential regulatory mechanisms by which NOP2 affects ccRCC progression, m5C bisulfite sequencing, RNA-sequencing, RNA immunoprecipitation and methylated RNA immunoprecipitation (RIP/MeRIP) RT-qPCR assay, luciferase reporter assay, RNA stability assay, and bioinformatic analysis were performed. Results: NOP2 expression was significantly upregulated in ccRCC tissues and was associated with poor prognosis. Moreover, loss-of-function and gain-of-function assays demonstrated that NOP2 altered ccRCC cell proliferation, migration, and invasion. Mechanistically, NOP2 stimulated m5C modification of apolipoprotein L1 (APOL1) mRNA, and m5C reader YBX1 stabilized APOL1 mRNA through recognizing and binding to m5C site in the 3'-untranslated regions. Silencing APOL1 expression inhibited ccRCC cell proliferation in vitro and tumor formation in vivo. Furthermore, NOP2/APOL1 affected ccRCC progression via the PI3K-Akt signaling pathway. Conclusion: NOP2 functions as an oncogene in ccRCC by promoting tumor progression through the m5C-dependent stabilization of APOL1, which in turn regulates the PI3K-Akt signaling pathway, suggesting a potential therapeutic target for ccRCC.

Keywords: 5-methylcytosine; APOL1; NOP2; clear cell renal cell carcinoma; clinical prognosis.


Conflict of interest statement

Competing Interests: The authors have declared that no competing interest exists.

Figures

Figure 1
Figure 1
The expression level of NOP2 in ccRCC tissue and cell lines. (A)Heatmap visualized the expression of m5C regulators in TCGA-KIRC cohort. Yellow and blue regions represented higher and lower expression level, respectively. (B) Landscape of interactions network between m5C regulators in ccRCC. The circle size represented impact of each regulator on survival prognosis, as calculated by log-rank test. Connecting lines represented m5C regulators interactions. The red line represented positive correlation, the blue line represented negative correlation, and the line thickness indicated correlation strength (the wider the line, the stronger the correlation). The regulator clusters of Writers, Readers and Erasers were marked yellow, red, and blue, respectively. (C) Expression of NOP2 across various cancers in TCGA database. Yellow background represented KIRC patients. NOP2 was significantly upregulated in ccRCC tissues compared to the counterpart peritumoral normal renal tissues from the ICGC database (D) and paired normal tissues from the TCGA database (E). (F) Relative expression of NOP2 mRNA in 90 pairs of ccRCC tissues and their paired normal adjacent tissues from ZUKC cohort. (G) The expression of NOP2 protein was detected by Western blotting in 12 paired ccRCC tissues and adjacent normal kidney tissues. T: Tumor tissues, N: Adjacent normal tissues. (H) representative IHC images of NOP2 staining in ccRCC tumor or adjacent tissues from ZUKC tissue microarray. (I) IHC scores of 90 pairs of ccRCC tissues in ZUKC cohort according to NOP2 staining. (J) The mRNA and protein levels of NOP2 were detected in normal human renal epithelial cell line (HK-2) and RCC cell lines (786-O, A498, 769-P, ACHN and Caki-1) by RT-qPCR and Western blotting. Data were displayed as mean ± SD. Differences were considered significant at P < 0.05 (* P < 0.05, ** P < 0.01, *** P < 0.001).
Figure 2
Figure 2
NOP2 promoted ccRCC proliferation in vitro and in vivo. (A)Western blotting analysis of NOP2 knockdown efficiency in 786-O and A498 cells. (B-D) The proliferation of ccRCC cells under silenced NOP2 was detected via CCK-8 (B), colony-formation (C), and EdU assays (D). (E) Western blotting analysis of NOP2 overexpression efficiency in 786-O and 769-P cells. (F-H) The proliferation of ccRCC cells under overexpression of NOP2 was detected via CCK-8 (F), colony-formation (G), and EdU assays (H). (I-K) Tumor growth nodules (I) of stable NOP2 knockdown and overexpression 786-O cells (or negative control) in the xenograft mouse model were shown, followed by the generation of tumor curve (J) and tumor weight records (K). Scale bars, 50 µm. Data were displayed as mean ± SD. Differences were considered significant at P < 0.05 (** P < 0.01, *** P < 0.001).
Figure 3
Figure 3
NOP2 promoted in vitro migration and invasion and affected apoptosis of ccRCC cells. Cell wound-healing assay (A-D), Transwell migration and invasion assay (E-H) revealed the effect of NOP2 knockdown or overexpression on ccRCC cells. Knockdown of NOP2 inducing apoptosis of ccRCC cells were detected by flow cytometry (I) and Western blotting assay (J). The corresponding quantitative analysis results were presented in the right panel. Scale bar, 50 μm. Data were displayed as mean ± SD. Differences were considered significant at P < 0.05 (** P < 0.01, *** P < 0.001).
Figure 4
Figure 4
A high-throughput sequencing combination revealed APOL1 to be the potential target of NOP2. (A) Volcano plot showed changes in differential genes after NOP2 knockdown. (B) Volcano plot showed the significant genes associated with NOP2 expression under the Pearson's correlation coefficient analysis. (C) m5C sequence frequency logo in GC transcripts and distribution of mRNA m5C sites in GC. (D) Venn plot displayed the intersected genes from RNA-seq (downregulated DEGs), Bis-seq, and NOP2 positively correlated genes. Three common genes were screened out. (E, F) The mRNA levels of overlapped genes in NOP2-knockdown (E) and NOP2-overexpressing (F) ccRCC cells were validated by RT-qPCR. (G) The protein level of APOL1 in NOP2-knockdown or NOP2-overexpressing ccRCC cells were detected by Western blotting. (H) The levels of APOL1 expression were analyzed in ccRCC (n=533) and peritumoral normal kidney tissues (n=72) using TCGA cohort. (I) The levels of APOL1 expression were analyzed in ccRCC (n=90) and peritumoral normal kidney tissues (n=45) using ICGC cohort. (J) The levels of APOL1 expression were detected in ccRCC and paired normal kidney tissues by RT-qPCR from ZUKC cohort (n=90). NOP2 expression was positively correlated with APOL1 expression in ccRCC from TCGA (K) and ZUKC cohort (L), respectively. RIP-qPCR detected the content of APOL1 mRNA immunoprecipitated by NOP2 (M) and YBX1 (N) specific antibodies. IgG antibodies were used as negative control. (O) APOL1 protein expression level was detected by Western blotting in 786-O and A498 cells upon knockdown of YBX1. Data were displayed as mean ± SD. Differences were considered significant at P < 0.05 (ns, non-significance, *** P < 0.001).
Figure 5
Figure 5
NOP2-mediated m5C modification of APOL1 mRNA maintained its YBX1-dependent stability. (A-D) The m5C level of total RNAs in ccRCC cells with knockdown (A, B) or overexpression (C, D) of NOP2. Methylene blue staining was used as a loading control. (E-H) MeRIP-qPCR analysis was performed to reveal NOP2-mediated APOL1 m5C modifications. The m5C modification of APOL1 was depleted on knockdown of NOP2 (E, F), while it was increased on up-regulation of NOP2 (G, H). (I) PsiCHECK2-APOL1-3′-UTR plasmid with either wild-type (Wt) or mutant (Mut) m5C sites were constructed based on Bis-seq data. (J-M) Relative luciferase activity of the Wt or Mut reporters in NOP2-depletion (J, K) and overexpression (L, M) ccRCC cells were detected (normalized to negative control groups). (N-S) The stability of APOL1 mRNA was determined in NOP2 knockdown (N, O), NOP2 overexpressing (P, Q), YBX1 knockdown (R, S) and their corresponding control ccRCC cells after treatment with Actinomycin D (5 µg/mL) at the indicated time points (normalized to 0 h).
Figure 6
Figure 6
APOL1 was involved in NOP2-mediated ccRCC malignant process in vitro and in vivo. Western blotting analysis of APOL1 knockdown efficiency in 786-O and A498 cells. (B-D) The proliferation of ccRCC cells under silenced APOL1 was detected via CCK-8 (B), colony-formation (C), and EdU assays (D). (E) Knockdown of APOL1 impaired cell migration and invasion ability in 786-O and A498 cells, with bar charts indicating the quantification results of cell migration and invasion (right panel). Rescue experiments were conducted to determine the influence of down-regulated APOL1 with overexpressing of NOP2 in cells proliferation (F) and cells migration and invasion abilities (G). (H) Tumor growth nodules of stable APOL1 knockdown and negative control 786-O cells in the xenograft mouse model were shown, (I) followed by the generation of tumor growth curve and tumor weight records. (J) Knockdown of APOL1 inhibited NOP2-induced 786-O cells subcutaneous tumour growth in nude mice (n=5). (K) The tumor growth curve and tumor weight records were shown after 5 weeks. (L) Sections of nude mice subcutaneous tumors were stained with anti-Ki67 antibodies by IHC. Scale bar, 50 μm. Data were displayed as mean ± SD. Differences were considered significant at P < 0.05 (** P < 0.01, *** P < 0.001).
Figure 7
Figure 7
NOP2/APOL1 was involved the progression of ccRCC via PI3K-Akt pathway. (A)KEGG pathway analysis of NOP2-regulated genes in NOP2-deficient 786-O cells. (B) KEGG pathway analysis of differentially expressed genes between the APOL1high and APOL1low group in TCGA-KIRC cohort. (C) KEGG pathway analysis of differentially expressed genes between the NOP2high and NOP2low group in TCGA-KIRC cohort. (D) KEGG pathway analysis of m5C-modified genes in NOP2-deficient 786-O cells. (E) The phospho-PI3K and phospho-Akt protein expression in ccRCC cells with knockdown or overexpression of NOP2. (F) The phospho-PI3K and phospho-Akt protein expression in ccRCC cells with depletion of APOL1. (G) The phospho-PI3K and phospho-Akt protein expression levels in down-regulation of APOL1 with NOP2-overexpressing ccRCC cells. Overexpression of NOP2 could significantly rescued the reduced phospho-PI3K and phospho-Akt protein expression level by PI3K (H) and Akt (I) inhibitor, respectively. LY294002: PI3K inhibitor; MK2206: Akt inhibitor.
Figure 8
Figure 8
A graphical summary of methodology and regulatory mechanism.

Similar articles

References

    1. Siegel RL, Miller KD. Cancer Statistics, 2021. CA Cancer J Clin. 2021;71:7–33. - PubMed
    1. Bhatt JR, Finelli A. Landmarks in the diagnosis and treatment of renal cell carcinoma. Nature reviews Urology. 2014;11:517–25. - PubMed
    1. van der Mijn JC, Mier JW, Broxterman HJ, Verheul HM. Predictive biomarkers in renal cell cancer: insights in drug resistance mechanisms. Drug resistance updates: reviews and commentaries in antimicrobial and anticancer chemotherapy. 2014;17:77–88. - PubMed
    1. Chakiryan NH, Jiang DD, Gillis KA, Green E, Hajiran A, Hugar L. et al. Real-World Survival Outcomes Associated With First-Line Immunotherapy, Targeted Therapy, and Combination Therapy for Metastatic Clear Cell Renal Cell Carcinoma. JAMA network open. 2021;4:e2111329. - PMC - PubMed
    1. Chen YW, Rini BI, Beckermann KE. Emerging Targets in Clear Cell Renal Cell Carcinoma. Cancers (Basel) 2022;14:4843. - PMC - PubMed

MeSH terms