

Similarities and differences between osteoarthritis and rheumatoid arthritis: insights from Mendelian randomization and transcriptome analysis
- PMID: 39304950
- PMCID: PMC11414073
- DOI: 10.1186/s12967-024-05643-4
Similarities and differences between osteoarthritis and rheumatoid arthritis: insights from Mendelian randomization and transcriptome analysis
Abstract
Background: Osteoarthritis (OA) and rheumatoid arthritis (RA) are often difficult to distinguish in the early stage of the disease. The purpose of this study was to explore the similarities and differences between the two diseases through Mendelian randomization (MR) and transcriptome analysis.
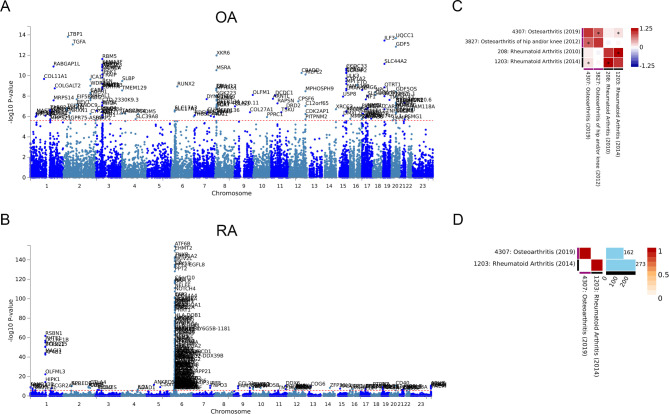
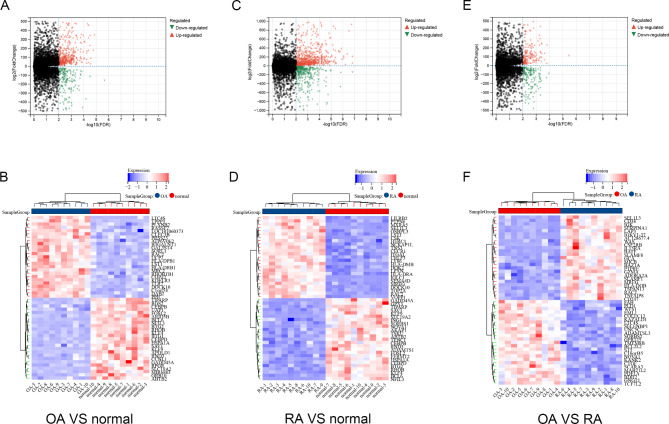
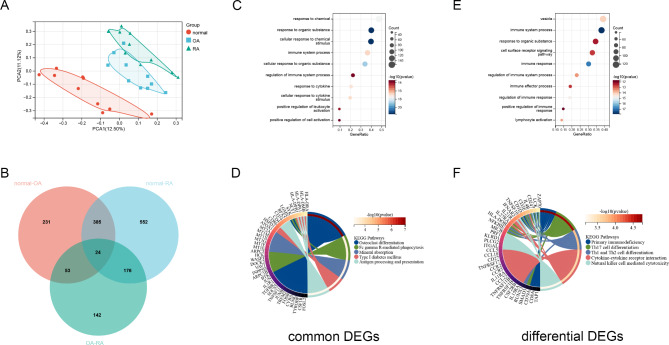
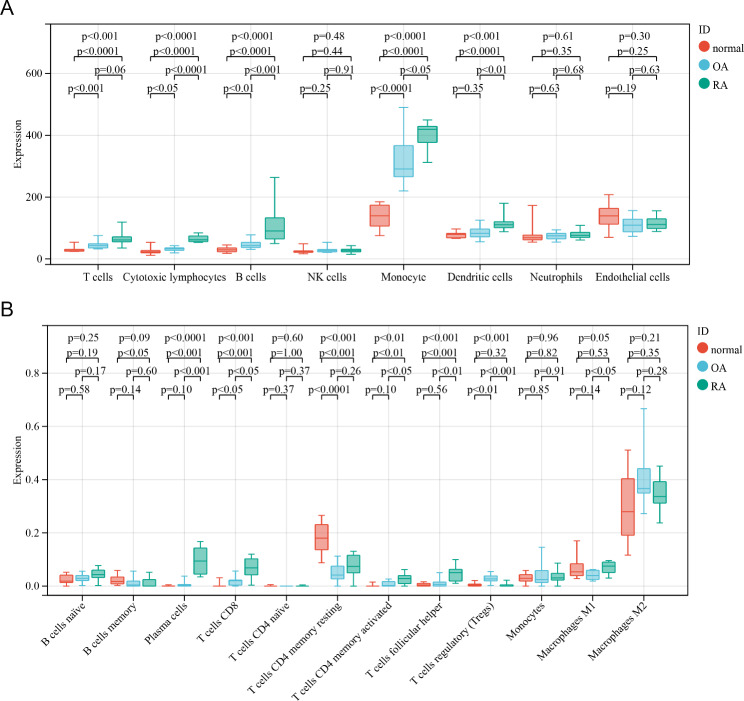
Methods: We first performed a correlation analysis of phenotypic data from genome-wide association studies (GWAS) of OA and RA. Then, we performed functional and pathway enrichment of differentially expressed genes in OA, RA, and normal patients. The infiltration of immune cells in arthritis was analyzed according to gene expression. Finally, MR analysis was performed with inflammatory cytokines and immune cells as exposures and arthritis as the outcome. The same and different key cytokines and immune cells were obtained by the two analysis methods.
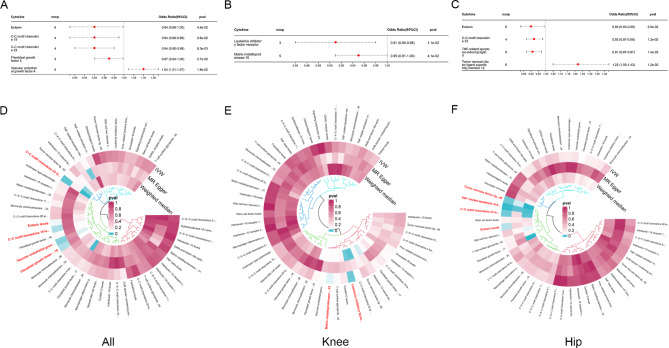
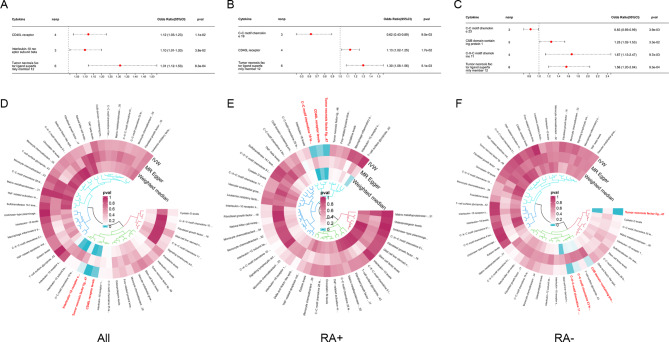
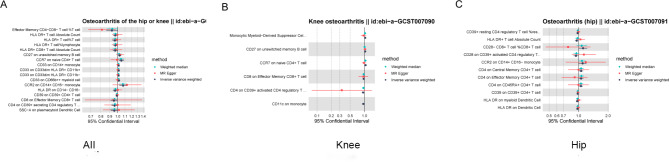
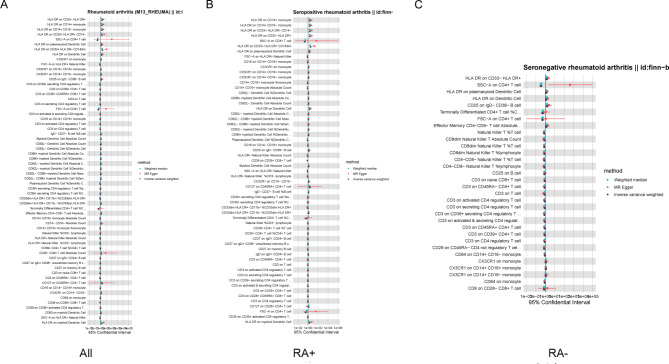
Results: GWAS indicated that there was a genetic correlation between OA and RA. The common function of OA and RA is enriched in their response to cytokines, while the difference is enriched in lymphocyte activation. T cells are the main immune cells that differentiate between OA and RA. MR analysis further revealed that OA is associated with more protective cytokines, and most of the cytokines in RA are pathogenic. In addition, CCR7 on naive CD4 + T cell was positively correlated with OA. SSC-A on CD4 + T cell was negatively correlated with RA, while HLA DR on CD33- HLA DR + was positively correlated with RA.
Conclusion: Our study demonstrated the similarities and differences of immune inflammation between OA and RA, allowing us to better understand these two diseases.
Keywords: Immune cells; Inflammatory cytokines; Mendelian randomization; Osteoarthritis (OA); Rheumatoid arthritis (RA).
© 2024. The Author(s).
Conflict of interest statement
The authors declare that they have no conflicts of interest.
Figures
Similar articles
-
Causal relationship, shared genes between rheumatoid arthritis and pulp and periapical disease: evidence from GWAS and transcriptome data.Front Immunol. 2024 Sep 13;15:1440753. doi: 10.3389/fimmu.2024.1440753. eCollection 2024. Front Immunol. 2024. PMID: 39346909 Free PMC article.
-
Causal association of monounsaturated fatty acids with rheumatoid arthritis but not osteoarthritis: A two-sample Mendelian randomization study.Nutrition. 2021 Nov-Dec;91-92:111363. doi: 10.1016/j.nut.2021.111363. Epub 2021 Jun 1. Nutrition. 2021. PMID: 34246888
-
Mendelian randomization and transcriptome analysis identified immune-related biomarkers for osteoarthritis.Front Immunol. 2024 Apr 12;15:1334479. doi: 10.3389/fimmu.2024.1334479. eCollection 2024. Front Immunol. 2024. PMID: 38680491 Free PMC article.
-
Genetics in neuroendocrine immunology: implications for rheumatoid arthritis and osteoarthritis.Ann N Y Acad Sci. 2010 Apr;1193:10-4. doi: 10.1111/j.1749-6632.2009.05288.x. Ann N Y Acad Sci. 2010. PMID: 20398001 Review.
-
Molecular Foundations of Inflammatory Diseases: Insights into Inflammation and Inflammasomes.Curr Issues Mol Biol. 2024 Jan 3;46(1):469-484. doi: 10.3390/cimb46010030. Curr Issues Mol Biol. 2024. PMID: 38248332 Free PMC article. Review.
References
-
- Gessl I, et al. Role of joint damage, malalignment and inflammation in articular tenderness in rheumatoid arthritis, psoriatic arthritis and osteoarthritis. Ann Rheum Dis. 2021;80:884–90. 10.1136/annrheumdis-2020-218744. - PubMed
-
- Goldring MB, Goldring SR. Articular cartilage and subchondral bone in the pathogenesis of osteoarthritis. Ann N Y Acad Sci. 2010;1192:230–7. 10.1111/j.1749-6632.2009.05240.x. - PubMed
-
- Berenbaum F. Osteoarthritis as an inflammatory disease (osteoarthritis is not osteoarthrosis!). Osteoarthritis Cartilage. 2013;21:16–21. 10.1016/j.joca.2012.11.012. - PubMed
-
- de Lange-Brokaar BJ, et al. Synovial inflammation, immune cells and their cytokines in osteoarthritis: a review. Osteoarthritis Cartilage. 2012;20:1484–99. 10.1016/j.joca.2012.08.027. - PubMed
Publication types
MeSH terms
Substances
LinkOut - more resources
Full Text Sources
Medical
Research Materials
