. 2024 Sep 5:15:1444622.
doi: 10.3389/fimmu.2024.1444622. eCollection 2024.

Type V collagen-induced nasal tolerance prevents lung damage in an experimental model: new evidence of autoimmunity to collagen V in COPD

Affiliations

Type V collagen-induced nasal tolerance prevents lung damage in an experimental model: new evidence of autoimmunity to collagen V in COPD

Fabíola Santos Zambon Robertoni et al. Front Immunol. .

Abstract

Background: Chronic obstructive pulmonary disease (COPD) has been linked to immune responses to lung-associated self-antigens. Exposure to cigarette smoke (CS), the main cause of COPD, causes chronic lung inflammation, resulting in pulmonary matrix (ECM) damage. This tissue breakdown exposes collagen V (Col V), an antigen typically hidden from the immune system, which could trigger an autoimmune response. Col V autoimmunity has been linked to several lung diseases, and the induction of immune tolerance can mitigate some of these diseases. Evidence suggests that autoimmunity to Col V might also occur in COPD; thus, immunotolerance to Col V could be a novel therapeutic approach.

Objective: The role of autoimmunity against collagen V in COPD development was investigated by analyzing the effects of Col V-induced tolerance on the inflammatory response and lung remodeling in a murine model of CS-induced COPD.

Methods: Male C57BL/6 mice were divided into three groups: one exposed to CS for four weeks, one previously tolerated for Col V and exposed to CS for four weeks, and one kept in clean air for the same period. Then, we proceeded with lung functional and structural evaluation, assessing inflammatory cells in bronchoalveolar lavage fluid (BALF) and inflammatory markers in the lung parenchyma, inflammatory cytokines in lung and spleen homogenates, and T-cell phenotyping in the spleen.

Results: CS exposure altered the structure of elastic and collagen fibers and increased the pro-inflammatory immune response, indicating the presence of COPD. Col V tolerance inhibited the onset of emphysema and prevented structural changes in lung ECM fibers by promoting an immunosuppressive microenvironment in the lung and inducing Treg cell differentiation.

Conclusion: Induction of nasal tolerance to Col V can prevent inflammatory responses and lung remodeling in experimental COPD, suggesting that autoimmunity to Col V plays a role in COPD development.

Keywords: animal models; autoimmunity; chronic obstructive pulmonary disease; cigarette smoking; collagen type V; immune tolerance; pulmonary emphysema; regulatory T cell.


Conflict of interest statement

The authors declare that the research was conducted in the absence of any commercial or financial relationships that could be construed as a potential conflict of interest.

Figures
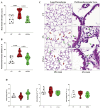
Figure 1
Figure 1
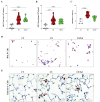
Lung Morphometry and Respiratory Mechanics (A) Increased Lm in the Cigarette Smoke (CS) group compared to that in the Control (CT) and Cigarette Smoke/Tolerance (CS/Tol) groups (p=0.0064 and p=0.0032, respectively; one-way ANOVA and Holm-Sidak multiple comparisons test; CT n=8, CS n=9, CS/Tol n=7). (B) Increased peribronchovascular edema in the CS group compared to the CT and CS/Tol groups (p=0.0082 and p=0.043, respectively, Kruskal-Wallis and Dunn´s multiple comparisons test; CT n=10, CS n=9, CS/Tol n=6). Violin plot graphs show the frequency distribution of the analyzed data, the median, and the interquartiles. (C) Photomicrographs of the lung parenchyma in the CT, CS, and CS/Tol groups (40x magnification) and the peribronchovascular area (63x magnification). H&E staining. Red arrows indicate tissue damage with alveolar enlargement, and green arrows indicate inflammatory cells. (D) There was no difference in airway resistance (Raw), tissue damping (Gtis), or tissue elastance (Htis) among the experimental, CT, CS, and CS/Tol groups (one-way ANOVA and Holm-Sidak multiple comparisons test; CT n=7, CS n=10, CS/Tol n=7). Violin plot graphs show the frequency distribution of the analyzed data, the median, and the interquartiles.
Figure 2
Figure 2
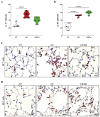
Identification of type I collagen and elastic fibers in the lung parenchyma. (A) The proportion of elastic fibers in the CS group was significantly greater than in the CT group (p=0.0393, one-way ANOVA and Holm-Sidak multiple comparisons test; n=6 in each experimental group). (B) The proportion of collagen type I fibers was significantly lower in the CS group than in the CT group (p=0.0012, one-way ANOVA and Holm-Sidak multiple comparisons test; n=5 in each experimental group). Violin plot graphs showing the frequency distribution of the analyzed data, the median and the interquartiles. (C) Photomicrographs of alveolar parenchyma with modified resorcin-fuchsin immunostaining (400x magnification) in the CT, CS, and CS/Tol groups, showing an increase in elastic fiber breakdown in the CS group reflected by increased staining in purple (green arrows show examples of positive staining). (D) Photomicrographs of alveolar parenchyma with type I collagen immunofluorescence staining (400x magnification) in the CT, CS, and CS/Tol groups, show a decrease in those fibers in the CS group (red arrows show examples of positive staining in green).
Figure 3
Figure 3
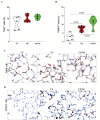
Total cell and macrophage counts in BALF, the proportion of Galectin-3+ cells in the lung parenchyma, and representative photomicrographs of total cells in BALF and immunostaining for Galectin-3+ cells. (A) There was a significant increase in the number of total BALF cells in the CS and CS/Tol groups compared to that in the CT group (p=0.0027 and p=0.0035, respectively; Kruskal-Wallis test and Dunn’s multiple comparisons test; CT, n=10; CS, n=9; CS/Tol, n=6). (B) Differential cell counts revealed a predominance of macrophages among the BALF cells, with significantly greater numbers in the CS and CS/Tol groups than in the CT group (p=0.0017 and p=0.0093, respectively; Kruskal-Wallis and Dunn’s multiple comparisons test; CT, n=10; CS, n=9; CS/Tol, n=6). (C) The number of Galectin-3+ cells was significantly greater in the CS group than in the C group (p=0.002, one-way ANOVA and Holm-Sidak’s multiple comparisons tests; n=5 in each experimental group). The violin plots show the frequency distributions of the analyzed data. (D) Photomicrographs of BALF cells in the CT, CS, and CS/Tol groups (200x magnification; Diff-Quik staining; red arrows show the predominance of macrophages in BALF). (E) Photomicrographs of galectin-3 immunostaining in the lung parenchyma in the CT, CS and CS/Tol groups (1000x magnification; red arrows show positive cells in brown).
Figure 4
Figure 4
Proportion of IL-17+ and IL-10+ cells in the lung parenchyma and representative photomicrographs of immunostaining for IL-17+ and IL-10+ cells. (A) There was a significant increase in the number of IL-17+ cells in the CS group compared to that in the CT group (p=0.0044; Kruskal-Wallis and Dunn’s multiple comparisons tests; n=5 for each experimental group). (B) There was a significant increase in the number of IL-10+ cells in the CS group and the CS/Tol group compared to that in the CT group (p<0.0001, both; one-way ANOVA and Holm-Sidak’s multiple comparisons test; n=5 for each experimental group). The violin plots show the frequency distributions of the analyzed data. (C) Photomicrographs of IL-17 immunostaining in the lung parenchyma in the CT, CS and CS/Tol groups (1000x magnification; red arrows show positive cells in brown). (D) Photomicrographs of IL-17 immunostaining in the lung parenchyma in the CT, CS and CS/Tol groups (1000x magnification; red arrows show positive cells in brown).
Figure 5
Figure 5
Proportion of TGFβ+ and FOXP3+ cells in the lung parenchyma and representative photomicrographs of immunostaining for TGFβ+ and FOXP3+ cells. (A) There was no difference in the number of TGFβ+ cells between the experimental groups (one-way ANOVA and Holm-Sidak multiple comparisons test, n=5 for each experimental group). (B) There was a significant increase in the number of FOXP3+ cells in the CS and CS/Tol groups compared to that in the CT group (p=0.0209 and p=0,0005, respectively), and a significant increase in the number of FOXP3+ cells in the CS/Tol group compared to that in the CS group (p=0,034, one-way ANOVA and Holm-Sidak’s multiple comparisons test, n=5 for each experimental group). The violin plots show the frequency distributions of the analyzed data. (C) Photomicrographs of TGFβ immunostaining in the lung parenchyma in the CT, CS and CS/Tol groups (1000x magnification; red arrows show positive cells in brown). (D) Photomicrographs of Foxp3 immunostaining in the lung parenchyma in the CT, CS and CS/Tol groups (1000x magnification; red arrows show positive cells in brown).
Figure 6
Figure 6
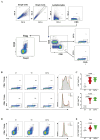
Frequencies of T lymphocyte phenotypes in the spleen (CD4+CD44hi, CD8+CD44hi, and CD4+CD25+FOXP3+). (A) Gating strategy used for flow cytometry: single cells, CD3+ cells, CD4+ cells or CD8+ cells, CD44hi cells, and CD4+ cells, CD25+ cells and FOXP3+ cells. (B) Percentage of CD44hi cells among CD4+ and CD8+ T cells. (C) There was an increase in the frequency of CD4+CD4hi cells in the CS and CS/Tol groups (p=0.0015 and p=0.006, respectively) compared to that in the CT group, and there was an increase in the frequency of CD8+CD4hi cells in the CS and CS/Tol groups (p< 0.0001, both). (D) Percentage of CD25+FOXP3+ CD4+ T cells markers. (E) There was an increase in the Treg (CD4+CD25+FOXP3+) frequency in the CS/Tol group (p=0,0465) compared to that in the CT group. (One-way ANOVA and Holm-Sidak multiple comparisons test, n=5 for each experimental group). The violin plots in the graphs show the frequency distributions of the analyzed data.
Figure 7
Figure 7
Levels of cytokines in the lung and spleen. (A) There was a significant decrease in lung IFNγ in the CS/Tol group compared to the CS group (p=0.0073). (B) There was a significant decrease in lung IL-6 in the CS/Tol group compared to the CS group (p=0.0009) and the CT group (p=0.0287). (C) There was a significant increase in lung TNF-α in the CS group compared to the CT group (p=0.0169). (D) There was a significant decrease in lung IL-10 in the CS/Tol group compared to that in the CS group (p=0.0309). (E) There was a significant decrease in lung IL-17A in the CS/Tol group compared to that in the CS group (p=0.002) and CT group (p=0.0499) (one-way ANOVA and Holm-Sidak’s multiple comparisons test, n=9-10 for all experimental groups). (F) There were no differences between groups for any of the inflammatory cytokines (one-way ANOVA and Holm-Sidak’s multiple comparisons test, n=9 for CT and CS, n=7 for the CS/Tol group). The violin plots show the frequency distributions of the analyzed data.
Figure 8
Figure 8
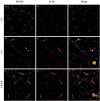
Immunofluorescence images of the lung parenchyma in all experimental groups showing FOXP3 (green) and IL-10 (red) immunostaining and merged images showing colocalization of both markers. The expression of FOXP3 (green) and IL-10 (red) in cells that infiltrated the lung parenchyma of the control, cigarette smoke, and cigarette smoke tolerance groups was assessed by double-label immunofluorescence. Nuclei were stained with DAPI (blue), and white arrows indicate positive cells. 400× magnification.

Similar articles

References

    1. Varmaghani M, Dehghani M, Heidari E, Sharifi F, Saeedi Moghaddam S, Farzadfar F. Global prevalence of chronic obstructive pulmonary disease: systematic review and meta-analysis. Eastern Mediterr Health J. (2019) 25:47–57. doi: 10.26719/emhj.18.014 - DOI - PubMed
    1. Karakioulaki M, Papakonstantinou E, Stolz D. Extracellular matrix remodelling in COPD. Eur Respir Rev. (2020) 29:190124. doi: 10.1183/16000617.0124-2019 - DOI - PMC - PubMed
    1. Venkatesan P. GOLD COPD report: 2024 update. Lancet Respir Med. (2024) 12:15–6. doi: 10.1016/S2213-2600(23)00461-7 - DOI - PubMed
    1. Ito JT, Lourenço JD, Righetti RF, Tibério IFLC, Prado CM, Lopes FDTQS. Extracellular matrix component remodeling in respiratory diseases: what has been found in clinical and experimental studies? Cells. (2019) 8:342. doi: 10.3390/cells8040342 - DOI - PMC - PubMed
    1. Hoogendoorn M, Hoogenveen RT, Rutten-van Molken MP, Vestbo J, Feenstra TL. Case fatality of COPD exacerbations: a meta-analysis and statistical modelling approach. Eur Respir J. (2011) 37:508–15. doi: 10.1183/09031936.00043710 - DOI - PubMed

Grants and funding

The author(s) declare that financial support was received for the research, authorship, and/or publication of this article. This study was funded by the São Paulo Research Foundation (FAPESP), protocol number 2021/13220-5 and by the Coordination for the Improvement of Higher Education Personnel, protocol number 88882.376547/2019-01. National Council for Scientific and Technological Development (CNPq), protocol number 302957/2021-9.

LinkOut - more resources