. 2024 Dec;38(12):2561-2572.
doi: 10.1038/s41375-024-02405-5. Epub 2024 Sep 17.

Selective degradation of mutant FMS-like tyrosine kinase-3 requires BIM-dependent depletion of heat shock proteins

Affiliations

Selective degradation of mutant FMS-like tyrosine kinase-3 requires BIM-dependent depletion of heat shock proteins

Melisa Halilovic et al. Leukemia. 2024 Dec.

Abstract

Internal tandem duplications in the FMS-like tyrosine kinase-3 (FLT3-ITD) are common mutations in acute myeloid leukemia (AML). Proteolysis-targeting chimeras (PROTACs) that induce proteasomal degradation of mutated FLT3 emerge as innovative pharmacological approach. Molecular mechanisms that control targeted proteolysis beyond the ubiquitin-proteasome-system are undefined and PROTACs are the only known type of FLT3 degraders. We report that the von-Hippel-Lindau ubiquitin-ligase based FLT3 PROTAC MA49 (melotinib-49) and the FLT3 hydrophobic tagging molecule MA50 (halotinib-50) reduce endoplasmic reticulum-associated, oncogenic FLT3-ITD but spare FLT3. Nanomolar doses of MA49 and MA50 induce apoptosis of human leukemic cell lines and primary AML blasts with FLT3-ITD (p < 0.05-0.0001), but not of primary hematopoietic stem cells and differentiated immune cells, FLT3 wild-type cells, retinal cells, and c-KIT-dependent cells. In vivo activity of MA49 against FLT3-ITD-positive leukemia cells is verified in a Danio rerio model. The degrader-induced loss of FLT3-ITD involves the pro-apoptotic BH3-only protein BIM and a previously unidentified degrader-induced depletion of protein-folding chaperones. The expression levels of HSP90 and HSP110 correlate with reduced AML patient survival (p < 0.1) and HSP90, HSP110, and BIM are linked to the expression of FLT3 in primary AML cells (p < 0.01). HSP90 suppresses degrader-induced FLT3-ITD elimination and thereby establishes a mechanistically defined feed-back circuit.


Conflict of interest statement

Competing interests: OHK declares the patents WO2019/034538, WO2016020369A1, and WO/2004/027418, and paid advisory work for the BASF Ludwigshafen, Germany. WO2019/034538 (Synthesis, Pharmacology and use of New and Selective FMS-like tyrosine kinase 3 (FLT3) FLT3 Inhibitors) covers substance classes that are discussed in this work. The substances that are covered in these patents are not the same that are shown in the submitted manuscript. The BASF has not influenced our study, and its products are not discussed in the manuscript. Thus, there are no direct competing interests. All other authors declare that they have no conflict of interest. Ethics: Peripheral blood and bone marrow samples were obtained from AML patients with written informed consent in accordance with the Declaration of Helsinki under ethical approval REC: 17/LO/1566. Institutional Review Board Statement Zebrafish husbandry (permit number 35-9185.64/BH Hassel) and experiments (permit number 35-9185.81/G-126/15) were performed according to local animal welfare standards (Tierschutzgesetz §11, Abs. 1, No. 1) and in accordance with European Union animal welfare guidelines (EU Directive 2010/63/EU). All applicable national and institutional guidelines for the care and use of zebrafish were followed. C57BL/6 mice were bred and maintained in the Central Animal Facility of the Johannes Gutenberg-University Mainz under specific pathogen-free conditions on a standard diet according to the guidelines of the regional animal care committee. The “Principles of Laboratory Animal Care” (NIH publication no. 85-23, revised 1985) were followed. Mice at 12 weeks of age were sacrificed for organ retrieval according to § 4(3) TierSchG.

Figures
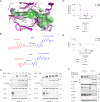
Fig. 1
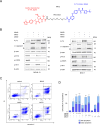
Fig. 1. Biological characterization of the FLT3 TPDs MA49 and MA50.
A Interaction of MA68 (green colored carbon atoms) at the ATP binding pocket of FLT3 (PDB ID 4RT7). Docking was carried out as described [54]. Hydrogen bonds are shown as orange dashed lines. The molecular surface of the binding pocket is colored according to hydrophobicity (polar regions colored magenta, hydrophobic regions colored green). The orange arrow indicates the exit vector for designing MA68-based PROTACs. B Structures of MA49 and MA50, including the FLT3 inhibitory scaffold from MA68, the VHL ligand in MA49, and the adamantly group mediating degradation-prone protein aggregation by MA50. C MOLM-13 cells were incubated with 10, 50, 100, and 200 nM MA49 or MA50 for 24 h (0, untreated control sample). Lysates of these cells were subjected to immunoblot analyses for FLT3, pY591-FLT3, and cleaved caspase-3. The protein levels of β-actin were determined to verify equal loading of samples on all tested membranes. The data are representative for the outcome of three independent experiments; cl., cleaved form, arrows point to the cleavage fragments of active caspase-3; p-, phosphorylated; kDa, molecular weight in kilodalton. D DC50 values for FLT3 degradation by MA49 and MA50 in MOLM-13 cells were determined by quantitative immunoblot using the Odyssey system. The cells were treated as stated in B) and lysates were analyzed for FLT3-ITD and β-actin. The values for FLT3 were normalized to β-actin and the DC50 values were calculated with GraphPad Prism 6. E IC50 values for apoptosis induction by MA49 and MA50 in MOLM-13 cells were determined by annexin-V and PI staining and flow cytometry. The cells were treated with 10, 100, or 1000 nM MA49 or MA50 for 72 h. IC50 values were calculated with GraphPad Prism 6. F RS4-11, MV4-11, and MOLM-13 cells were treated with 50 nM MA49 or MA50 for 24 h (+, treated; -, untreated). Lysates of these cells were subjected to immunoblot analyses for FLT3, cleaved caspase-3 (activated form upon cleavage of its autoinhibitory domain), cleaved PARP1, pY591-FLT3, pY694-STAT5, and pS473-AKT. The protein levels of vinculin and β-actin were determined to verify equal loading of samples on all tested membranes. The data are representative for the outcome of two independent experiments; cl., cleaved; p-, phosphorylated; kDa, molecular weight in kilodalton, arrows point to the cleavage fragments of active caspase-3.
Fig. 2
Fig. 2. FLT3-ITD TPDs are more effective cell death inducers than corresponding sole FLT3 inhibitors.
A Structure of MA72, which is a stereoisomer of MA49 that is unable to recruit VHL. B MOLM-13 and MV4-11 cells were treated with 100 nM MA49, MA72, or MA50 for 24 h (+, treated; -, untreated). Lysates of these cells were subjected to immunoblot analyses for FLT3, cleaved caspase-3, pY591-FLT3, pY694-STAT5, and pS473-AKT. The protein levels of β-actin were determined to verify equal loading of samples on all tested membranes. The data are representative for the outcome of three independent experiments; cl., cleaved form, arrows point to the cleavage fragments of active caspase-3; p-, phosphorylated; kDa, molecular weight in kilodalton. C The panel shows original flow cytometry data. MOLM-13 cells were treated with 100 nM MA49, MA50, or MA72 for 72 h and analyzed for apoptosis by annexin-V and PI staining using flow cytometry. D Apoptosis analysis of MOLM-13 cells by annexin-V and PI staining with flow cytometry. Treatments were 10, 100, and 1000 nM MA49, MA50, and MA72 for 72 h. The data are representative for the outcome of three independent experiments; -, untreated, +, 10 nM, ++ 100 nM, +++ 1000 nM. Two-way ANOVA statistical test was used to determine statistical significance; *p < 0.05; **p < 0.01; ***p < 0.001; ****p < 0.0001.
Fig. 3
Fig. 3. MA49 and MA50 are specifically toxic for AML cells carrying FLT3-ITD.
A MV4-11, MOLM-13, and RS4-11 cells were treated with 10, 100, or 1000 nM MA49 for 24 h and analyzed for apoptosis by annexin-V and PI staining using flow cytometry. The data are representative for the outcome of two independent experiments; +, 10 nM, ++ 100 nM, +++ 1000 nM. B MV4-11, MOLM-13, and RS4-11 cells were treated with 10 or 100 nM MA50 for 24 h and analyzed for apoptosis by annexin-V and PI staining using flow cytometry. The data are representative for the outcome of two independent experiments; +, 10 nM, ++ 100 nM. C MV4-11, HMC1.2 (carrying c-KIT with the activating mutations G560V and D816V), and RPE1 cells were treated with 50 nM MA49 or MA50 for 72 h and analyzed for apoptosis by annexin-V and PI staining using flow cytometry. The data are representative for the outcome of two independent experiments. D Apoptosis analysis of PBMC subpopulations after treatment with 20 or 50 nM of MA49 or MA50 for 24 h; PBMC, peripheral blood mononuclear cells; PMN, polymorphonuclear leukocytes; NK cells, natural killer cells; -, untreated, +, 20 nM, ++ 50 nM. The data are representative for the outcome of four independent experiments. Two-way ANOVA statistical test was used to determine statistical significance; ns, not significant; *p < 0.05; **p < 0.01; ***p < 0.001; ****p < 0.0001.
Fig. 4
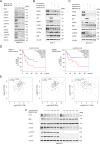
Fig. 4. MA49 and MA50 regulate heat shock- and ER-stress-related proteins in AML cells with FLT3-ITD.
A MOLM-13 cells were treated with 50 nM MA49 or MA50 for 24 h and analyzed by immunoblot for the expression of FLT3, HSP110, HSP90, HSP70, HSP27, BiP, pY591-FLT3, pY694-STAT5, and pS473-AKT. The protein levels of β-actin were determined to verify the equal loading of samples. The data are representative for the outcome of three independent experiments. B, C Immunoblot shows the expression of PERK, IRE1α, BiP, CHOP, pT982-PERK, BIM, and ATF6α (activated form upon cleavage in Golgi during ER stress) after treatment with 0.5 µg/ml tunicamycin or 50 nM MA49 or MA50 for 24 h in (B) MV4-11 or (C) MOLM-13 cells. The protein levels of β-actin or vinculin were determined to verify equal loading of samples. The data are representative for the outcome of two independent experiments; +, treated; -, untreated; p-, phosphorylated; kDa, molecular weight in kilodalton. D The GEPIA2 database was analyzed for a correlation between overall survival of AML patients and the levels of HSPs and ER stress proteins. We found significant associations of HSP110 (encoded by the HSPH1 gene) and HSP90 (encoded by the HSP90 gene) expression levels in leukemia cells and patient survival. The analysis included 54 patients in total, with 50% in the high and 50% in the low expressing groups (p = 0.089–0.086). E This database contains data showing an association of FLT3 gene expression and mRNA transcripts encoding HSP110, HSP90, and BIM (p = 0.0039–0.0063). Positive R values indicate positive coregulation of gene expression; negative R values indicate negative coregulation of gene expression; TPM, transcripts per million reads. The graphs show the Pearson correlation coefficients. Such correlation coefficients describe linear correlations between two sets of data. GEPIA2 uses the non-log scale for calculation and use the log-scale axis for visualization. F MOLM-13 cells were treated with 10 μg/ml cycloheximide +/− 50 nM MA49 for 1–5 h. Lysates were analyzed by immunoblot for the expression of FLT3, BIM, pY591-FLT3, pY694-STAT5, and pS473-AKT. The protein levels of β-actin or vinculin were determined to verify equal loading of samples; +, treated; -, untreated; p-, phosphorylated; kDa, molecular weight in kilodalton.
Fig. 5
Fig. 5. BIM regulates MA49- and MA50-mediated FLT3-ITD degradation and heat shock protein levels.
A MV4-11 cells were transfected with siRNA against the BCL2L11 mRNA to knock down the BIM protein. Cells without and with BIM knockdown were treated with 50 nM MA49 or MA50 for 24 h and analyzed by immunoblot for FLT3, BIM, pY591-FLT3, pY694-STAT5, cleaved (cl.) caspase-3, HSP110, HSP90, and HSP27. The protein levels of vinculin and β-actin were determined to verify the equal loading of samples. The data are representative for the outcome of four independent experiments; +, treated; -, untreated; cl., cleaved; p-, phosphorylated; kDa, molecular weight in kilodalton; siCtrl, siRNA control; siBCL2L11, siRNA targeting BIM, arrows point to the cleavage fragments of active caspase-3. B Quantification of FLT3 expression from A; siCtrl, siRNA control; siBCL2L11, BIM knockdown. One-way ANOVA statistical test was used to determine statistical significance; *p < 0.05; **p < 0.01; ***p < 0.001; ****p < 0.0001. C MV4-11 cells transfected with siRNA against siBCL2L11 +/− 1 h 250 nM Onalespib pre-treatment were treated with 50 nM MA49 or MA50 for 24 h and analyzed by immunoblot for FLT3, BIM, pY591-FLT3, and HSP90 expression; siCtrl, siRNA control; siBCL2L11, BIM knockdown; kDa, molecular weight in kilodalton. The protein levels of α-tubulin and β-actin were determined to verify the equal loading of samples. The data are representative for the outcome of two independent experiments; +, treated; -, untreated; cl., cleaved; p-, phosphorylated; kDa, molecular weight in kilodalton; siCtrl, siRNA control; siBCL2L11, siRNA targeting BIM. D Model showing the pharmacological mechanisms of the TPDs described in this manuscript and the associated molecular mechanisms in the upper panel; the lower panel serves as legend.
Fig. 6
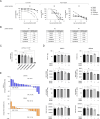
Fig. 6. MA49 kills FLT3 mutant AML blasts and cells in vitro and in vivo without an impact on hematopoietic stem cells.
A, B Serial dilutions of 50 µM top dose of MA49 versus MA72, MA68, sorafenib, and cytarabine were applied to primary ex-vivo samples from leukemia patients with wild-type FLT3 or FLT3-ITD for 72 h. Cell survival is provided as %-values compared to untreated control cells (100% survival) in the MTS-assay. B EC50 values for the data shown in (A) were determined. C Cell viability analysis of murine bone marrow stem cells. Bone marrow was collected from the hind legs of previously killed C57BL/6 mice. The cells were treated with the indicated concentrations of MA49, MA68, or a high concentration of 10% DMSO as a positive control for cytotoxicity for 24 h; Ctrl, untreated. One-way ANOVA statistical test was used to determine statistical significance; ns not significant; *p < 0.05; **p < 0.01; ***p < 0.001; ****p < 0.0001; n = 3, male and female. D Bone marrow cells were freshly isolated from C57BL/6 mice and cultured for 7 days in medium containing the inhibitors at 50–100 nM and supplementation with either GM-CSF to induce the differentiation of myeloid progenitor cells to BMDCs or M-CSF to induce the differentiation to BMDMs. After one week, we assessed the total cell number, viability and frequencies of CD11c+ (pan dendritic cell marker) or F4/80+ (macrophage marker) cells, the expression of their activation marker CD86, cell viability (negative for FVD), and the total cell numbers; -, untreated, +, 50 nM, ++ 100 nM; n = 3, male and female. E Waterfall plots demonstrating changes in tumor volume [%] for each individual zebrafish larvae engrafted with AML cells, from baseline (day 1 = start of the treatment) until day 3 after MV4-11 cell injection. Zebrafish larvae xenografts were treated with DMSO used as a solvent (n = 17 larvae; left) or 200 nM MA49 (n = 18 larvae; right) for 48 h; each bar reflects one individual xenograft. Numbers indicate the percentage of early larvae with progressive disease (PD), stable disease (SD) and partial response (PR) in each treatment group on day three.

Similar articles

References

    1. Müller JP, Schmidt-Arras D. Novel approaches to target mutant FLT3 leukaemia. Cancers. 2020;12:2806. - PMC - PubMed
    1. Short NJ, Nguyen D, Ravandi F. Treatment of older adults with FLT3-mutated AML: emerging paradigms and the role of frontline FLT3 inhibitors. Blood Cancer J. 2023;13:142. - PMC - PubMed
    1. Carneiro BA, El-Deiry WS. Targeting apoptosis in cancer therapy. Nat Rev Clin Oncol. 2020;17:395–417. - PMC - PubMed
    1. Döhner H, Wei AH, Appelbaum FR, Craddock C, DiNardo CD, Dombret H, et al. Diagnosis and management of AML in adults: 2022 recommendations from an international expert panel on behalf of the ELN. Blood. 2022;140:1345–77. - PubMed
    1. Li S, Li N, Chen Y, Zheng Z, Guo Y. FLT3-TKD in the prognosis of patients with acute myeloid leukemia: a meta-analysis. Front Oncol. 2023;13:1086846. - PMC - PubMed