. 2024 Sep 4:15:1430565.
doi: 10.3389/fgene.2024.1430565. eCollection 2024.

mtPCDI: a machine learning-based prognostic model for prostate cancer recurrence

Affiliations

mtPCDI: a machine learning-based prognostic model for prostate cancer recurrence

Guoliang Cheng et al. Front Genet. .

Abstract

Background: This research seeks to formulate a prognostic model for forecasting prostate cancer recurrence by examining the interaction between mitochondrial function and programmed cell death (PCD).

Methods: The research involved analyzing four gene expression datasets from The Cancer Genome Atlas (TCGA) and Gene Expression Omnibus (GEO) using univariate Cox regression. These analyses identified genes linked with mitochondrial function and PCD that correlate with recurrence prognosis. Various machine learning algorithms were then employed to construct an optimal predictive model.

Results: A key outcome was the creation of a mitochondrial-related programmed cell death index (mtPCDI), which effectively predicts the prognosis of prostate cancer patients. It was observed that individuals with lower mtPCDI exhibited higher immune activity, correlating with better recurrence outcomes.

Conclusion: The study demonstrates that mtPCDI can be used for personalized risk assessment and therapeutic decision-making, highlighting its clinical significance and providing insights into the biological processes affecting prostate cancer recurrence.

Keywords: machine learning; mitochondrial activity; programmed cell death; prostate cancer; targeted cancer therapy; tumor immune microenvironment.


Conflict of interest statement

The authors declare that the research was conducted in the absence of any commercial or financial relationships that could be construed as a potential conflict of interest.

Figures

FIGURE 1
FIGURE 1
Analysis framework.
FIGURE 2
FIGURE 2
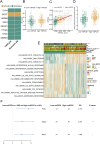
Prognostic model development and mtPCDI model (A) Volcano diagram depicting the gene expression differences between normal and cancerous prostate tissues. (B) Examination of differential gene expression associated with mitochondrial function and programmed cell death in prostate tumors versus normal tissue (C) Construction of prognostic models through the application of diverse machine learning algorithms. (D) Assessment of gene expression profiles within the GBM model stratified by mtPCDI categories.
FIGURE 3
FIGURE 3
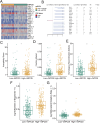
Prognostic significance of mtPCDI (A–C) RFS curves delineating different mtPCDI score categories within the PRAD TCGA, GSE116918, and GSE54460 cohorts. (D–F) ROC curves predicting RFS within 5 years using mtPCDI scores across the specified cohorts.
FIGURE 4
FIGURE 4
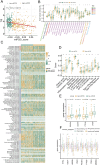
Pathway mechanisms across mtPCDI categories (A) Analysis of gene expression correlations with pathway activation levels. (B) Comparison of androgen receptor (AR) activity scores between high and low mtPCDI categories. Each box illustrates the quartile range of the data, with the median denoted by the horizontal line Statistical differences were assessed through the Wilcoxon test, as denoted by the significance levels. (C) Relationship between mtPCDI scores and tumor cell stemness metrics. (D) Differential analysis of mitochondrial metabolism-related KEGG enrichment pathway scores between high and low mtPCDI categories (***p < 0.001; **p < 0.01; *p < 0.05). (E) Heatmap representation of cancer-related pathway scores derived from gene expression data across mtPCDI categories. (F) Distinctions in mutation-driven pathway activities among mtPCDI categories.
FIGURE 5
FIGURE 5
Genomic characteristics of mtPCDI categories (A) Heatmap illustrating segmental copy number variations within different mtPCDI categories. (B) Forest plot indicating differences in somatic mutation rates for specific genes across mtPCDI categories. (C–G) Comparative genomic analysis of various genomic scores between high and low mtPCDI score categories. Each box illustrates the quartile range of the data, with the median denoted by the horizontal line Statistical differences were assessed through the Wilcoxon test, as denoted by the significance levels (***p < 0.001; **p < 0.01; *p < 0.05).
FIGURE 6
FIGURE 6
Immune microenvironment analysis by mtPCDI categories (A) Correlation of mtPCDI scores with the Tumor Inflammation Signature (TIS). (B) Evaluation of immune cycle scores across mtPCDI categories. (C) Heatmap integrating results from six immune cell analysis tools and ESTIMATE scores by mtPCDI category. (D) Variations in immune-related scores between high and low mtPCDI score categories. (E) Dissimilarities in prevalent immune checkpoint activities by mtPCDI category. (F) Expression variances of mtPCDI model genes within diverse immune subtypes. Each box illustrates the quartile range of the data, with the median denoted by the horizontal line Statistical differences were assessed through the Wilcoxon test, as denoted by the significance levels (***p < 0.001; **p < 0.01; *p < 0.05).
FIGURE 7
FIGURE 7
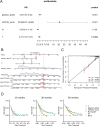
Independent prognostic value of mtPCDI in the immune context (A) Confirmation of mtPCDI score as an independent prognostic indicator. (B) Formulation of a multivariate clinical nomogram including the mtPCDI score. (C) Calibration plot for the clinical nomogram’s accuracy. (D) Decision curve analysis to compare the nomogram’s utility against other clinical predictors.
FIGURE 8
FIGURE 8
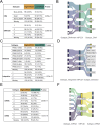
Multivariate subtype correlation with mtPCDI categories (A–F) Analysis encompassing Fisher’s tests and Sankey diagrams to explore the interrelations between mtPCDI categories and various genetic subtypes, including copy number variation, methylation, classical fusion mutations, integrative subtypes, and miRNA/mRNA subtypes.
FIGURE 9
FIGURE 9
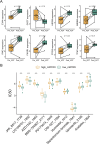
Drug sensitivity analysis by mtPCDI categories (A) Comparative gene expression analysis within the mtPCDI model pre- and post-androgen deprivation therapy (ADT). (B) The ten most significant differences in drug sensitivity between high and low mtPCDI score categories. Each box illustrates the quartile range of the data, with the median denoted by the horizontal line. Statistical differences were assessed through the Wilcoxon test, as denoted by the significance levels (***p < 0.001; **p < 0.01; *p < 0.05).

Similar articles

References

    1. Ahmad I., Newell-Fugate A. E. (2022). Role of androgens and androgen receptor in control of mitochondrial function. Am. J. Physiol. Cell Physiol. 323 (3), C835–C846. 10.1152/ajpcell.00205.2022 - DOI - PubMed
    1. Ali A., Kulik G. (2021). Signaling pathways that control apoptosis in prostate cancer. Cancers (Basel) 13 (5), 937. 10.3390/cancers13050937 - DOI - PMC - PubMed
    1. Bajpai P., Koc E., Sonpavde G., Singh R., Singh K. K. (2019). Mitochondrial localization, import, and mitochondrial function of the androgen receptor. J. Biol. Chem. 294 (16), 6621–6634. 10.1074/jbc.RA118.006727 - DOI - PMC - PubMed
    1. Barbieri C. E., Baca S. C., Lawrence M. S., Demichelis F., Blattner M., Theurillat J. P., et al. (2012). Exome sequencing identifies recurrent SPOP, FOXA1 and MED12 mutations in prostate cancer. Nat. Genet. 44 (6), 685–689. 10.1038/ng.2279 - DOI - PMC - PubMed
    1. Baumgartner V., Schaer D., Moch H., Salemi S., Eberli D. (2024). Mitochondrial elongation and ROS-mediated apoptosis in prostate cancer cells under therapy with apalutamide and complex I inhibitor. Int. J. Mol. Sci. 25 (13), 6939. 10.3390/ijms25136939 - DOI - PMC - PubMed

Grants and funding

The author(s) declare that no financial support was received for the research, authorship, and/or publication of this article.

LinkOut - more resources