. 2024 Sep 2;10(17):e37324.
doi: 10.1016/j.heliyon.2024.e37324. eCollection 2024 Sep 15.

Network pharmacology, molecular docking and experimental approaches of the anti-proliferative effects of Rhamnus prinoides ethyl-acetate extract in cervical cancer cells

Affiliations

Network pharmacology, molecular docking and experimental approaches of the anti-proliferative effects of Rhamnus prinoides ethyl-acetate extract in cervical cancer cells

Sally Wambui Kamau et al. Heliyon. .

Abstract

Background: Cervical cancer, one of the lethal cancers among women, is a challenging disease to treat. The current therapies often come with severe side effects and the risk of resistance development. Traditional herbal medicine, with its potential to offer effective and less toxic options, is a promising avenue. This study was undertaken to investigate the potential of Rhamnus prinoides (R. prinoides) root bark extracts in selectively inhibiting the proliferation of cervical cancer cells, using the HeLa cell line as an in vitro model.

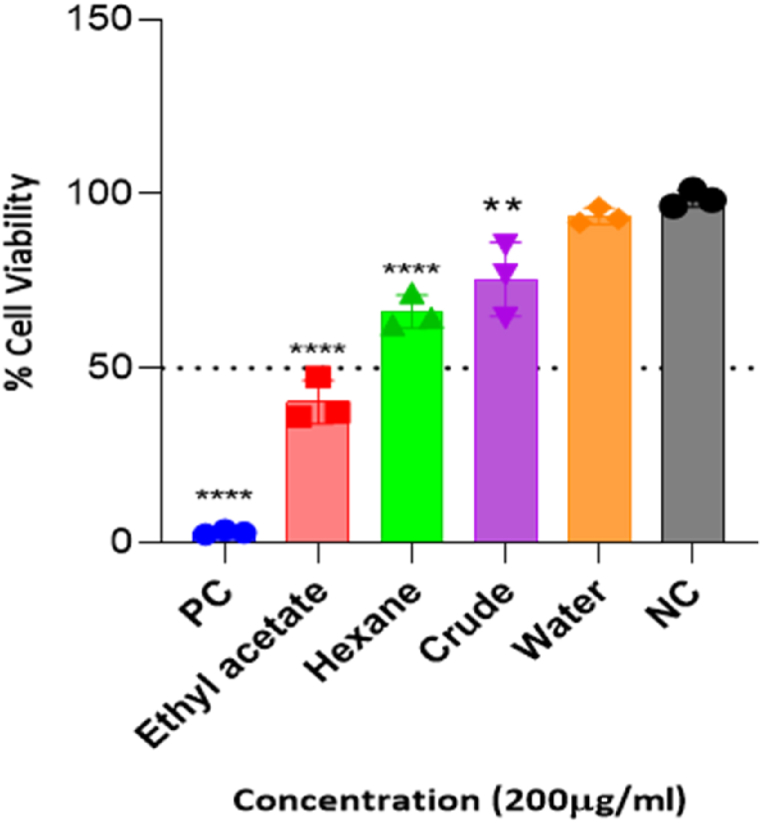
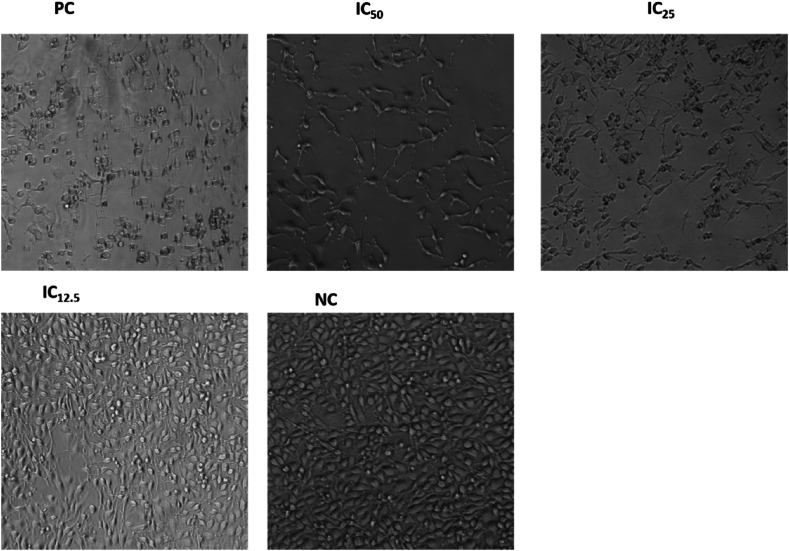
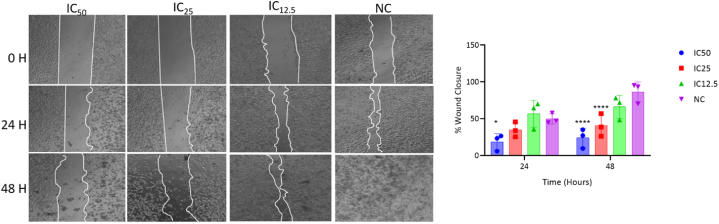
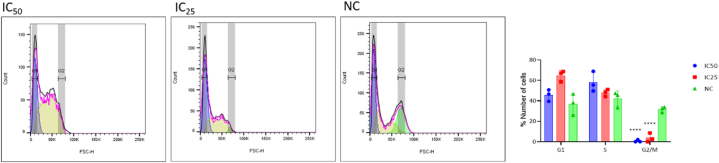
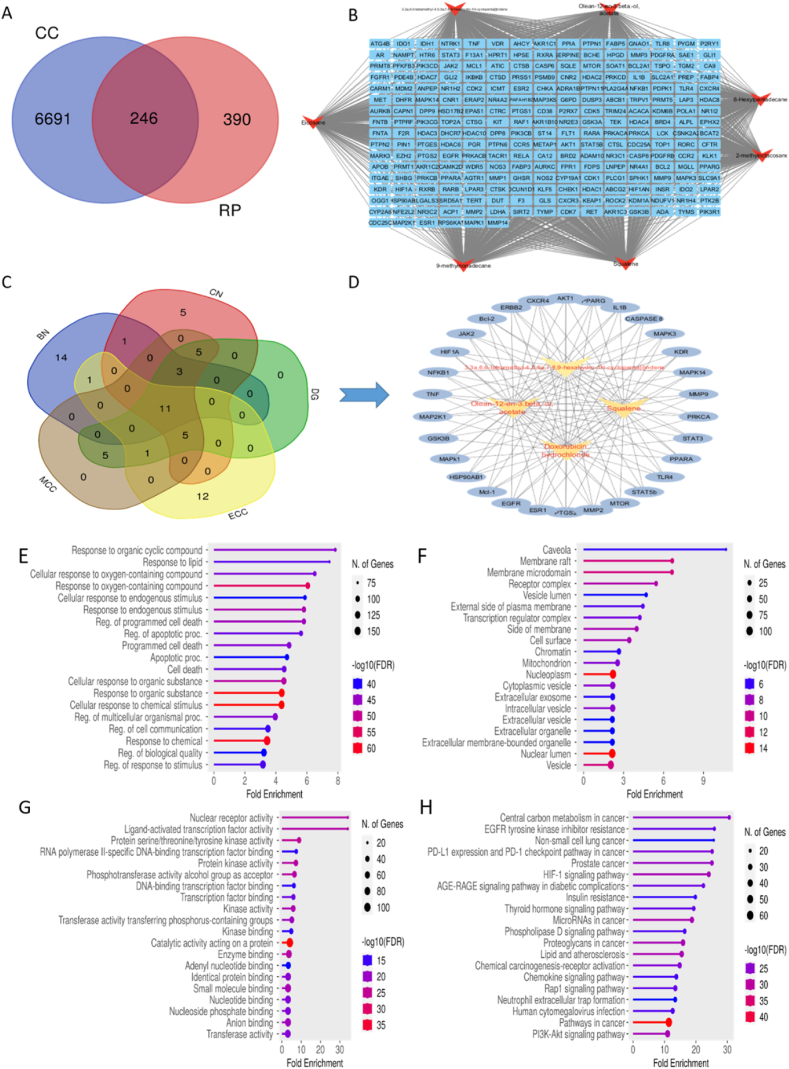
Methods: R. prinoides plant extracts were first screened at a fixed concentration of 200 μg/ml to determine the active extract. The selective anti-proliferative activity of the active extract was evaluated in a concentration dilution assay using the (3-(4,5-dimethylthiazol- 2-yl)-2,5-diphenyltetrazolium bromide) MTT assay on cancerous (HeLa) cells and non-cancerous (Vero) cells to determine the half-maximal inhibitory (IC50) and half-cytotoxic concentrations (CC50), respectively. Functional assays on cell morphology (by microscopy), cell migration (wound healing assay) and cell cycle (by flow cytometry) were also conducted. The active extract was analyzed using Gas Chromatography/Mass Spectrometry (GC/MS) to determine any compounds it contained. Following identification of possible gene targets by network pharmacology, the genes were validated by molecular docking and Real-Time Quantitative Polymerase Chain Reaction (RT-qPCR).

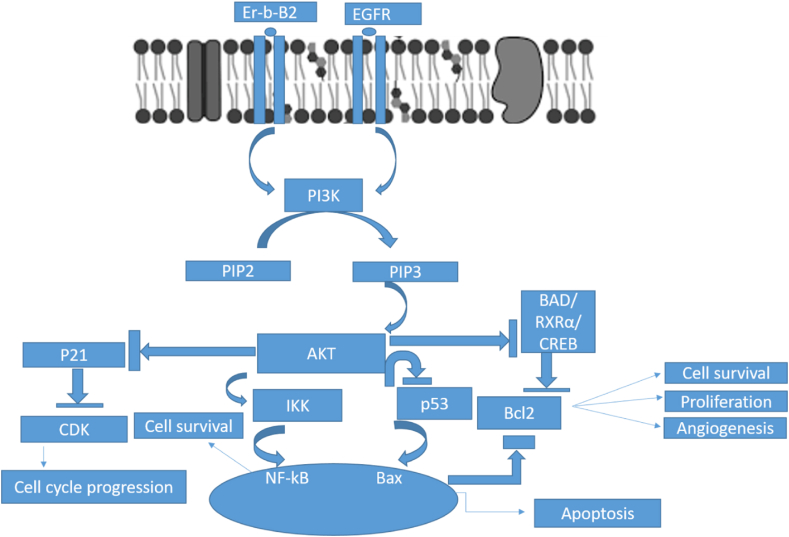
Results: The ethyl acetate extract of R. prinoides (EARP), the most active extract, selectively inhibited the growth of cervical cancer cells, their migration and induced cell cycle arrest at the S phase. In silico analysis revealed that squalene, 3,3a,6,6-tetramethyl-4,5,5a,7,8,9-hexahydro-1H-cyclopenta[i]indene and Olean-12-en-3.beta.-ol, acetate showed acceptable drug-like characteristics and may be partly attributed to the bioactivity demonstrated and the deregulation of the mRNA expression of AKT1, NF-κB, p53, Bax, Bcl-2, and Er-b-B2.

Conclusion: This study, for the first time, demonstrates the anti-proliferation effects of EARP and forms a firm foundation for further drug development studies.

Keywords: Anti-proliferative activity; Cervical cancer; Cytotoxicity; Network pharmacology; Rhamnus prinoides.


Conflict of interest statement

The authors declare that they have no known competing financial interests or personal relationships that could have appeared to influence the work reported in this paper.

Figures

Fig. 1
Fig. 1
Screening of the water-, crude-, hexane- and ethyl acetate extract extracts of R. prinoides at 200 μg/ml in HeLa cells. **p < 0.01, ****p < 0.0001 vs the negative control (0.4 % DMSO, NC). Doxorubicin hydrochloride was used as the positive control (PC). Data is represented as mean ± SD of three distinct experiments conducted in triplicate.
Fig. 2
Fig. 2
In vitro anti-proliferation effects of EARP in cervical cancer cells (HeLa) and Vero cells. A- Dose-dependent effect of EARP on HeLa cells. B- Dose dependent effect of EARP on Vero cells. **p < 0.01, ***p < 0.001, ****p < 0.0001 vs the negative control (0.4 % DMSO, NC). Data is represented as mean ± SD of three distinct experiments conducted using three technical replicates.
Fig. 3
Fig. 3
Phenotypic evidence of cytotoxicity of EARP at different concentrations in HeLa cells at ×200 magnification; NC- negative control (0.4 % DMSO) and PC-positive control.
Fig. 4
Fig. 4
Wound healing analysis of EARP in HeLa cells recorded at 0, 24 and 48 h at IC50, IC25 and IC12.5 concentrations with a graph showing the % wound closure at 24 and 48 h relative to 0 h on the right, captured at ×200 magnification. *p < 0.05, ****p < 0.0001 vs the negative control (0.4 % DMSO, NC). Data is represented as mean ± SD of three distinct experiments using three technical replicates.
Fig. 5
Fig. 5
Flow cytometric analysis of EARP at IC50 and IC25 concentrations relative to the negative control after treatment for 48 h in HeLa cells. The graphs show that majority of the cells in the treated groups accumulated in the S phase compared to cells in the negative control group that were able to move to the G2/M phase. Up to 10,000 cells were evaluated in every sample. ****P < 0.0001 vs NC. Data is represented as mean ± SD in triplicate.
Fig. 6
Fig. 6
In silico and network pharmacological analysis of the compounds and gene targets of EARP. A- Venn illustration of the common targets of EARP and cervical cancer; RP- Rhamnus prinoides, CC-cervical cancer B- Illustration of a generated compound-target network by Cytoscape. C-Venn illustration of the topmost 30 genes gotten from the Cytohubba plug in Cytoscape using BN (Betweenness), MCC (Maximal Clique Centrality), ECC (Eccentricity), DG (Degree) and CN (Closeness) parameters. D- Compound-target network of the top 30 hub genes and the selected compounds for molecular docking. E-GO enrichment assessment of the common gene targets of the compounds in EARP in biological processes, F- Cellular Component, G-Molecular Function. The bubble size depends on the number of genes associated the process, function or component where a larger bubble represents more genes and vice versa. The color shows the adjusted P-value for the pathway analysis, with the more red the bubble, the higher the FDR and vice versa. H- 6 KEGG pathway enrichment analysis. The KEGG terms are shown on the left vertical axis while the Log P values are shown on horizontal axis. On the right is the false discovery rate (FDR) which is indicated by the color intensity with the darker red color indicating a higher FDR. The bubble size corresponds to the number of genes associated with the pathway with a bigger bubble indicating a larger pool of genes compared to small bubbles on the plot. (For interpretation of the references to color in this figure legend, the reader is referred to the Web version of this article.)
Fig. 7
Fig. 7
In silico and survival analysis of the genes affected by the compounds in EARP. A- Heat map of the docking scores of the compounds in EARP as well as the positive control, doxorubicin hydrochloride and their protein targets. Key- A- 3,3a,6,6-tetramethyl-4,5,5a,7,8,9-hexahydro-1H-cyclopenta[i]indene, B- Olean-12-en-3.beta.-ol, acetate, C- Squalene and D- Doxorubicin hydrochloride. B- 3D diagrams of ligand-protein poses of docked genes and 2D illustrations of ligand-protein interactions respectively generated from Discovery Studio 2021.Key: I-EGFR+ 3,3a,6,6-tetramethyl-4,5,5a,7,8,9-hexahydro-1H-cyclopenta[i]indene, II- AKT1+ 3,3a,6,6-tetramethyl-4,5,5a,7,8,9-hexahydro-1H-cyclopenta[i]indene,III- Er-b-B2+Squalene. C- Target genes survival analysis gotten from the GEPIA database. I-Overall survival analysis of Er-b-B2, EGFR and NF-κB genes respectively; II- Disease free survival analysis of Er-b-B2, EGFR and NF-κB genes respectively.
Fig. 8
Fig. 8
The mRNA expression of EGFR, AKT1, Bax, Bcl-2, NF-κB, Er-b-B2 and p53 genes using RT-qPCR in HeLa cells after treatment with EARP for 48 h *p < 0.05, **p < 0.01 and ***p < 0.001 vs negative control (0.4 % DMSO, NC) generated using one-way ANOVA in Graph pad prism 8.0.2. Data is presented as mean ± SD conducted in triplicate.
Fig. 9
Fig. 9
Interaction of genes in the PI3K pathway and the compounds in EARP, following molecular docking analysis and validated by RT-qPCR and their consequences to cervical cancer progression.

Similar articles

References

    1. Ba D.M., Ssentongo P., Musa J., Agbese E., Diakite B., Traore C.B., et al. Prevalence and determinants of cervical cancer screening in five sub-Saharan African countries: a population-based study. Cancer Epidemiology. 2021;72 doi: 10.1016/j.canep.2021.101930. - DOI - PMC - PubMed
    1. Deo S.V.S., Sharma J., Kumar S. GLOBOCAN 2020 report on global cancer burden: challenges and opportunities for surgical oncologists. Ann. Surg Oncol. 2022;29:6497–6500. doi: 10.1245/s10434-022-12151-6. - DOI - PubMed
    1. Sung H., Ferlay J., Siegel R.L., Laversanne M., Soerjomataram I., Jemal A., et al. Global cancer statistics 2020: GLOBOCAN estimates of incidence and mortality worldwide for 36 cancers in 185 countries. CA A Cancer J. Clin. 2021;71:209–249. doi: 10.3322/caac.21660. - DOI - PubMed
    1. Kivuti-Bitok L.W., Pokhariyal G.P., Abdul R., McDonnell G. An exploration of opportunities and challenges facing cervical cancer managers in Kenya. BMC Res. Notes. 2013;6:136. doi: 10.1186/1756-0500-6-136. - DOI - PMC - PubMed
    1. Jedy-Agba E., Joko W.Y., Liu B., Buziba N.G., Borok M., Korir A., et al. Trends in cervical cancer incidence in sub-Saharan Africa. Br. J. Cancer. 2020;123(123):148–154. doi: 10.1038/s41416-020-0831-9. 1 2020. - DOI - PMC - PubMed

LinkOut - more resources