PANoptosis-related molecular clustering and prognostic signature associated with the immune landscape and therapy response in breast cancer
- PMID: 39287311
- PMCID: PMC11404910
- DOI: 10.1097/MD.0000000000039511
PANoptosis-related molecular clustering and prognostic signature associated with the immune landscape and therapy response in breast cancer
Abstract
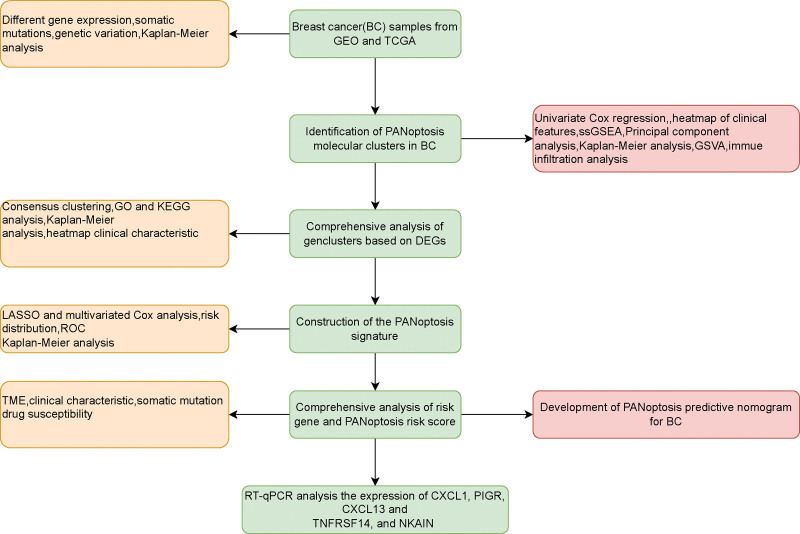
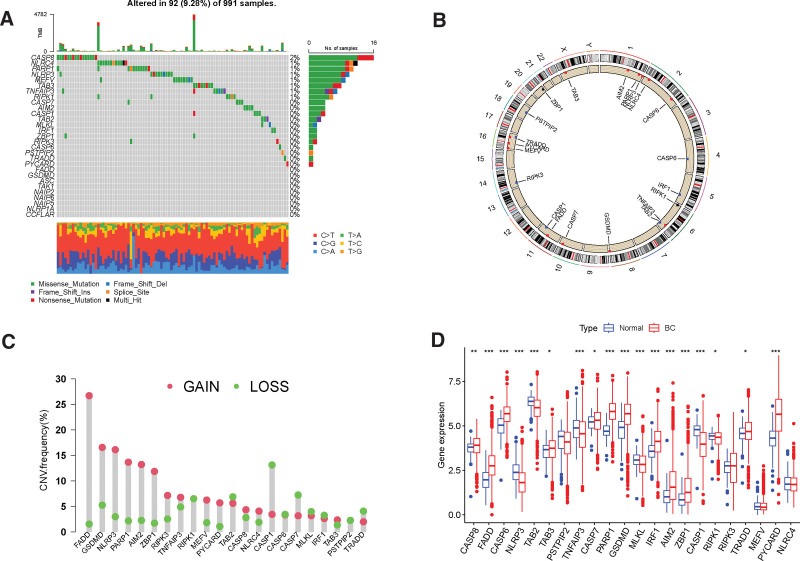
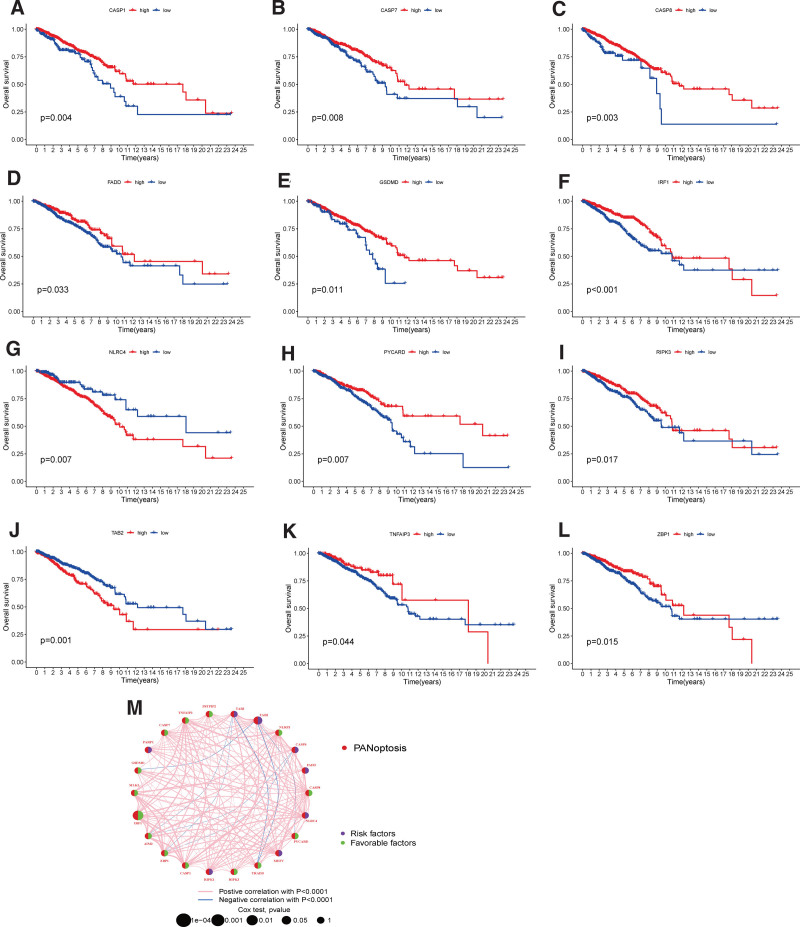
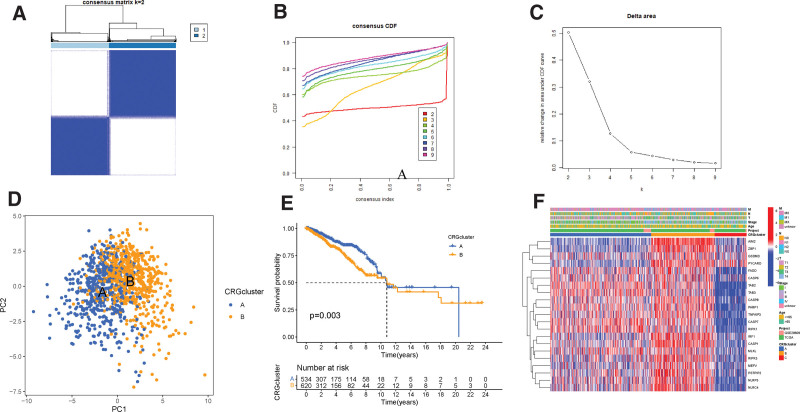
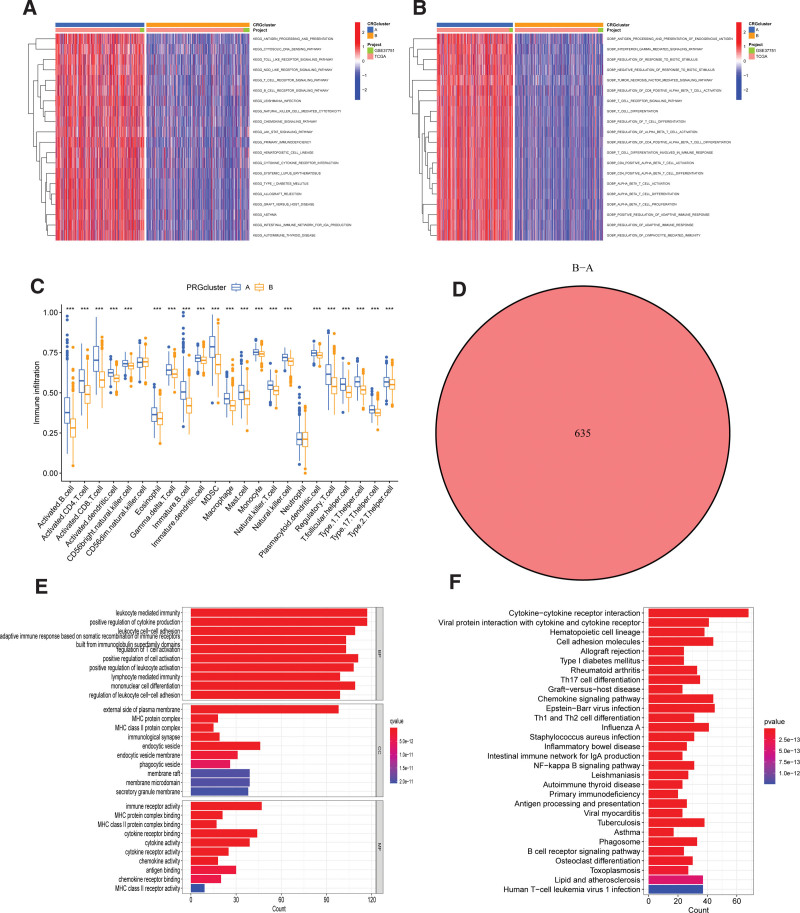
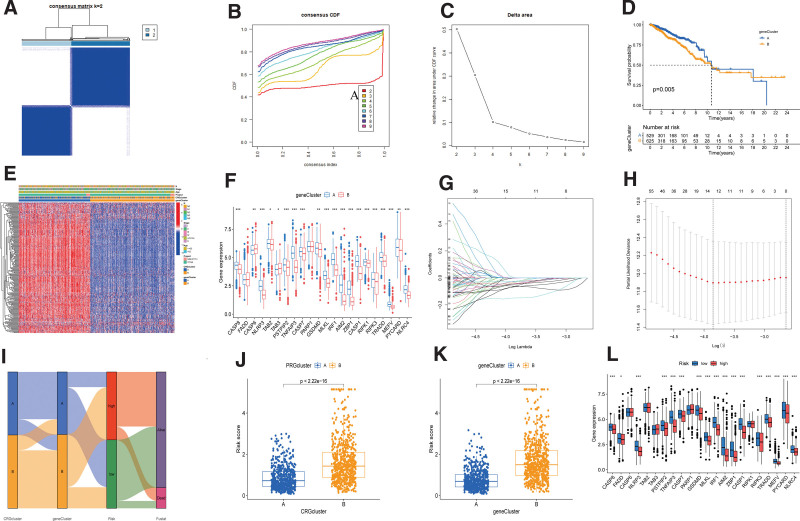
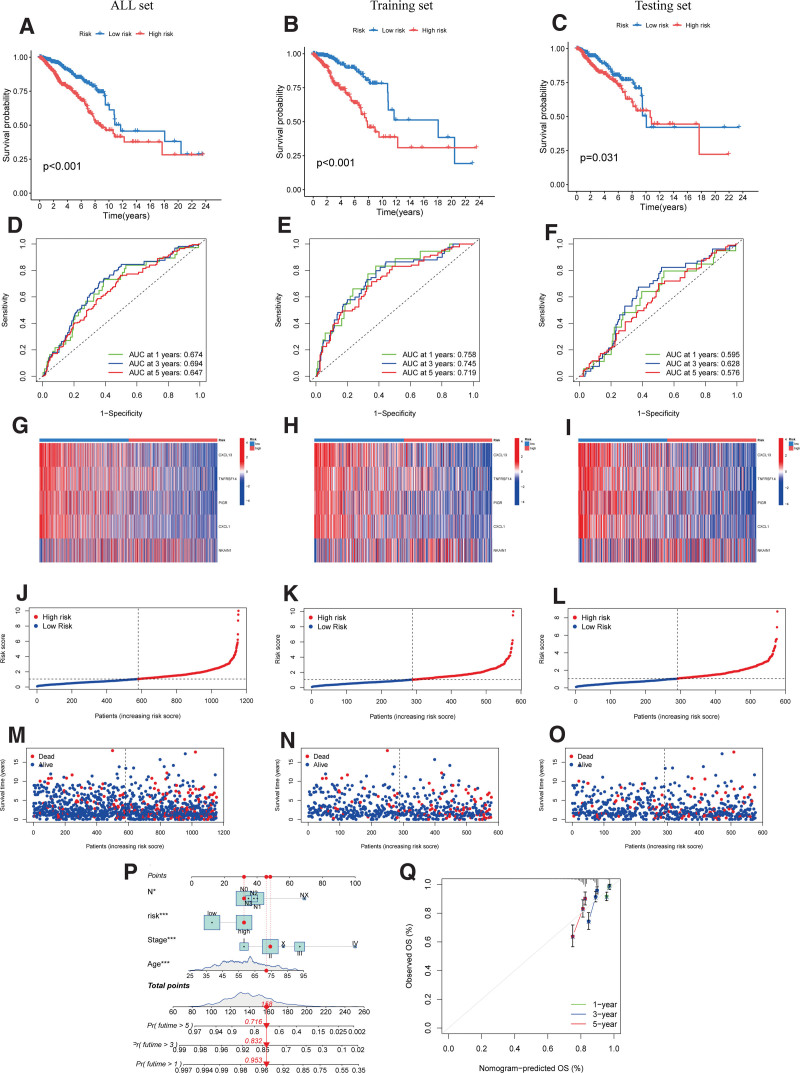
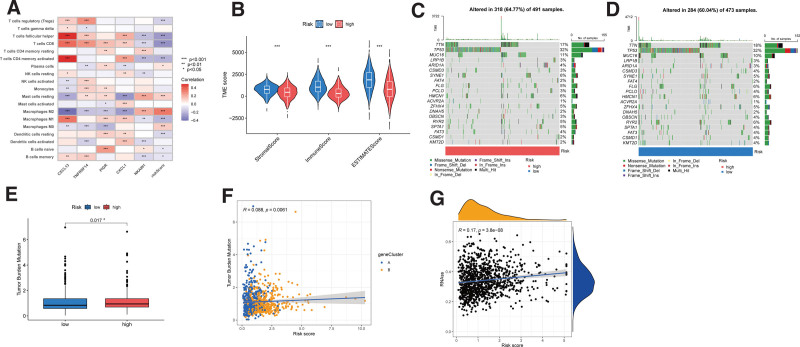
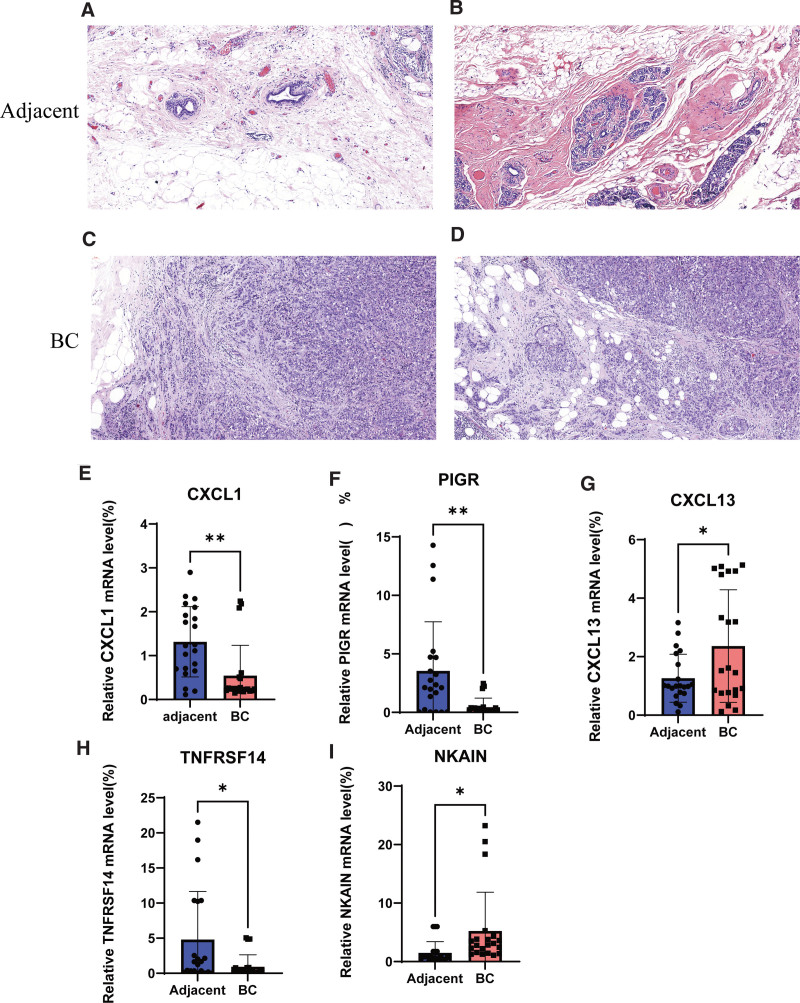
Breast cancer (BC) remains one of the most pervasive and complex malignancies. PANoptosis represents a recently identified cellular mechanism leading to programmed cell death. However, the prognostic implications and influence on the immune microenvironment of BC pertaining to PANoptosis-related genes (PRGs) remain significantly understudied. We conducted differential expression analysis to identify prognostic-Related PRGs by the Cancer Genome Atlas (TCGA) and the Gene Expression Omnibus (GEO) databases. Next, we identified the PANoptosis-related molecular subtype using the consensus clustering analysis, and constructed and validated the PANoptosis-related prognostic signature using LASSO and Cox regression analyses. ROC curves were employed to assess the performance of the signatures. Furthermore, drug sensitivity between low- and high-risk group were analysis. Finally, we conducted RT-qPCR to assess the gene expression levels involved in this signature. We categorized BC patients into 2 distinct molecular clusters based on PRGs and identified differentially expressed genes associated with prognosis. Subsequently, BC patients were then divided into 2 gene clusters. The identified PRGs molecular clusters and gene clusters demonstrated association with patient survival, immune system functions, and biological processes and pathways of BC. A prognostic signature comprising 5 genes was established, and BC patients were classified into low- and high-risk groups based on the risk scores. The ROC curves demonstrated that those in the low-risk category exhibited notably extended survival compared to the high-risk group. A nomogram model for patient survival was constructed based on the risk score in conjunction with other clinical features. High-risk group had higher tumor burden mutation, CSC index and lower StomalScore, ImmuneScore, and ESTIMATEScore. Subsequently, we established a correlation between the risk score and drug sensitivity among BC patients. Finally, qRT-PCR results showed that the expression of CXCL1, PIGR, and TNFRSF14 significantly decreased, while CXCL13 and NKAIN were significantly increased in BC tissues. We have developed a molecular clustering and prognostic signature based on PANoptosis to improve the prediction of BC prognosis. This discovery has the potential to not only assist in assessing overall patient prognosis but also to deepen our understanding of the underlying mechanisms of PANoptosis in BC pathogenesis.
Copyright © 2024 the Author(s). Published by Wolters Kluwer Health, Inc.
Conflict of interest statement
The authors have no conflicts of interest to disclose.
Figures
Similar articles
-
Identification of PANoptosis-related subtypes, construction of a prognosis signature, and tumor microenvironment landscape of hepatocellular carcinoma using bioinformatic analysis and experimental verification.Front Immunol. 2024 Apr 29;15:1323199. doi: 10.3389/fimmu.2024.1323199. eCollection 2024. Front Immunol. 2024. PMID: 38742112 Free PMC article.
-
Significance of novel PANoptosis genes to predict prognosis and therapy effect in the lung adenocarcinoma.Sci Rep. 2024 Sep 9;14(1):20934. doi: 10.1038/s41598-024-71954-7. Sci Rep. 2024. PMID: 39251701 Free PMC article.
-
Anoikis-related genes in breast cancer patients: reliable biomarker of prognosis.BMC Cancer. 2024 Sep 19;24(1):1163. doi: 10.1186/s12885-024-12830-5. BMC Cancer. 2024. PMID: 39300389 Free PMC article.
-
PANoptosis-based molecular clustering and prognostic signature predicts patient survival and immune landscape in colon cancer.Front Genet. 2022 Sep 14;13:955355. doi: 10.3389/fgene.2022.955355. eCollection 2022. Front Genet. 2022. PMID: 36186438 Free PMC article.
-
Identification of Novel Anoikis-Related Gene Signatures to Predict the Prognosis, Immune Microenvironment, and Drug Sensitivity of Breast Cancer Patients.Cancer Control. 2024 Jan-Dec;31:10732748241288118. doi: 10.1177/10732748241288118. Cancer Control. 2024. PMID: 39340434 Free PMC article.
References
-
- Siegel RL, Miller KD, Fuchs HE, Jemal A. Cancer statistics, 2022. CA Cancer J Clin. 2022;72:7–33. - PubMed
-
- Swaminathan H, Saravanamurali K, Yadav SA. Extensive review on breast cancer its etiology, progression, prognostic markers, and treatment. Med Oncol. 2023;40:238. - PubMed
-
- Goldhirsch A, Wood WC, Coates AS, Gelber RD, Thürlimann B, Senn H-J; Panel members. Strategies for subtypes--dealing with the diversity of breast cancer: highlights of the St. Gallen International Expert Consensus on the Primary Therapy of Early Breast Cancer 2011. Ann Oncol. 2011;22:1736–47. - PMC - PubMed
-
- Orrantia-Borunda E A-NP, Acuña-Aguilar LE, et al. . Subtypes of Breast Cancer [Internet]. Brisbane (AU): Exon Publications; 2022. https://www.ncbi.nlm.nih.gov/books/NBK583808/. - PubMed
MeSH terms
Substances
Grants and funding
LinkOut - more resources
Full Text Sources
Medical
Research Materials
Miscellaneous