The burgeoning spatial multi-omics in human gastrointestinal cancers
- PMID: 39285924
- PMCID: PMC11404479
- DOI: 10.7717/peerj.17860
The burgeoning spatial multi-omics in human gastrointestinal cancers
Abstract
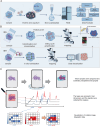
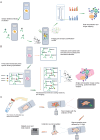
The development and progression of diseases in multicellular organisms unfold within the intricate three-dimensional body environment. Thus, to comprehensively understand the molecular mechanisms governing individual development and disease progression, precise acquisition of biological data, including genome, transcriptome, proteome, metabolome, and epigenome, with single-cell resolution and spatial information within the body's three-dimensional context, is essential. This foundational information serves as the basis for deciphering cellular and molecular mechanisms. Although single-cell multi-omics technology can provide biological information such as genome, transcriptome, proteome, metabolome, and epigenome with single-cell resolution, the sample preparation process leads to the loss of spatial information. Spatial multi-omics technology, however, facilitates the characterization of biological data, such as genome, transcriptome, proteome, metabolome, and epigenome in tissue samples, while retaining their spatial context. Consequently, these techniques significantly enhance our understanding of individual development and disease pathology. Currently, spatial multi-omics technology has played a vital role in elucidating various processes in tumor biology, including tumor occurrence, development, and metastasis, particularly in the realms of tumor immunity and the heterogeneity of the tumor microenvironment. Therefore, this article provides a comprehensive overview of spatial transcriptomics, spatial proteomics, and spatial metabolomics-related technologies and their application in research concerning esophageal cancer, gastric cancer, and colorectal cancer. The objective is to foster the research and implementation of spatial multi-omics technology in digestive tumor diseases. This review will provide new technical insights for molecular biology researchers.
Keywords: Esophageal cancer; Gastric cancer and colorectal cancer; Spatial metabolomics; Spatial proteomics; Spatial transcriptomics.
©2024 Liang et al.
Conflict of interest statement
The authors declare there are no competing interests.
Figures


Similar articles
-
Spatial multi-omics: deciphering technological landscape of integration of multi-omics and its applications.J Hematol Oncol. 2024 Aug 24;17(1):72. doi: 10.1186/s13045-024-01596-9. J Hematol Oncol. 2024. PMID: 39182134 Free PMC article. Review.
-
Spatial multi-omics: novel tools to study the complexity of cardiovascular diseases.Genome Med. 2024 Jan 18;16(1):14. doi: 10.1186/s13073-024-01282-y. Genome Med. 2024. PMID: 38238823 Free PMC article. Review.
-
Multi-omics based artificial intelligence for cancer research.Adv Cancer Res. 2024;163:303-356. doi: 10.1016/bs.acr.2024.06.005. Epub 2024 Jul 9. Adv Cancer Res. 2024. PMID: 39271266 Review.
-
Deciphering spatial domains from spatial multi-omics with SpatialGlue.Nat Methods. 2024 Sep;21(9):1658-1667. doi: 10.1038/s41592-024-02316-4. Epub 2024 Jun 21. Nat Methods. 2024. PMID: 38907114 Free PMC article.
-
Application of spatial omics in gastric cancer.Pathol Res Pract. 2024 Oct;262:155503. doi: 10.1016/j.prp.2024.155503. Epub 2024 Jul 30. Pathol Res Pract. 2024. PMID: 39128411 Review.
References
-
- Abbassi-Ghadi N, Antonowicz SS, McKenzie JS, Kumar S, Huang J, Jones EA, Strittmatter N, Petts G, Kudo H, Court S, Hoare JM, Veselkov K, Goldin R, Takáts Z, Hanna GB. De novo lipogenesis alters the phospholipidome of esophageal adenocarcinoma. Cancer Research. 2020;80(13):2764–2774. doi: 10.1158/0008-5472.CAN-19-4035. - DOI - PubMed
Publication types
MeSH terms
Grants and funding
LinkOut - more resources
Full Text Sources

