. 2024 Sep 16;15(1):8112.
doi: 10.1038/s41467-024-52154-3.

PRDM3/16 regulate chromatin accessibility required for NKX2-1 mediated alveolar epithelial differentiation and function

Affiliations

PRDM3/16 regulate chromatin accessibility required for NKX2-1 mediated alveolar epithelial differentiation and function

Hua He et al. Nat Commun. .

Abstract

While the critical role of NKX2-1 and its transcriptional targets in lung morphogenesis and pulmonary epithelial cell differentiation is increasingly known, mechanisms by which chromatin accessibility alters the epigenetic landscape and how NKX2-1 interacts with other co-activators required for alveolar epithelial cell differentiation and function are not well understood. Combined deletion of the histone methyl transferases Prdm3 and Prdm16 in early lung endoderm causes perinatal lethality due to respiratory failure from loss of AT2 cells and the accumulation of partially differentiated AT1 cells. Combination of single-cell RNA-seq, bulk ATAC-seq, and CUT&RUN data demonstrate that PRDM3 and PRDM16 regulate chromatin accessibility at NKX2-1 transcriptional targets critical for perinatal AT2 cell differentiation and surfactant homeostasis. Lineage specific deletion of PRDM3/16 in AT2 cells leads to lineage infidelity, with PRDM3/16 null cells acquiring partial AT1 fate. Together, these data demonstrate that NKX2-1-dependent regulation of alveolar epithelial cell differentiation is mediated by epigenomic modulation via PRDM3/16.


Conflict of interest statement

The authors declare no competing interests.

Figures
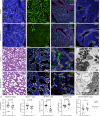
Fig. 1
Fig. 1. Decreased AT2 cell numbers and differentiation after deletion of Prdm3/16.
Immunofluorescence staining of embryonic lung indicates normal expression of NKX2-1 after deletion (ae), loss of PRDM16 staining in lung epithelium in Prdm3/16ShhCreΔ/Δ fetuses and retention in vascular smooth muscle (bf), n = 4 biological replicates. cg Normal proximal (SOX2 + ) and distal (SOX9 + ) epithelial patterning is observed, n = 2 control and 4 mutant embryos. dh At E14.5, the AT1 cell marker RAGE is increased in regions of Prdm3/16ShhCreΔ/Δ lungs, n = 3 biological replicates. im Hematoxylin and eosin staining of E18.5 lungs demonstrating poor sacculation in Prdm3/16ShhCreΔ/Δ n = 6 biological replicates. j, k, n, o Immunofluorescence staining for SFTPC and LAMP3 identifies AT2 cells; AT1 cells are stained for HOPX demonstrating paucity of AT2 cells and reduced LAMP3 expression, n = 3 biological replicates. lp Electron microscopy of E18.5 lung demonstrates absence of mature lamellar bodies in the Prdm3/16ShhCreΔ/Δ AT2 cells, LB (lamellar body), M (mitochondria), n = 3 biological replicates. q Quantification of AT2, AT1, and AT2/AT1 cell numbers at E18.5 from 3 control and 3 Prdm3/16ShhCreΔ/Δ fetuses. p-values were calculated using a 2-tailed Mann-Whitney test.
Fig. 2
Fig. 2. Single-cell RNA-seq (scRNA-seq) analysis of cellular and gene expression alterations in Prdm3/16ShhCreΔ/Δ mouse lung at E18.5.
a UMAP plots of mouse epithelial cell subsets, n = 2 biological replicates. b Alterations in cell type proportions within all epithelial (left panel) and within distal epithelial (right panel) cells. scRNA-seq data of epithelial cells in (a) were used for the cell type proportion calculations. Violin plot visualization of representative AT2 (c) and AT1 (d) associated RNAs, black dots and error bars represent mean ± SD; * identifies genes with statistically significant differences in expression as determined by a two-tailed Wilcoxon rank sum test p ≤ 0.05, fold change ≥1.5, and expression percentage ≥20% of the cells. e Immunofluorescence staining of differentially expressed AT1 and AT2 genes in E18.5 lungs, n ≥ 3 biological replicates of each genotype. f Pseudo-bulk correlation analysis with an independent mouse lung developmental time course scRNA-seq data (GSE149563) showing that alveolar epithelial cells from Prdm3/16ShhCreΔ/Δ mouse lungs are most similar to cells from earlier developmental time points.
Fig. 3
Fig. 3. Loss of Prdm3/16 influences cell differentiation.
ac Bulk RNA-Seq analysis of sorted EpCAM+ epithelial cells from E17.5 Control (n = 6) and Prdm3/16ShhCreΔ/Δ (Prdm3/16Δ/Δ) (n = 5) lungs. Wald test (default for DESeq2 r-package) was used for differential expression analysis utilizing standard cutoffs of |logfold change| > 0.58 and p-value < 0.05. a Volcano plot showing 1438 genes with decreased expression and 2124 genes with increased expression, highlighting genes that are associated with epithelial cell development and mis-regulated in AT1 and AT2 cells. b Heatmaps of normalized gene expression of AT1 and AT2 associated genes, showing an increase in genes associated with AT1 cells and a decrease in genes associated with AT2 cells, a reflection of cell type population size. Asterik (*) denotes statistical change in both bulk RNA-seq and single cell RNA-seq. c Functional enrichment of gene sets with either increased expression (left panel) or decreased expression (right panel) using ToppFun and selecting highly enriched GO: Biological Processes. p-values determined by the hypergeometric probability mass function and reported as a Benjamini and Hochberg corrected FDR < 0.05.
Fig. 4
Fig. 4. Changes in Chromatin Accessibility status following Prdm3/16 deletion.
a Heatmaps of ATAC-seq data made with the R package tornado plot showing 5067 regions with increased chromatin accessibility (left panel) or 4577 regions with decreased chromatin accessibility (right panel) in representative individuals, n = 6 controls and n = 5 Prdm3/16ShhCreΔ/Δ samples. Accessibility determined by differential accessibility analysis with R package DiffBind using a Wald Test with a |log2 fold change| cutoff of 0.58 and a p-value < 0.05. b Genomic distributions of each ATAC peakset, regions with increased or decreased accessibility, as annotated by HOMER annotatePeaks.pl. c Motif enrichment with HOMER searching either regions with increased or decreased accessibility, showing the putative transcription factors binding within these regions, p-value < 0.05, determined by binomial test comparing frequency of a given motif under a set of peaks compared to a randomly generated background. d ROC (Receiving Operating Characteristic) Curve and PR (Precision-Recall) Curves generated using gkmSVM to compare sequences under the open ATAC peaks trained against the closed ATAC peaks in Prdm3/16ShhCreΔ/Δ epithelial DNA. An AUC near one indicates the model is able to distinguish differences in the sequences within the peak sets. Error bars show variability in model performance, depending on how the data set is divided into training and testing subsets. e The transcription factors associated with the highest 500 and lowest 500 weighted kmers identified under the peaks using gkmSVM were identified using Tomtom (FDR < 0.05) and were graphed. f The UCSC Genome Browser was used to visualize selected changes in promoter and enhancer chromatin accessibility observed in Prdm3/16ShhCreΔ/Δ epithelial cells in differentially expressed genes associated with AT2 cell maturation.
Fig. 5
Fig. 5. Decreased H3K4me3 binding in genes with reduced expression.
a A Volcano plot of H3K4me3 differentially bound regions from CUT and RUN data identified 473 regions with decreased binding and 500 regions with increased binding in Prdm3/16ShhCreΔ/Δ E17.5 epithelial cells compared to controls, (n = 2 biological replicates of each genotype). The indicated genes had paralleling changes in gene expression. Differential expression was determined using a Wald Test (default for DESeq2 Rpackage) p-value < 0.05, |logfold change| > 0.58  . b The UCSC Genome Browser was used to visualize changes in promoter and enhancer binding by the H3K4me3 antibody in control and Prdm3/16ShhCreΔ/Δ epithelial cells.
Fig. 6
Fig. 6. PRDM16, NKX2-1, and PRDM3 bind to shared sites throughout the genome and at promoters.
a, b Genomic distributions of all called peaks from a representative PRDM16 binding experiment, (n = 2 replicates across two independent experiments)(a) and a representative NKX2-1 binding experiment, (n = 3 replicates across two independent experiments)(b) are shown. c Genomic distribution of the overlap of PRDM16 and NKX2-1 bound peaks that are marked by H3K4me3. d, e HOMER motif enrichment for all called peaks across the genome of a representative PRDM16 CUT&RUN (d) and a NKX2-1 CUT&RUN (e) experiment, p-value < 0.05, determined by binomial test comparing frequency of a given motif under a set of peaks compared to a randomly generated background. f, g Selected CUT&RUN gene tracks from H3K4me3, PRDM16, PRDM3, and NKX2-1 CUT&RUN experiments are visualized with the UCSC Genome Browser. AT1 and AT2 cell associated peaks were obtained from Little, et al.. ENCODE cCRE peaks are annotated from the ENCODE database of cis-regulatory elements. Binding is seen in both AT2 cell-associated genes (f) and AT1 cell-associated genes (g).
Fig. 7
Fig. 7. Protein interactions between PRDM16 and NKX2-1.
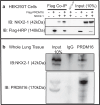
a Immunoprecipitation experiment demonstrates co-binding of FLAG-tagged PRDM16 and NKX2-1 after co-transfection in HEK293T cells, representative of 3 independent experiments. b Western blot analysis of E16.5 lung homogenates precipitated with anti-PRDM16 or IgG and immunoblotted with antibodies to PRDM16 and NKX2-1. Locations of the proteins are indicated, representative of 4 independent experiments.
Fig. 8
Fig. 8. AT2-specific PRDM3/16 deletion leads to lineage infidelity during alveolar epithelial specification.
a Dams were treated with tamoxifen at E12.5 and E13.5 to generate Prdm3/16SftpcCreER+/ΔRosa26lsl-tdTomato (Control) and Prdm3/16SftpcCreERΔ/ΔRosa26lsl-tdTomato (KO) fetuses which were harvested at E18.5 for lineage analysis. Control animals (bi) demonstrated a majority of cells in the Sftpc-lineage (SftpcLineage) were marked with only SFTPC protein by IHC (white arrowheads), while KO animals (jq) showed significant decreases in SFTPC-only cells (r), with corresponding increases in SftpcLineage cells expressing HOPX (s), either with concomitant SFTPC expression (t) (yellow arrowheads in l, m, p, q) or without (u)(green arrowheads in l, m, p, q). n = 6 control and n = 5 KO lungs. Significance was determined by unpaired 2-tailed t-Test. The graphs are min point to max point showing all points with the center as mean and the box is 25-75%. All scale bars are 50 μm.
Fig. 9
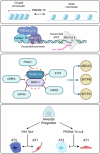
Fig. 9. Model of the role of PRDM3/16 in alveolar development.
PRDM3/16 participate in cell fate specification in the lung by modulating chromatin accessibility (top row) and by partnering with NKX2-1 and partner transcription factors to drive gene expression (second row) via a gene regulatory network required for terminal cell differentiation and surfactant expression in AT2 cells (third row). Loss of PRDM3/16 activity in lung endoderm leads to reduced AT2 quorum, failure of AT2 surfactant function, and transition to an immature AT1 phenotype (bottom panel). Figure created with BioRender.com released under a Creative Commons Attribution-Non-commercial-NoDerivs 4.0 International license.

Update of

Similar articles

References

    1. Whitsett, J. A., Kalin, T. V., Xu, Y. & Kalinichenko, V. V. Building and regenerating the lung cell by cell. Physiol. Rev.99, 513–554 (2019). 10.1152/physrev.00001.2018 - DOI - PMC - PubMed
    1. Sun, X. et al. A census of the lung: CellCards from LungMAP. Dev. Cell57, 112–145 e2 (2022). 10.1016/j.devcel.2021.11.007 - DOI - PMC - PubMed
    1. Zepp, J. A. & Morrisey, E. E. Cellular crosstalk in the development and regeneration of the respiratory system. Nat. Rev. Mol. Cell Biol.20, 551–566 (2019). 10.1038/s41580-019-0141-3 - DOI - PMC - PubMed
    1. Swarr, D. T. & Morrisey, E. E. Lung endoderm morphogenesis: gasping for form and function. Annu Rev. Cell Dev. Biol.31, 553–573 (2015). 10.1146/annurev-cellbio-100814-125249 - DOI - PMC - PubMed
    1. Minoo, P., Su, G., Drum, H., Bringas, P. & Kimura, S. Defects in tracheoesophageal and lung morphogenesis in Nkx2.1(−/−) mouse embryos. Dev. Biol.209, 60–71 (1999). 10.1006/dbio.1999.9234 - DOI - PubMed

LinkOut - more resources