Serum metabolomics profile identifies patients with community-acquired pneumonia infected by bacteria, fungi, and viruses
- PMID: 39283042
- PMCID: PMC11407381
- DOI: 10.1080/07853890.2024.2399320
Serum metabolomics profile identifies patients with community-acquired pneumonia infected by bacteria, fungi, and viruses
Abstract
Purpose: Patients with bacterial, fungal, and viral community-acquired pneumonia (CAP) were studied to determine their metabolic profiles.
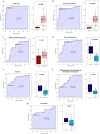
Methods: Loop-mediated isothermal amplification technology and nucleic acid sequence-dependent amplification combined with microfluidic chip technology were applied to screen multiple pathogens from respiratory tract samples. Eighteen patients with single bacterial infection (B-CAP), fifteen with single virus infection (V-CAP), twenty with single fungal infection (F-CAP), and twenty controls were enrolled. UHPLC-MS/MS analysis of untargeted serum samples for metabolic profiles. Multiple linear regression and Spearman's rank correlation analysis were used to determine associations between metabolites and clinical parameters. The sensitivity and specificity of the screened metabolites were also examined, along with their area under the curve.
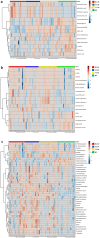
Results: The metabolic signatures of patients with CAP infected by bacteria, viruses, and fungi were markedly different from those of controls. The abundances of 45, 56, and 79 metabolites were significantly unbalanced. Among these differential metabolites, 11, 13, and 29 were unique to the B-CAP, V-CAP, and F-CAP groups, respectively. Bacterial infections were the only known causes of disturbances in the pentose and glucuronate and aldarate and ascorbate metabolism interconversions metabolic pathway.
Conclusions: Serum metabolomic techniques based on UHPLC-MS/MS may identify differences between individuals with CAP who have been infected by various pathogens, and they can also build a metabolite signature for early detection of the origin of infection and prompt care.
Keywords: Metabolomics profiles; bacterial infection; community-acquired pneumonia; diagnosis; fungal infection; viral infection.
Conflict of interest statement
No potential conflict of interest was reported by the authors.
Figures


Similar articles
-
Metabolic profiles in community-acquired pneumonia: developing assessment tools for disease severity.Crit Care. 2018 May 14;22(1):130. doi: 10.1186/s13054-018-2049-2. Crit Care. 2018. PMID: 29759075 Free PMC article. Clinical Trial.
-
Differences in inflammatory marker patterns for adult community-acquired pneumonia patients induced by different pathogens.Clin Respir J. 2018 Mar;12(3):974-985. doi: 10.1111/crj.12614. Epub 2017 Feb 15. Clin Respir J. 2018. PMID: 28139879
-
The Use of Polymerase Chain Reaction Amplification for the Detection of Viruses and Bacteria in Severe Community-Acquired Pneumonia.Respiration. 2016;92(5):286-294. doi: 10.1159/000448555. Epub 2016 Sep 21. Respiration. 2016. PMID: 27649510
-
Severe community-acquired pneumonia: optimal management.Curr Opin Infect Dis. 2017 Apr;30(2):240-247. doi: 10.1097/QCO.0000000000000349. Curr Opin Infect Dis. 2017. PMID: 28067676 Review.
-
Biomarkers in Pediatric Community-Acquired Pneumonia.Int J Mol Sci. 2017 Feb 19;18(2):447. doi: 10.3390/ijms18020447. Int J Mol Sci. 2017. PMID: 28218726 Free PMC article. Review.
References
-
- Arnold FW, Wiemken TL, Peyrani P, et al. . Mortality differences among hospitalized patients with community-acquired pneumonia in three world regions: results from the Community-Acquired Pneumonia Organization (CAPO) International Cohort Study. Respir Med. 2013;107(7):1101–1111. doi: 10.1016/j.rmed.2013.04.003. - DOI - PubMed
MeSH terms
Grants and funding
LinkOut - more resources
Full Text Sources
Other Literature Sources
Miscellaneous
